Comparing a Random Forest to a CART model (Part 2)
Random forest is one of the most commonly used algorithm in Kaggle competitions. Along with a good predictive power, Random forest model are pretty simple to build. We have previously explained the algorithm of a random forest ( Introduction to Random Forest ). This article is the second part of the series on comparison of a random forest with a CART model. In the first article, we took an example of an inbuilt R-dataset to predict the classification of an specie. In this article we will build a random forest model on the same dataset to compare the performance with previously built CART model. I did this experiment a week back and found the results very insightful. I recommend the reader to read the first part of this article (Last article) before reading this one.
[stextbox id=”section”] Background on Dataset “Iris” [/stextbox]
Data set “iris” gives the measurements in centimeters of the variables : sepal length and width and petal length and width, respectively, for 50 flowers from each of 3 species of Iris. The dataset has 150 cases (rows) and 5 variables (columns) named Sepal.Length, Sepal.Width, Petal.Length, Petal.Width, Species. We intend to predict the Specie based on the 4 flower characteristic variables.
We will first load the dataset into R and then look at some of the key statistics. You can use the following codes to do so.
[stextbox id=”grey”]
data(iris)
# look at the dataset
summary(iris)
# visually look at the dataset
qplot(Petal.Length,Petal.Width,colour=Species,data=iris)
[/stextbox]
[stextbox id=”section”] Results using CART Model [/stextbox]
The first step we follow in any modeling exercise is to split the data into training and validation. You can use the following code for the split. (We will use the same split for random forest as well)
[stextbox id=”grey”]
train.flag <- createDataPartition(y=iris$Species,p=0.5,list=FALSE)
training <- iris[train.flag,]
Validation <- iris[-train.flag,]
[/stextbox]
CART model gave following result in the training and validation :
Misclassification rate in training data = 3/75
Misclassification rate in validation data = 4/75
As you can see, CART model gave decent result in terms of accuracy and stability. We will now model the random forest algorithm on the same training dataset and validate it using same validation dataset.
[stextbox id=”section”] Building a Random forest model [/stextbox]
We have used “caret” , “randomForest” and “randomForestSRC” package to build this model. You can use the following code to generate a random forest model on the training dataset.
[stextbox id=”grey”]
> library(randomForest)
> library(randomForestSRC)
> library(caret)
> modfit <- train(Species~ .,method="rf",data=training)
> pred <- predict(modfit,training)
> table(pred,training$Species)

  pred       setosa versicolor virginica
 setosa        25       0          0
 versicolor     0      25          0
 virginica      0       0         25
[/stextbox]
Misclassification rate in training data = 0/75 [This is simply awesome!]
[stextbox id=”section”] Validating the model [/stextbox]
Having built such an accurate model, we will like to make sure that we are not over fitting the model on the training data. This is done by validating the same model on an independent data set. We use the following code to do the same :
[stextbox id=”grey”]
> train.cart<-predict(modfit,newdata=training)
> table(train.cart,training$Species)
> train.cart setosa versicolor virginica
  pred       setosa versicolor virginica
 setosa        25       0          0
 versicolor     0      22          0
 virginica      0       3         25
# Misclassification rate = 3/75[/stextbox]
Only 3 misclassified observations out of 75, signifies good predictive power. However, we see a significant drop in predictive power of this model when we compare it to training misclassification.
[stextbox id=”section”] Comparison between the two models [/stextbox]
Till this point, everything was as per books. Here comes the tricky part. Once you have all performance metrics, you need to select the best model as per your business requirement. We will make this judgement based on 3 criterion in this case apart from business requirements:
.1. Stability : The model should have similar performance metrics across both training and validation. This is very essential because business can live with a lower accuracy but not with a lower stability. We will give the highest weight to stability. For this case let’s take it as 5.
2. Performance on Training data : This is one of the important metric but nothing conclusive can be said just based on this metric. This is because an over fit model is unacceptable but will get a very high score at this parameter. Hence, we will give a low weight to this parameter (say 2).
3. Performance on Validation data : This metric catch holds of overfit model and hence is an important metric. We will score it higher than performance and lower than stability. For this case let’s take it as 3.
Note that the weights and scores entirely depends on the business case. Following is a score table as per my judgement in this case.
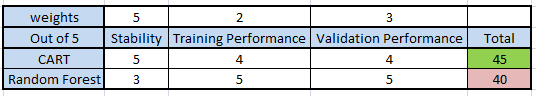 As you can see from the table that however Random forest gives me a better performance, I still will go ahead and use CART model because of the stability factor. Other factor in favor of CART model is the easy business justification. Random forest is very difficult to explain to people working on field. CART models are simple cuts which can be justified by simple business justification/reasons. But the choice of model selection is entirely dependent on business requirement.
[stextbox id=”section”] End Notes [/stextbox]
Every model has its own strength. Random forest, as seen from this case study, has a very high accuracy on the training population, because it uses many different characteristics to make a prediction. But, because of the same reason, it sometimes over fits the model on the data. CART model on the other side is simplistic criterion cut model. This might be over simplification in some case but works pretty well in most business scenarios. However, the choice of model might be business requirement dependent, it is always good to compare performance of different model before taking this call.
Did you find the article useful? Did this article solve any of your existing dilemmas? Have you compared the two models in any of your projects? If you did, share with us your thoughts on the topic.
If you like what you just read & want to continue your analytics learning, subscribe to our emails, follow us on twitter or like our facebook page.
Tavish Srivastava, co-founder and Chief Strategy Officer of Analytics Vidhya, is an IIT Madras graduate and a passionate data-science professional with 8+ years of diverse experience in markets including the US, India and Singapore, domains including Digital Acquisitions, Customer Servicing and Customer Management, and industry including Retail Banking, Credit Cards and Insurance. He is fascinated by the idea of artificial intelligence inspired by human intelligence and enjoys every discussion, theory or even movie related to this idea.


I would say this is not fair comparison. Random Forests are not meant for such small datasets essentially. Also try to use CART where p>n. Here is a Quote from Kaggle wiki on RFs. "Unlike single decision trees which are likely to suffer from high Variance or high [Bias] (depending on how they are tuned) Random Forests use averaging to find a natural balance between the two extremes." With increase in your data in either dimensions, RFs are much more stable in comparison to single trees because of inherent virtue of averaging.
Lalit, Thank you for bringing this up. As mentioned in the article, the choice is always made based on business requirement. The case in hand has low number of observation and has a clean split between different species. This is why CART works so well. For this reason my preference will be CART model, as random forest does not add a significant value in terms of predictive power and stability. But I would say, choosing an algorithm is more of an art than straight forward science. But I appreciate you bringing up a valid point to compare the two models. Tavish
Good explanation Tavish.Thank you for it.Would you mind explaining why you did your validation on the training data.set? Thats the data set you used to make your prediction model.you also have a validation(test) data set with you,isnt it?I might be wrong as I am a beginner in this.
Thank you for such simple explanation, it cleared my most of the doubts.
Hi Chirag, I think it's because we wanlted to validate if we're actually overfitting the model.
I took a look at your code and it appears you were making predictions on your training data set rather than your test data set. This almost certainly skews your results quite considerably. My guess is your prediction accuracy will go down quite a bit (similar to your CART predictions) if you make your predictions on your test data set.