One of the common problems people face in learning R for data science is lack of a structured path. They don’t know, from where to start, how to proceed, which track to choose? Though, there is an overload of good free resources available on the Internet, this could be overwhelming as well as confusing at the same time.
To create this R learning path, Analytics Vidhya and DataCamp sat together and selected a comprehensive set of resources to help you learn R from scratch. This learning path is a great introduction for anyone new to data science or R, and if you are a more experienced R user you will be updated on some of the latest advancements.
This will help you learn R quickly and efficiently. Time to have fun while lea-R-ning!
Step 0: Warming up
Before starting your journey, the first question to answer is: Why use R? or How would R be useful?
R is a fast growing open source contestant to commercial software packages like SAS, STATA and SPSS. The demand for R skills in the job marketing is rising rapidly, and recently companies such as Microsoft pledged their commitment to R as a lingua franca of Data Science.
Watch this 90 seconds video from Revolution Analytics to get an idea of how useful R could be. Incidentally Revolution Analytics just got acquired by Microsoft.
Step 1: Setting up your machine
The easiest way to set-up R is by downloading a copy of it on your local computer from the Comprehensive R Archive Network (CRAN). You can choose between binaries for Linux, Mac and Windows.
Although you could consider working with the basic R console, we recommend you to install one of R’s integrated development environment (IDE). The most well known IDE is RStudio, which makes R coding much easier and faster as it allows you to type multiple lines of code, handle plots, install and maintain packages and navigate your programming environment much more productively. An alternative to RStudio is Architect, an eclipse-based workbench.
(Need a GUI? Check R-commander or Deducer)
Assignment
- Install R, and RStudio
- Install Packages Rcmdr, rattle, and Deducer. Install all suggested packages or dependencies including GUI.
- Load these packages using library command and open these GUIs one by one.
Step 2: Learn the basics of R language
You should start by understanding the basics of the language, libraries and data structure.

If you prefer an online interactive learning environment to learn R’s syntax this free online R tutorial by DataCamp is a great way to get you going. Also check the successor to this course: intermediate R programming. An alternative learning tool is this online version of swirl where you can learn R in an environment similar to RStudio.
Next to these interactive learning environments, you can also choose to enroll in one of the Moocs available on Coursera or Edx.
In addition to these online resources, you can also consider the following excellent written resources:
- The free introduction to R manual by CRAN
- Jared Lander’s R for Everyone
- Quick-R
Specifically learn: read.table, data frames, table, summary, describe, loading and installing packages, data visualization using plot command
Assignment
- Take the free online R tutorial by DataCamp and become familiar with basic R syntax
- Create a github account at http://github.com
- Learn to troubleshoot package installation above by googling for help.
- Install package swirl and learn R programming (see above)
Step 3: Understanding the R community
 The major reason R is growing rapidly and is such a huge success, is because of its strong community. At the center of this is R’s package ecosystem. These packages can be downloaded from the Comprehensive R Archive Network, or from bioconductor, github and bitbucket. At Rdocumentation you can easily search packages from CRAN, github and bioconductor that will fit your needs for the task at hand.
Next to the package ecosystem R, you can also easily find help and feedback on your R endeavours. First of all there is R’s built-in help system which you can access via the command ? and the name of e.g. a function. There is also Analytics Vidhya Discussions, Stack Overflow where R is one of the fastests growing languages. To end, there are numerous blogs run by R enthusiast, a great collection of these is aggregated at R-bloggers.
Assignment
- Understand the R package ecosystem by visiting Cran Task Views
- Sign up at http://r-bloggers.com for the daily newsletter
Step 4: Importing and manipulating your data
Importing and manipulating your data are important steps in the data science workflow. R allows for the import of different data formats using specific packages that can make your job easier:
- readr for importing flat files
- The readxl package for getting excel files into R
- The haven package lets you import SAS, STATA and SPSS data files into R.
- Databases: connect via packages like RMySQL and RpostgreSQL, and access and manipulate via DBI
- rvest for webscraping
Once your data is available in your working environment you are ready to start manipulating it using these packages:
- The tidyr package for tidying your data.
- The stringr package for string manipulation.
- For data frame like objects learn the ins and outs of the dplyr package (try this course).
- Need to perform heavy data wrangling tasks? Check out the data.table package
- Performing time series analysis? Try out packages like like zoo, xts and quantmod.
Assignment
- Master the packages mentioned for importing data via this “Importing Data Into R” course, or read these articles 1,2,3 and 4.
- See this Data Wrangling with R video by RStudio
- Read and practice how to work with packages like dplyr, tidyr, and data.table.
Step 5: Effective Data Visualization
There is no greater satisfaction than creating your own data visualizations. However, visualizing data is as much of an art as it is a skill. A great read on this is Edward Tufte principles for visualizing quantitative data, or the pitfalls on dashboard design by Stephen Few. Also check out the blog FlowingData by Nathan Yau for inspiration on creating visualization using (mainly) R.
5.1: Plots everywhere
R offers multiple ways for creating graphs. The standard way is by making use of base graphics in R. However, there are way better tools (or packages) to create your graphs in a more simple way that will look on top of that way more beautiful:
 Start with learning the grammar of graphics, a practical way to do data visualizations in R.
 - Probably the most important package to master if you want to become serious about data visualization in R is the ggplot2 package. ggplot2 is so popular that there are tons of resources available on the web for learning purposes such as this online ggplot2 tutorial, a handy cheatsheet or this book by the creator of the package Hadley Wickham.
- A package such as ggvis allows you create interactive web graphics using the grammar of graphics (see tutorial)
- Know this ted talk by Hans Rosling? Learn how to re-create this yourself with googleVis (an interface with google charts).
- In case you run into issues plotting your data this post might help as well.
See more visualization option in this CRAN task view.
Alternatively look at the data visualization guide to R.
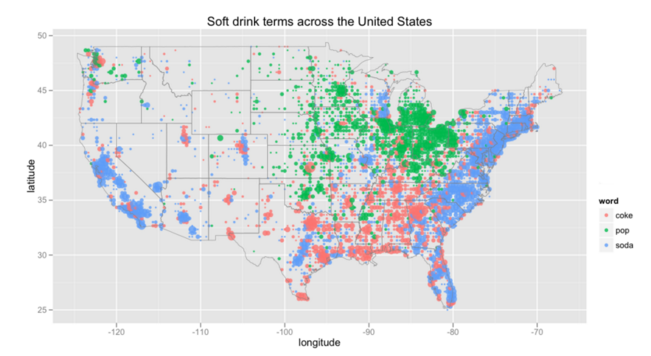
5.2: Maps everywhere
Interested in visualizing data on spatial analysis? Take the tutorial on Introduction to visualising spatial data in R and get started easily with these two packages:
- Visualize spatial data and models on top of static maps from sources such as Google Maps and Open Street Maps with ggmap.
- Ari Lamstein’s choroplethr
- The tmap package.
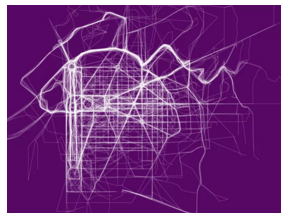
5.3: HTML widgets
A very promising new tool for visualizations in R is the usage of HTML widgets. HTML widgets allow you to create interactive web visualizations in an easy way (see the tutorial by RStudio) and mastering this type of visualizations is very likely to become a must have R skill. Impress your friends and colleagues with these visualizations:
- Dynamic maps with leaflet
- Time-series data charting using dygraphs
- Interactive tables (DataTables)
- DiagrammeR for diagrams and flowcharts
- D3 scatterplots, line charts, and histograms with MetricsGraphics
Assignment
- Make sure you have understand the principles of the grammar of graphics.
- Take the ggplot2 tutorial
- Follow the html widgets tutorial by RStudio
Step 6: Data Mining and Machine Learning
For those that are new to statistics we recommend these resources:
- Andrew Conway’s Introduction to statistics with R (online)
- Data Analysis and Statistical Inference by Duke University (online)
- Practical Data Science With R (book)
- Data Science Specialization by Johns Hopkins (online)
- A Survival Guide to Data Science with R (book)
If you want to sharpen your machine learning skills, consider starting with these tutorials:
- Essentials of Machine Learning Algorithms
- Bike Sharing Competition – Complete Solution in R
- Kaggle Machine Learning course
- Machine Learning Mastery
- Intro To Machine Learning
Make sure to see the various machine learning options available in R in the relevant CRAN task view.
Assignment
- Start off with one of the intro to statistics courses
- Take this free machine learning course by kaggle.
- If there is one book on data mining using R you want, it is on Rattle
- You can learn on time series forecasting from this booklet – A Little Book for Time Series in R .
Step 7: Reporting Results
Communicating your results and sharing your insights with fellow data science enthusiast is equally important as the analysis itself. Luckily R has some very nifty tools to do this that can save you a lot of time.
 The first is R Markdown , a great tool for reporting your data analysis in a reproducible manner based on knitr and pandoc. With R markdown, R generates a final document that replaces the R code with its results. This document can be in an html, word, pfd, ioslides, etc. format. You can learn more on it via this tutorial and use this cheat sheet a a reference.
Next to R Markdown there is also ReporteRs. ReporteRs is an R package for creating Microsoft (Word docx and Powerpoint pptx) and html documents and runs on Windows, Linux, Unix and Mac OS systems. Just like R Markdown it’s an ideal tool to automate reporting generation from R. See here how to get started.
Last but not least there is Shiny, one of the most exciting tools in R around at the moment. Shiny makes it incredibly easy to build interactive web applications with R. It allows you to turn your analysis into interactive web applications without needing to know HTML, CSS or Javascript. If you want to get started with Shiny (and believe us you should!), checkout the RStudio learning portal.
Assignment
- Create your first interactive report using RMarkdown and/or ReporteRs
- Try to build your very first Shiny app
Bonus Step: Practice
You will only become a great R programmer through practice. Therefore, make sure to tackle new data science challenges regularly. The best recommendation we can make to you here is to start competing with fellow data scientists on Kaggle: https://www.kaggle.com/c/titanic-gettingStarted.
Test your R Skills on live challenges – Practice Problems
Step 8: Time Series Analysis
R has a dedicated task view for Time Series. If you ever want to do something with time series analysis in R, this is definitely the place the start. You will soon see that the scope & depth of tools is tremendous.
You will not run out of online resources for learning time series analysis with R easily. Good starting points are A little book of R for time series or check out Forecasting: principles and practice. In terms of packages, you need to make sure that you are familiar with the zoo package and the xts. Zoo provides you a common used format for saving time series objects, while xts gives you the tools to manipulate your time series data sets.
Alternate resource: Comprehensive tutorial on Time Series
Assignment
- Take one of the recommended time series tutorials listed above so you are ready to start your own analysis.
- Use a package such as quantmod or quandl to download financial data and start your own time series analysis.
- Use a package such as dygraphs to create stunning visualizations of your time series data and analysis.
Bonus Step – Text Mining is Important Too!
To learn text mining, you can refer to text mining module from analytics edge course. Though, the course is archived, you can still access the tutorials.
Practice
Step 9: Becoming an R Master
Now that you have learnt most of data analytics using R , it is time to give some advanced topics a shot. There is a good chance that you already know many of these, but have a look at these tutorials too.
- Advanced R by Hadley Wickham
- Using R together with Hadoop, MongoDB or NoSQL
- The RevoScaleR package by Microsoft (formerly Revolution Analytics)