Introduction
If there are 2 fundamental trends driving digital journalism, it would be these:
- Increasing amount of data being generated and captured about their customers.
- Increasing web (or mobile) penetration among customers and need to tell data stories over the web.
This is where D3.js comes into picture. D3.js has become the holy grail of interactive data visualization.
D3.js vs. other alternatives
I think that the popularity of D3.js in data science fraternity is not in sync with its true potential. The main reason being that it requires a different skill set (for e.g. HTML, CSS and knowledge about JavaScript) than most of the mainstream tools for data science or machine learning. Also, there are readily available tools like QlikView and Tableau which provide this facility.
However, when you want customized dashboards / data stories delivered on web at a low cost, D3.js is one of the best tools available. And hence we thought of creating this learning path.

We’ve designed a learning path for novices below. If you find it intimidating at first, don’t worry that’s natural. But, if you promise to take your first step in D3.js, we promise that we’ll constantly help you in overcoming successive hurdles.
Note: This learning path has been designed assuming you are a newbie to coding and web development languages (HTML / CSS and JavaScript). If you know them already, you can skip the corresponding sections.
What is D3.js ?
 Data Driven Documents (D3) is a open source JavaScript library used to create dynamic, interactive visualizations enabled on modern web browser. It runs mainly using HTML, SVG, CSS and JavaScript. It was created by Mike Bostock, computer scientist & data visualization specialist (in image).
D3.js is extremely fast, responsive and supports large data sets too for creating dynamic animations in web browsers. The collection of useful coding components & plugins make d3 codes reusable.
Tip for beginners: If you are complete beginner, you might get confused between programming language Java and scripting language JavaScript. They are 2 completely independent languages. Java gets used majorly for software development and app development, while JavaScript is used to create interactive web pages.
Step 0: Motivation – Why learn D3.js ?
I truly believe in the Golden Circle explained by Simon Sinek. He says, if you are beginning with something, start with ‘Why’?
Before starting your journey, you should have answer to this question:
Why should I learn D3.js ?
or
How will D3.js help me?
Let me help you to find its answer. Watch this talk by Scott Murray, Author of Interactive Data Visualization for the Web, to understand the true power of creating web enabled visualizations.
5 Real World Examples
This is important. Let me show you some of the visualizations being created using d3. You need not analyze these visualization, but do gather inspiration and the urge to create one.
- Stoppage made by Police in January 2012 in New York
- Markov Process
- Visual Introduction to Machine Learning
- Race Track leads to Victory
- Connections between Oscar Contenders
I would strongly suggest to spend some time on each of these pages interacting with the elements on these pages. You will start seeing the power of what D3.js can deliver for you!
Scroll through More than 600 examples on D3.
Importance of Data Visualization
If you’ve checked the examples above, I’m sure I don’t need to lay emphasis of importance of visualizing data. You already know how well can the data speak for itself. As a data scientist, your real motive should be explaining the model to stakeholders. The real comes in presenting data to non-analytics stakeholders. They don’t want numbers, but a beautifully crafted story using numbers. If you are able to accomplish this task using D3, great job.
Step 1: Learning the basics – HTML, CSS, SVG, Javascript
First clear your basics of coding. If you have no prior knowledge of coding, start with HTML & CSS course from Codecademy. It’s an interactive course and best place to start.
Once you are finished with HTML & CSS, proceed to learn the fundamentals of Javascript. You can take the Javascript course from Codecademy too.
You can also check out Dash from General Assembly to learn HTML, CSS and JavaScript in an interactive manner. Once you are finished with Javascript, proceed to jQuery. Stick to codecademy once again. It’s a short course. But, very helpful for D3.
Lastly, you need Scalable Vector Graphics (SVG). It plays a vital role in creating various embedded shapes in a d3 visualization. For this, you can follow this tutorial from w3schools.
By this time, you should be able to create basic interactive web pages. Now is the time to gain some hands on experience.
Test your skills: To evaluate your knowledge of HTML, CSS, Javascript, do this exercise of creating web projects. This should help you gain confidence at coding.
Additional: If you still feel diving deep in these fundamentals, take this complete course from Freecodecamp. If you successfully complete all levels in this course, you are more than good to proceed to next step.
Step 2: Downloading, Installing and running D3.js
Now you need to install a text editor where you can code. This is a crucial. Selecting a good text editor provides a real boost and excitement to code. I use, prefer and recommend Sublime Text. It’s a open source, fast and simple to use editor. It is supported by various useful plugins and customization options to make coding experience awesome.
After you’ve installed a text editor, next step is to download and install d3.js library, which is quite simple too.
You can download the complete d3 zip file from here. Create a folder in your local machine, and unzip it. You’ll find the javascript files with name d3.js and d3.min.js.
To load d3 library in your text editor, you can do it in multiple ways, either from your local machine or from its source. Don’t forget to add this script in <head></head> section:
<!--Load D3 from source website-->
<script src="http://d3js.org/d3.v3.min.js"></script>
<!--Load D3 from local machine-->
<script type="text/javascript" src="d3.min.js"></script>
Step 3: Start Working on D3 – first example
Next you should work along chapter 1b of the course from Udacity. It will introduce you to D3 concepts through a simple example. Once you have worked through a basic example, you can go through more details on how to create data based elements
You can look at either:
- Chapter 7 – Chapter 20 from dashingd3 tutorials; or
- Chapter 4 – Chapter 17 from Book from Scott Murray
Both of these cover various aspect of d3 in detail, assuming you have prior knowledge of html, css, javascript.
Step 4: Practice Time
By now, you should have gained working knowledge of d3. You should now feel comfortable coding using these different languages. Let’s now practice some basic visualization techniques which you have learnt in steps above.
The idea behind these examples is to make you practice. Do not check code at first. Try it yourself first. Then, go through solution if you get stuck.
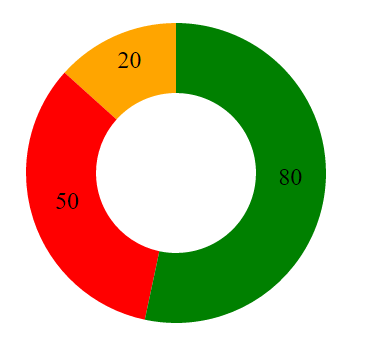
Example 1 – Create a Pie Chart
<!DOCTYPE html>
<html>
<head>
 <title>Path with Line</title>
 <script type="text/javascript" src="d3.min.js"></script>
</head>
<body>
<script>
       var data = [20, 50, 80];
       var r = 150;

       var canvas = d3.select("body").append("svg")
                    .attr("width", 1500)
                    .attr("height", 1500);
       var color = d3.scale.ordinal()
                   .range(["orange", "red", "green"]);
       var group = canvas.append("g")
                   .attr("transform", "translate(200, 200)");
       var arc = d3.svg.arc()
                .innerRadius(80)
                .outerRadius(r);
       var pie = d3.layout.pie()
                 .value ( function(d) { return d; });
       var arcs = group.selectAll(".arc")
                 .data(pie(data))
                 .enter()
                 .append("g")
                 .attr("class", "arc");
       arcs.append("path")
       .attr("d", arc)
       .attr("fill", function(d) { return color(d.data)});
       arcs.append("text")
       .attr("transform", function(d) { return "translate(" + arc.centroid(d) + ")"; })
       .attr("text-anchor", "middle")
       .attr("font-size", "1.5em")
       .text(function(d) { return d.data; });
</script>
</body>
</html>
Output: It looks something like this:
Example 2 – Create an animated Bar Chart
<!DOCTYPE html>
<html>
<head>
      <script type="text/javascript" src="d3.min.js"></script>
</head>
<body>

      <div class="container">
           <h2>Animated Bar Chart</h2>
                 <div id="chart"></div>
      </div>
<script>

       var bardata = [];

       for (var i=0; i<50; i++){
            bardata.push(Math.round(Math.random()*30))
       }

       bardata.sort(function compareNumbers(a,b){
            return a-b;
       })
             var margin = { top: 30, right: 30, bottom: 40, left: 50}

             var height = 400 - margin.top - margin.bottom,
                 width = 600 - margin.right - margin.left,
                 barWidth = 50,
                 barOffset = 5;

             var tempColor;

             var tooltip = d3.select('body').append('div')
                          .style('position', 'absolute')
                          .style('padding', '0 10px')
                          .style('background', 'white')
                          .style('opacity', 0)

             var yScale = d3.scale.linear()
                         .domain([0, d3.max(bardata)])
                         .range([0, height])

             var xScale = d3.scale.ordinal()
                         .domain(d3.range(0,bardata.length))
                         .rangeBands([0,width], .3)

             var color = d3.scale.linear()
                         .domain([0, bardata.length*.63, bardata.length])
                         .range(['#ffb832','#c61c6f','#d33682'])


             var myChart = d3.select('#chart').append('svg')
                         .style('background', '#e7e0cb')
                         .attr('width', width + margin.left + margin.right)
                         .attr('height', height + margin.top + margin.bottom)
                         .append('g')
                         .attr('transform','translate(' + margin.left+','+ margin.top + ')')
                         .selectAll('rect')
                         .data(bardata)
                         .enter()
                         .append('rect')

                          .style('fill', function(d,i){
                                 return color(i);
                             })
                         .attr('width', xScale.rangeBand())
                         .attr('x', function(d,i){
                                return xScale(i);
                             })
                         .attr('height', 0)
                         .attr('y', height)

                         .on('mouseover', function(d){

                             tooltip.transition()
                               .style('opacity', 0.9)
                             tooltip.html(d)
                                     .style('left', (d3.event.pageX - 35)+'px')
                                     .style('top', (d3.event.pageY - 40)+'px')


                         tempColor = this.style.fill;
                         d3.select(this)
                           .style('opacity', .5)
                           .style('fill', 'yellow')
                         })
                        .on('mouseout', function(d){
                          d3.select(this)
                               .style('opacity', 1)
                               .style('fill', tempColor)
                         })

                         myChart.transition()
                                .attr('height', function(d){
                                       return yScale(d);
                         })
                                .attr('y', function(d){
                                       return height - yScale(d);
                         })
                        .delay(function(d,i){
                                return i*20;
                         })
                        .duration(5000)
                        .ease('elastic')

            var vGuideScale = d3.scale.linear()
                              .domain([0, d3.max(bardata)])
                              .range([height, 0])

            var vAxis = d3.svg.axis()
                        .scale(vGuideScale)
                        .orient('left')
                        .ticks(10)

            var vGuide = d3.select('svg').append('g')
                vAxis(vGuide)

                vGuide.attr('transform','translate('+margin.left+',' + margin.top + ')')
                vGuide.selectAll('path')
                      .style({fill: 'none', stroke: '#000'})
                vGuide.selectAll('line')
                      .style({stroke: '#000'})

            var hAxis = d3.svg.axis()
                      .scale(xScale)
                      .orient('bottom')
                      .tickValues(xScale.domain().filter(function(d,i){
                           return !(i % (bardata.length/5));
                       }))

            var hGuide = d3.select('svg').append('g')
                        hAxis(hGuide)
                hGuide.attr('transform', 'translate('+margin.left+',' + (height + margin.top)                            + ')')
                hGuide.selectAll('path')
                      .style({fill: 'none', stroke: '#000'})
                hGuide.selectAll('line')
                      .style({stroke: '#000'})

</script>
</body>

</html>
Output: This bar chart looks something like this: Click Here
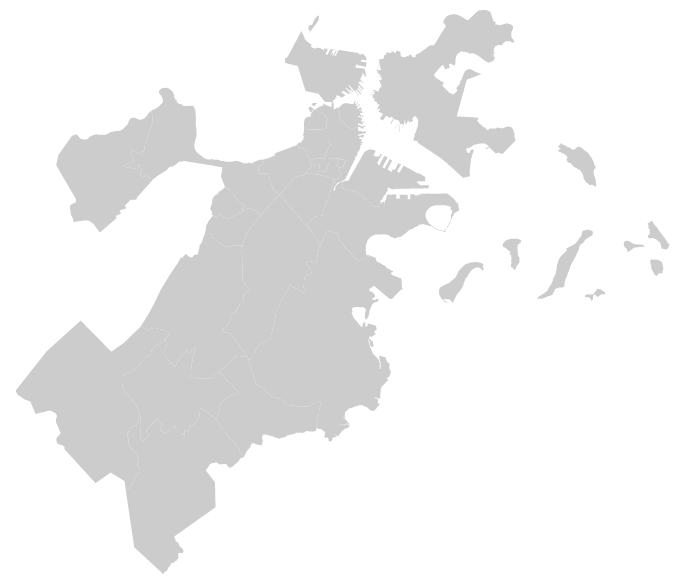
Example 3: Create a simple map outline
I have demonstrated this example using boston neighbourhood map. The idea is to understand the essentials of map making, without diving into the fancy things.
<html>
   <head>
       <title>Basic D3 map</title>
       <script src="http://d3js.org/d3.v3.min.js" charset="utf-8"></script>
       <script src="neighborhoods.js"></script>
</head>
<body>
    <script>
          var width = 700,
          height = 580;

          var svg = d3.select( "body" )
                   .append( "svg" )
                   .attr( "width", width )
                   .attr( "height", height );

          var g = svg.append( "g" );

          var albersProjection = d3.geo.albers()
              .scale( 190000 )
              .rotate( [71.057,0] )
              .center( [0, 42.313] )
              .translate( [width/2,height/2] );

          var geoPath = d3.geo.path()
              .projection( albersProjection );

          g.selectAll( "path" )
           .data( neighborhoods_json.features )
           .enter()
           .append( "path" )
           .attr( "fill", "#ccc" )
           .attr( "d", geoPath );

  </script>
</body>
</html>
Output: This is the outline of boston neighbourhood map:
These examples are just to whet your appetite. The real game begins while dealing with animated geographical maps. Once you feel comfortable creating these elementary visualizations, proceed to the next level. For maps, d3 works best with geojson and topojson formats. Geojson is the default geographic data file. But, topojson is considered to be faster and is capable to load large data sets in small size (compressed data).
Other Useful Resources
Here are some more useful resources which you might find helpful:
- Github Repository of d3.js Tutorials
- Complete Udacity Course on d3.js
- Best Youtube Tutorial on d3.js
- D3 Official Website
- D3 Tips and Tricks – Free eBook
Still, if you find D3 difficult to learn, feel free to share your problems in the comments section below.