Common data preparation mistakes and how to avoid them?
A few days back, one of my friend was building a model to predict propensity of conversion of leads procured through an Online Sales partner. While presenting his findings to stakeholders, one of the insights he mentioned lead to a very involved discussion in the room. The insight was as follows:
The higher the number of times a lead is shared by partner, higher are its chances of conversion.
Following arguments were presented during the debate which ensued:
Group 1 (Pro-insight) main hypothesis:
- Higher the number of times a lead has visited the sales partner website, higher is the chance that he would be interested in buying the product.
Group 2 (Against-insight) main hypothesis:
- If we were not able to convert a lead into a customer on multiple occassions before, the customer might not be interested in our product and hence it sounds counter-intuitive that these customers have higher conversion.
Upon deeper examination the analyst mentioned casually:
If a lead shared multiple times converted into a sale, all the instances were tagged with positive outcome, irrespective of when the lead was sourced.
So, if a lead was sourced 2 years back and was shared again a month back following which sales occurred, the data set on which the model was trained tagged both the outcome as positive. The analyst was not even aware of the mistake he had made. Unknowingly, he had assigned a higher weightage to instances where same lead were shared multiple times and they got converted.
Needless to say, the model was re-built after tagging positive outcome to the recent lead sharing instance and the insight turned out to be false. Imagine the impact this error might have had, in case it went un-noticed. The company would have ended up focusing on leads which had similar or lower chances of conversion!
As in the example above, mistakes made at data preparation stage could be very costly. They will not only result in iterations of the model, but can lead to wrong insights and strategy.
The purpose of this post is to call out various mistakes analysts make during data preparation and how to avoid them.
[stextbox id=”section”]Data preparation process:[/stextbox]
During any kind of analysis (especially so during predictive modeling), data preparation takes the highest amount of time and resources. Practitioners estimate that 50% – 80% of total project time is typically spent in preparing and cleaning data.
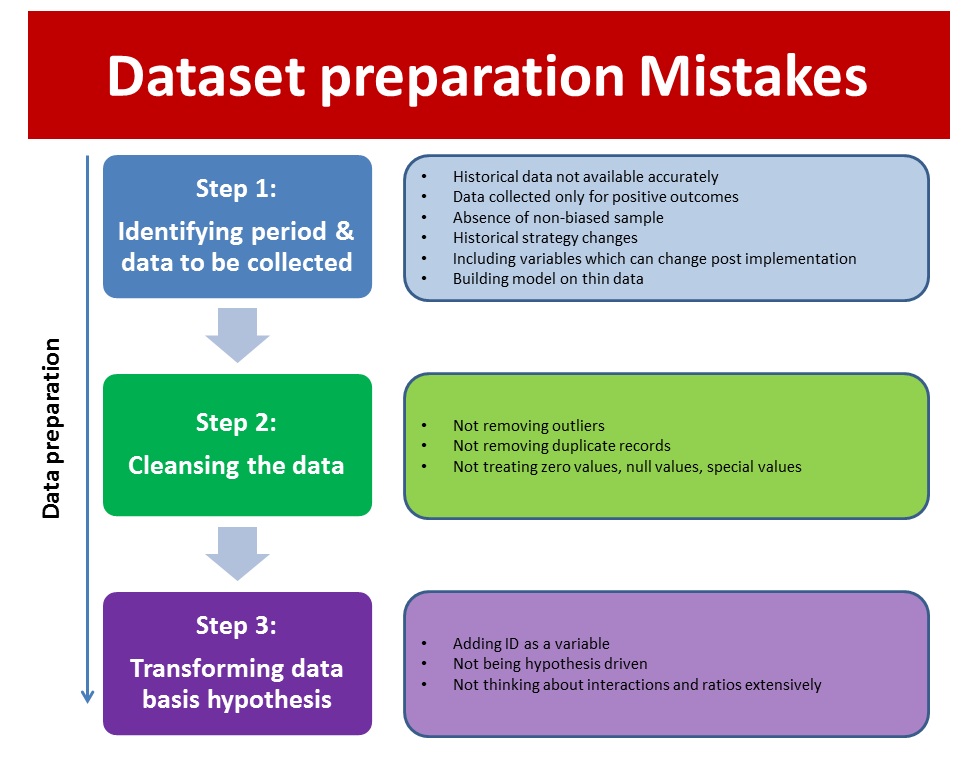
Data preparation process can be divided in three stages:
- Identifying the data set: Identifying the variables and the period on which the data will be trained, tested and validated.
- Cleansing the data set: Once the variable and period is decided, you need to clean the data set for any anamolies it might have. Removing outliers, treating missing values are some of the common operations performed at this stage.
- Adding transformed / calculated variables: Adding more meaningful variables in the modeling process. These could be ratios, calculated and transformed variables. If done correctly, these variables can add tremendous power to your analysis.
While there are multiple kind of errors which might happen during data preparation stage, I am focusing on the key ones to avoid.
[stextbox id=”section”]Mistakes made in identifying the data set:[/stextbox]
- Historical data not available accurately: This is a common system constraint in Organizations where there is no warehousing in place or in case when base systems overwrites data there by erasing historical information.
Since, the analysis is meant to happen on historical data, your variables should look like as they did at the point event happened (and not as of now). For example, if a customer was living in a non-metro city at time of event and has moved to a metro city now, your modeling data set should call out city type as non-metro.
- Data colllected only for positive outcomes: Let us take an example which happens commonly across companies. Let us say you get 100 applications for credit cards and you reject 60. You issue cards to 40 people and only enter the data for these 40 applications into your system. You end up saving space and these variables do not have any impact on existing customers. Makes sense? Probably not. Think what would happen when you want to create a smarter model to screen applications. It will need the variables for all 100 applications in order to create a better model. If you create model with values for 40, each of these will turn out significant!
- Absence of non-biased data set: Ideally, you need a non-biased data set to bring out correct insights. For example, if you are building a model to predict probability of conversion of lead, you are inherently assuming that all leads have been treated similarly, which may or may not be the case. Actual process owners might be working more on a particular type of leads. This error can be mitigated by including some additional variables like number of attempts, but they may or may not exist.
- Including data from a period which is no longer valid: Business strategy, process and system change happen frequently. Some of these changes might make historical data non-usable. These could be changes like removal / addition of fields captured in past, a new segmentation or prioritization in place, Change in website layout impacting customer journey.
If your data is impacted by any of these changes, it is best that you exclude all data points pertaining to past strategy / process or system.
- Variables which can change because of change in customer behaviour: If you are including variables, which are collected from customer, but are not verified, then you need to be careful about creating insights basis these varaibles. If you create a segmentation basis customer self stated income, customers might start under-stating or over-stating income depending on the treatment of these segments.
- Building model on thin data: You need a minimum sample size in order to avoid mixing signal with noise. Looking at confidence intervals and comparing them with differences in various segments can give you a fair idea whether there is enough data or not. For example, Segment A has a response rate of 10% +/- 2% and segment B has response of 12 +/- 1%, there might be a fair overlap in these segments indicating that either you need to try different segmentation or you need more data points.
[stextbox id=”section”]Mistakes made in cleansing the data set:[/stextbox]
- Not removing outliers: Outliers can skew inferences very significantly. If there is no reason to believe that a particular event leading to outlier will happen again, it should be left out of your data set. While some modeling techniques are better at handling skew from outliers (e.g. decision tree), most of the techniques can not. Further, models are meant to work in cases where you have large amount of data points, clearly this will not be the case with outliers.
- Not removing duplicates: If your data set contains duplicate records, they need to be de-duped before you perform any analysis on them. By not doing so, you end up giving extra weightage to instances which occur multiple times. The example mentioned at the start of this article is a special case of this error.
- Not treating zero, null and special values carefully: Treating these values carefully can create a huge difference to your model. For example, excel assigns missing values by 0 (which is 01/01/1900) in dates. If you are using this date to calculate time difference, your model is bound to give erroneous results. Some better ways could be to replace these values by mean, median, start of the period, end of the period. Similarly, there could be special values which might have a different connotation in system. Not understanding and accounting for them will lead to errors.
[stextbox id=”section”]Mistakes made in adding transformed / calculated variables to the data set:[/stextbox]
While the mistakes mentioned in the previous sections would end up giving you wrong results, not spending enough time on this step will end up giving sub-optimal results. Some of the common mistakes people make in this step are:
- Adding ID as a variable: At times people use numeric ids as an input in their variables. Every Organization and system has its own way to create ids. Using them blindly in modeling will end up giving wierd results. The only scenario where I think IDs can be used is when they are allocated sequentially and there is no other variable to capture the time when the allocation happened.
- Not being hypothesis driven in creating calculated / transformed variables: You need to create meaningful variables basis business understanding and hypothesis. Just trying out new variables without having a hypothesis in mind will end up consuming a lot of time without giving any meaningful additions.
- Not spending enough time thinking about transformations: Since data cleaning takes a lot of time, analysts are typically exhausted by the time they reach this stage. Hence, they tend to move on without spending enough time thinking about new possible variables. As mentioned, this might end up hurting the quality of your model significantly. One of the best way to mitigate this is to start with a fresh mind. So, if you have finished all the data cleaning, take a break, give a pat on your back and start thinking about transformations / calculated variables from next day. You will see some quality variables coming out if you spend time at this stage.
These were some of the mistakes I have seen people make at data preparation stage. If you can think of any other common mistake, please add them here.
If you like what you just read & want to continue your analytics learning, subscribe to our emails or like our facebook page
Kunal is a post graduate from IIT Bombay in Aerospace Engineering. He has spent more than 10 years in field of Data Science. His work experience ranges from mature markets like UK to a developing market like India. During this period he has lead teams of various sizes and has worked on various tools like SAS, SPSS, Qlikview, R, Python and Matlab.


Really useful information. Even I have seen these mistakes to be committed by many of the Analytics professionals. Thanks for sharing. Regards, Deepak Rai
I think a functional hypothesis has to pass reasonability testing before allowing for numeric analysis. I hate the GIGO expression, but it actually stands the test of time. it does stand to reason that a "multi-touch" lead will close more often than a single-touch lead; but the type of touch, timeframe start-end, and sequence of touches all have to be included in the model. I like the outline and nicely illustrates the ease with which fallacies can be structured from data without context. Nice.
Thanks Eli for adding the point. Completely agreed. If inputs are not controlled for quality, output can't be!
Hello Kunal, Appreciate your good work on Analytics! Could you also please share the Analytical methodology to be used for end-to-end Analytics project management. You may please send the details at my email id, if possible. Looking forward for your prompt response. thanks, Warm Regards, Abhinav
Abhinav, There are various posts on the site, which address your question (example: here or here) For all future posts, please subscribe to the emails and they will be delivered in your mail box directly. Thanks, Kunal
good work Mr. Kunal nice explained