Upcoming trends in data visualization
Recently, we were blessed with a baby girl. Among a lot of other things, one thing which keeps mesmerizing me is the continuous change happening in the new born. In 10 days, she looks very different compared to how she looked when she was born. I am told that she will change further and I should expect changes continuously!

While these changes look apparent to a person looking at the baby after a break (say 5 – 10 days). At times, people taking care of baby day in and day out fail to notice them. On a similar note, analysts working in analytics industry day in and day out fail to notice some of the changes visible to an outsider. Thankfully, the rate of change in analytics industry is months and not days.
The aim of this post is to highlight some of the key changes happening in the way we visualize data and provide some resources to use so that you can start capitalizing on these changes. While visualization itself is a topic which deserves multiple books and blogs, the purpose of this post is to highlight some key changes happening and provide ways to prepare for them. But before we get into these changes, let’s quickly understand what’s driving these changes?
[stextbox id=”section”]Drivers for changes in data visualization:[/stextbox]
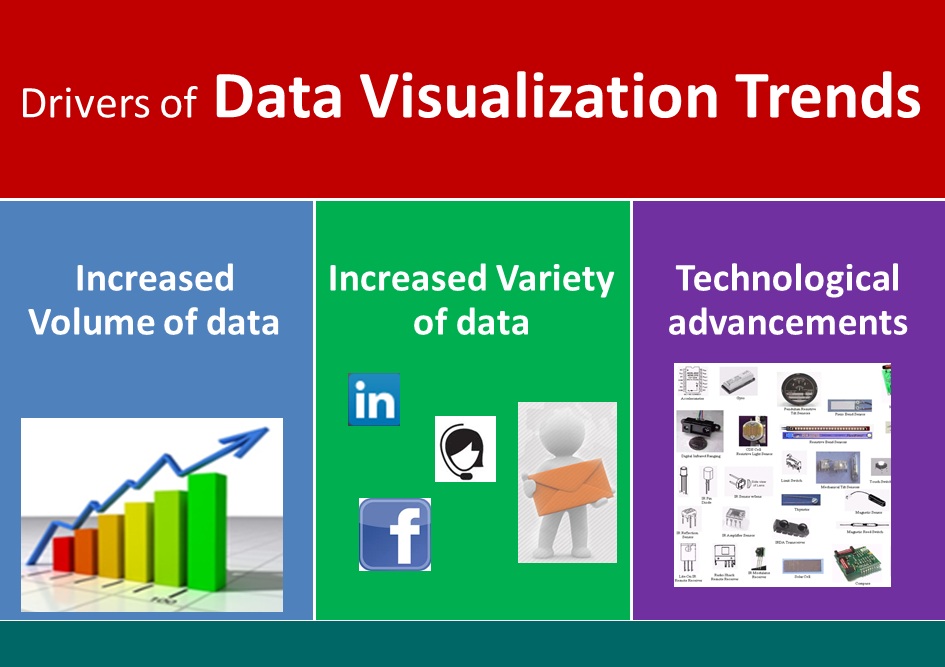
There are 3 key drivers driving changes in visualization:
- Volume of data: With the data to be analyzed becoming larger every second, right visualization has become critical day by day. Gone are the days when you could scroll through the data and get a fair idea about data quality and values. While this might be scary for some analysts, increased data has created opportunities to slice, dice and represent the data in ways, which were not possible for a common analyst in past.
- Variety of data: Along with the increase in volume, there are new kind of datasets which are becoming more and more mainstream. The need to analyze user comments, sentiments, customer calls and various unstructured data has resulted in use of new kind of visualizations. Use of graph databases and visualization to represent unstructured data is an example of how things are changing because of increased variety.
- Technological advancements: Improvement in technology continues to trigger analytics industry in ways never thought of before. There are 2 main ways in which this is impacting visualization:
- Sensor, sensor, everywhere: With cost of sensors coming down significantly and advent of mobile devices, there is huge amount of data available, which was not available before. Smartphones can help geo tag every activity you perform, be it search or clicking photos. These sensors can not only provide your location, but can also reveal great amount of insights in customer behaviour. One of the Motor Insurance company has started giving discounts to people who drive more safely (as measured by sensors in your car / smartphone).
- Increase in computational power: When I was working on my Masters thesis (8 years back), creating an unstructured grid to simulate aerodynamic flow over objects could take days. Today the same computation can be done within minutes. Similarly, visualizations which took hours in past can now be done in matter of seconds. This has enabled creating visualization which might be computationally intense. Creating visualizations to track down chains of social media discussions, their impact on website traffic and eventually customer behaviour was simply unimaginable in past due to lack of computational power.
[stextbox id=”section”]Upcoming trends in visualization:[/stextbox]
- Increased use of geo-spatial visualization and analysis: Showing geographical spread on a map is one of the simplest, yet most effective way of representing information. It can be used in a simple application like looking at website traffic (example of chart below) to more advanced applications like mapping of bank branches and demographics of customers to make sure there is a right fit. Usage of these charts has increased significantly in last couple of years due to availability of better tools and increasing amount of data available with latitude and longitude.

Use of maps (including heat maps) can be achieved through variety of tools and libraries. Some of them are mentioned below:
- Google Maps – Simples form of charts in form of Geo charts
- Qlikview / SAS and a list of other tools through add ins and extensions
- Additional mapping softwares / libraries like Modest Maps, Leaflet, Polymaps, CartoDB, Kartograph, D3.js
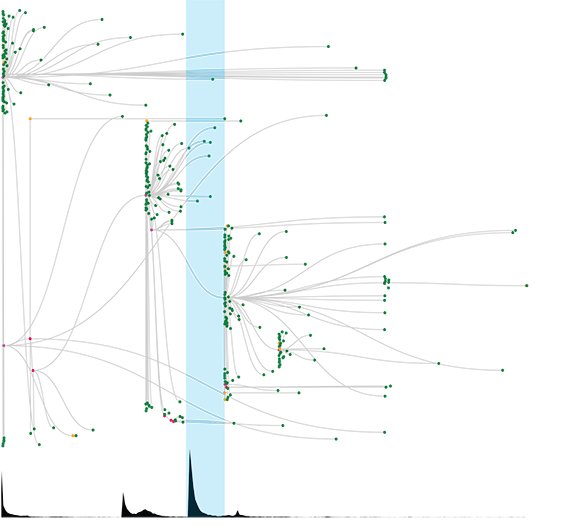
- Graph representations are in: Graph representations can be used to represent a lot of stories intuitively. They represent the way we think about our network. Following is an example of one of the visualization mentioned in HBR blogs. The visualization tells impact of social media discussions on website traffic of New York Times. Tweets and re-tweets are shown as lines and dots, while the click through volume on each article is shown in black below. As the spike happens while no twitter discussions were active, the traffic is likely coming from some other source.
In order to create graphs for some of the visualization, you can use libraries like D3, specialized tools like Gephi, Neo4j, or any of the advanced tool like R, SAS etc.
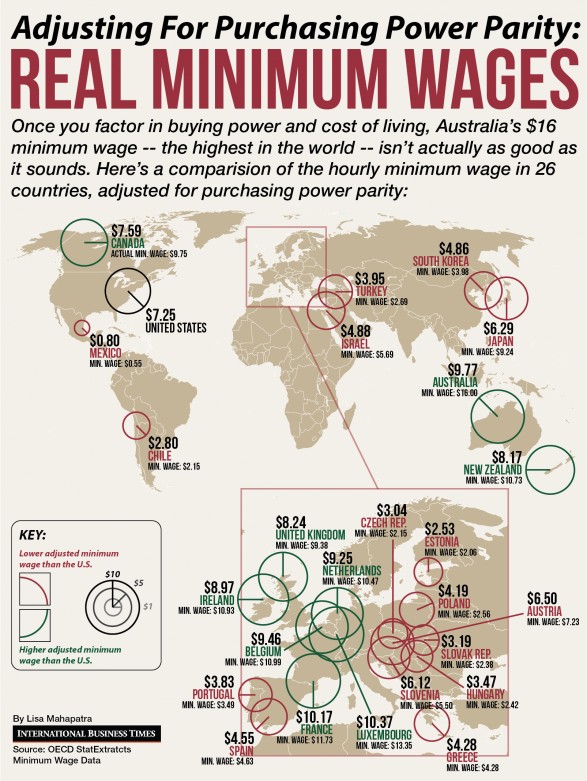
- Use of infographics (specially interactive) for narrating stories: While the complexity of performing advanced analytics has increased many fold, outcomes of these complex analysis are best explained through simple stories. Powerpoint has been a preferred source for this in past. However, that’s changing rapidly. Increasingly, people are using infographics to narrate stories. While I don’t see infographics replacing Powerpoint in near future, they provide an interesting way to narrate an analysis. Following is an example of infographic from ibtimes. There are various tools to create these infographics like visual.ly, ana.gram etc. but I would personally recommend visual.ly because of its ease.
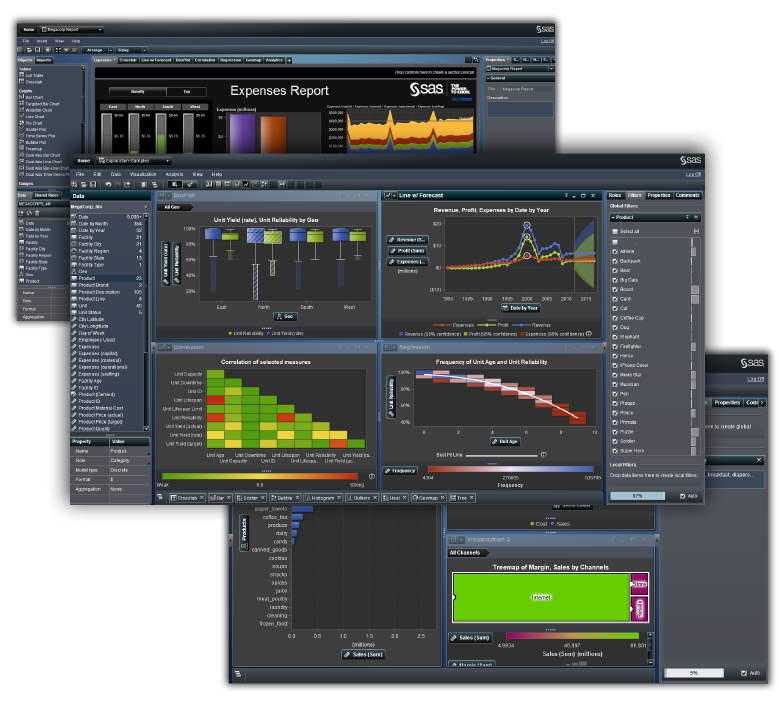
- Increased use of data mashups for exploratory analysis: Data mashups refer to tools which can import and join data on the fly. They don’t rely on the middle layers of an ETL system to import and join data before it can be used. Further, these tools have enhanced visualization capabilities to perform data exploration and discovery before investing time in predictive modelling. A lot of well-known vendors have entered this space as these tools can cut down exploration stage to a fraction of what was required in traditional tools. Some examples of these tools include SAS Visual Analysis, Qlikview etc. The picture below shows a few screenshots of SAS Visual Analytics.
- Use of timeline to show evolution and changes: While there is nothing new in this visualization and it can be created even in a simple spread sheet, its application and usage has increased suddenly. Ability to show interactive visuals with better graphics has increased appeal of timelines significantly. Following is an example of visualization through time line.
In order to create timeline, you can use tools which create infographics or specialist tool like Timeline.
- Creating visualization with mobile devices in mind: With increase in smartphones and smart devices, a lot of customers view these visualizations on the go. Further, penetration of mobile devices is going to increase further. So, whenever you make a new dashboard / visualization, just think how will it look on various mobiles and tablets? There are various tools, which have capability to create apps or dashboards customized for mobile devices (e.g. SAS Visual Analytics, Qlikview etc.)
I hope this article gives you a good start to utilize some of these upcoming visualizations. If you are aware of any other trends or tools / libraries to create these visualizations, please add them in comments.below.
If you like what you just read & want to continue your analytics learning, subscribe to our emails or like our facebook page.
Kunal is a post graduate from IIT Bombay in Aerospace Engineering. He has spent more than 10 years in field of Data Science. His work experience ranges from mature markets like UK to a developing market like India. During this period he has lead teams of various sizes and has worked on various tools like SAS, SPSS, Qlikview, R, Python and Matlab.


Nice article...
Discuss visualization without citing Tableau is, at least, very strange.
Good point Mr. Jones! Tableau is a great tool! Unfortunately, I have used it to very little extent. The main focus of the post was to bring out trends in visualization (irrespective of tool). At places, where I was aware of capabilities of the tools, I have mentioned them. I have not used Tableau for these applications and hence did not mention it. If you know how Tableau can help people with these trends, please feel free to add them here. If they are relevant, I'll post it as an addendum to the post. Thanks, Kunal