Customized Reporting in Qlikview
As a BI professional, I am used to receiving ad-hoc reporting requirements from business users which need a fast turn-around (sometimes under the name of ‘Analysis’). What is interesting is that 95% of these requirements can be delivered by re-arranging, cross-joining, summarizing or expanding some or the other existing reports.
So, if we merge all ad-hoc and regular reports, it will become a master report with multiple metrics and multiple dimensions, which can be summarized using following expression:
Multiple Metrics (KPI) X Multiple Dimensions = Multiple Reports
This is how I deal with the ad-hoc requirements. Excel provides ‘Pivot tables’ to enable creation of this kind of a master repository, where people can select dimension and metric from the available set of fields.
So, when I started using Qlikview two years back, I was looking for a similar solution i.e. multiple reports where the user has a feature to select or deselect dimension and metrics as per their requirements i.e. customized reporting. Thankfully, Qlikview 11 has a feature called “Conditional enabling of Expression and Dimension”.
Depending on the user, you can show or hide certain dimensions or metrics. If you would like end users to create their own tables / reports, you may use this feature to dynamically add/remove dimensions or metrics.
[stextbox id = “section”] How to create Customized reports in Qlikview ? [/stextbox]
Step 1:
Identify the entire set of dimension and metric that you want or can think of being used by end users. It is very critical that you bring in all dimensions and metrics, otherwise the purpose of this report gets lost.
Create separate INLINE table for dimensions and metric. I would recommend two columns in each table, one for the descriptor and one to uniquely identify it by a single letter (A-Z)/ Number.
Example:
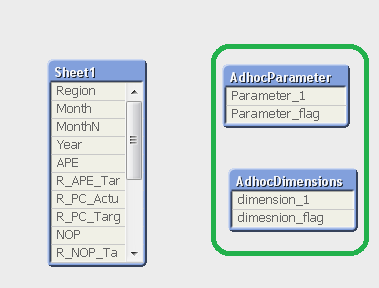
AdhocDimensions:
 LOAD * INLINE [dimension_1,dimesnion_flag
 Region,1
 Coutry,2
 State,3
 City,4
 Year,5
 Quarter,6
 Month,7
 Branch Segment,8
 Product,9
 Product Group,10
 Sales Channel,11
 Sales Manager,12
 Sales Manager Designation,13
 Financial Advisor,14,
 Finanacial Advisor Vintage Group,15
 ];
AdhocParameter:
 LOAD * INLINE [Parameter_1, Parameter_flag
 Sales, A
 Renewal Collection,B
 Poliices, C
 Manpower,D
 Profit,E
];
This table will not be associated to any other tables in your model.
Step 2:
Move to layout TAB, create a list box and select field “dimension_1” that was declared in INLINE table. Preferably select list box with LED check Box style so that selection / deselection of multiple dimensions can happen easily.
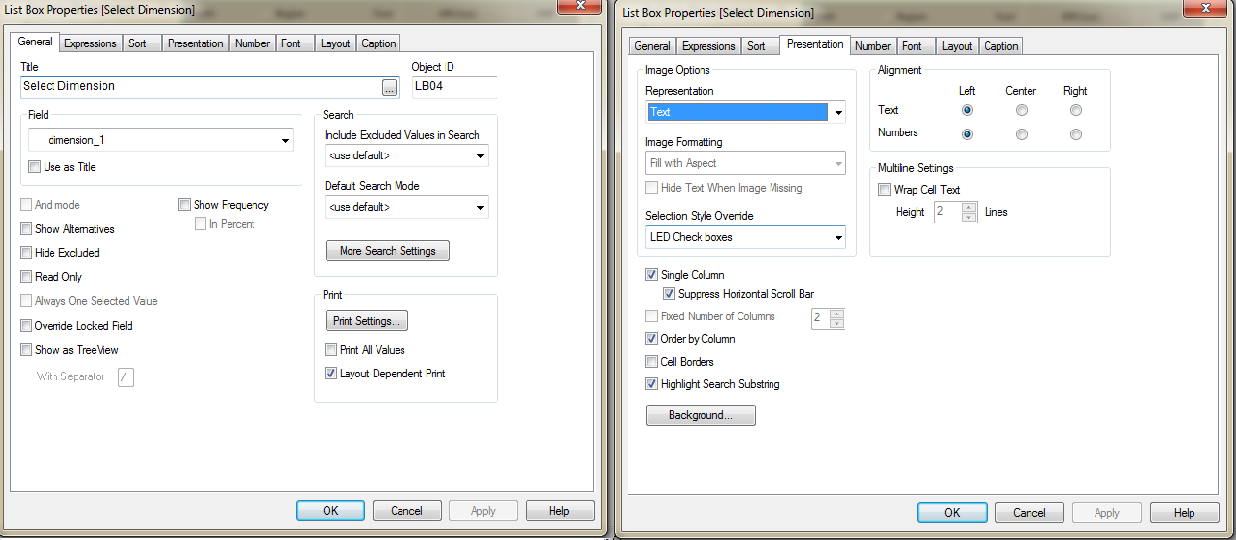
Create similar list box for metric also.
Step 3:
Create object (Pivot Table/ Straight Table/ Chart …) that user will customize basis their selected dimension and expression. I am illustrating example of straight table.
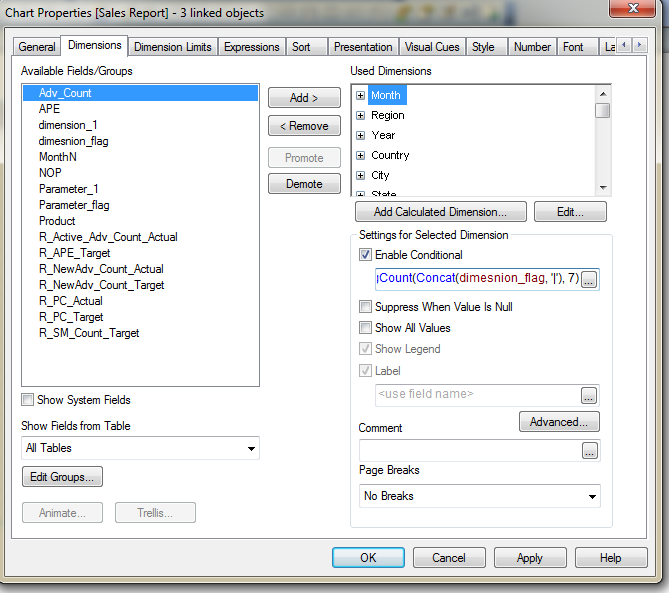
Select all dimensions available in table “AdhocDimensions” (dimension inline table) and write a conditional expression for each dimension which results in the reporting. In the dimension properties, check the option for “Enable Conditional” and enter the following code for dimension “Month”: Dimension Month has defined value 7 in inline table under “dimension_flag” field.
=SubStringCount(Concat(dimension_flag, '|'), 7)
Add similar code to each dimension, changing the corresponding numbers you used in your inline table.
Step 4:
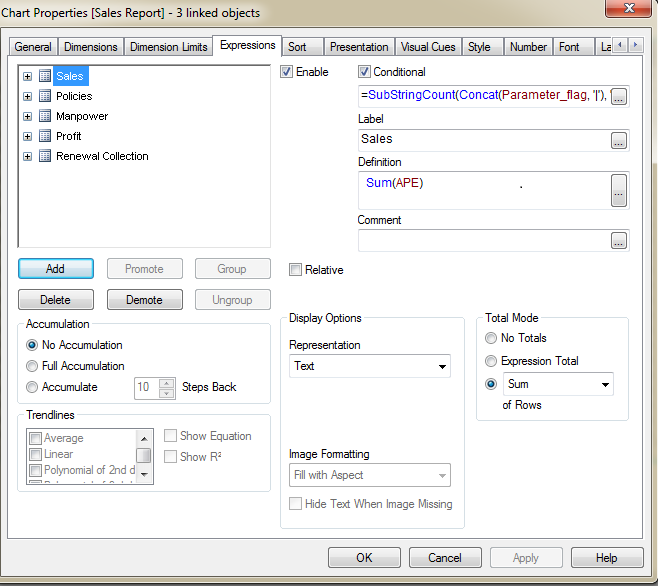
Write expression for all metrics and enable conditional expressions by checking the option for “Enable” and writing conditional code for each expression
=SubStringCount(Concat(Parameter_flag, '|'), 'A')
Step 5:
Add a condition in general tab of the straight table so that the object only displays when at least one dimension and expression is selected:
=GetSelectedCount(dimension_1) > 0AND GetSelectedCount(Parameter_1)>0
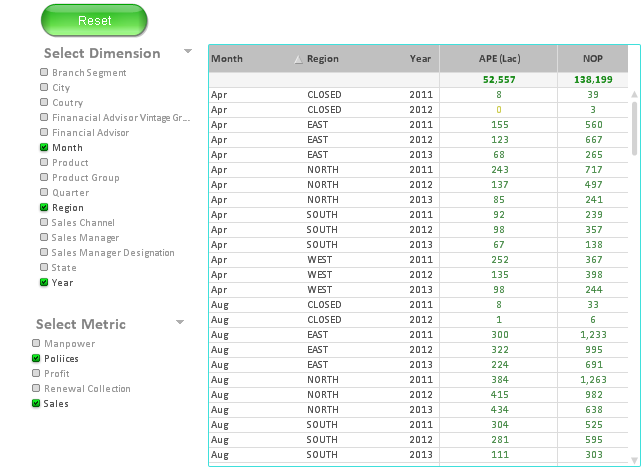
Finally, we have customized reporting for end-user:
This is an example where we have brought out methods to create Customize reporting in Qlikview. What do you think about this methodology? Have you used to similar kind of practice? If yes, how did you create them? Do you think this tip was useful?
Do let me know your thoughts on using this feature in Qlikview.
If you like what you just read & want to continue your analytics learning, subscribe to our emails or like our facebook page.
I am a Business Analytics and Intelligence professional with deep experience in the Indian Insurance industry. I have worked for various multi-national Insurance companies in last 7 years.


Hi Sunil, Can we use Qlikview as a replacement for MS-EXCEL, as everything is custom made in it like dashboards, pivot tables etc, Does the files saved in it, in the form of Qlikview format or any other format.? Thank you, Nimit Gupta
Yes, you can replace Excel with QlikView for your reporting needs.
Hi, This is very helpful. Thankyou. I have developed a custom report in Qlikview, but how do you save it so that i can use it later by selecting from the select reports tool bar. Appreciate your help, Prasoona.
Hi I tried your solution but it does not work for me. Instead of showing whats selected under dimension and expression it shows everything all the time. Do you have any idea what i could be doing wrong.
You are awesome. This is really wonderful and very useful.
This is great! I had it up and running within minutes with no trouble. One quick question - my database has "non-friendly" names which I need to leave as-is in the script Is there a way to give the dimensions more readable names once I've set this up? I.e., I might have XYS_Sales_USD listed in the script but I would want it to show as just "Sales" in the list box.
Hi Barbara. You can use the "label field" for dimensions and metrics. At the Dimension or Expression Tab just select one of them that is being used for your chart and in the label field enter the name desired. Instead of show "XYS_Sales_USD" as name field in the list box it will show "Sales" as name of field.
hi i have tried your example its not working for me.When i am picking dimensiions for stariaght table i couldn't find any dimensions .it's only showing %Dimension flag and dimension_1.How to overcoem
Very well explained, thank you.
The problem arises when you have more than 10 dimensions, If you have selected the 15th dimension it'll show the 1st, 5th and 15th all together instead of just showing the 15th as all of them satisfy the condition. Any workaround? I want to stick to the 'dim_flag' and not use dimension names..
Estaba buscando esa informacion hace duración, te lo agradezco, estoy de convenio con tu punto de vista y pienso igual. Despues de buscar mucho por Internet encontre lo que buscaba. Genial!!! muchas muchas gracias