Set Analysis in QlikView – simplified!
One of the best practices I follow while preparing any report / dashboard is to provide a lot of context. This typically makes a dashboard lot more meaningful and action oriented. For example, if you just provide number of units sold by a product line in a month, it is good information, but it is not-actionable. If you add comparison against same month last year, last month or average of relevant product lines in this month, you have added context to the number. The business user can take more meaningful actions out of this report / dashboard.
QlikView has feature called SET ANALYSIS that provides us a way to add this context. Set analysis predefines the SET OF DATA that our charts / tables use. So, using a Set Expression, we can tell our object (chart / table) to display values corresponding to various sets of data (e.g. a pre-defined time-period, geographic region, product lines etc.). All of the examples, I mentioned above as part of adding context can be accomplished using Set Analysis in Qlikview.

Most of the QlikView Professionals think that SET ANALYSIS is a complex feature. Through this post, I am trying to change their conviction towards it.
[stextbox id = “section”] What is SET ANALYSIS ? [/stextbox]
Set Analysis can be understood by a simple analogy of how Qlikview works. We make selections on certain variables and the changes reflect in the entire application. This happens because through our selection, we have created a set of data which we want to use. In a similar fashion, using Set Analysis feature, we can pre-define the data to be displayed in our charts.
Some features and characteristics for Set analysis are:
- It is used to create different selection compared to the current application selections
- Must be used in aggregation function (Sum, Count….).
- Expression always begins and ends with curly brackets { }
[stextbox id = “section”] Example dataset:[/stextbox]
[stextbox id = “section”] SET ANALYSIS syntax broken down into three components: [/stextbox]
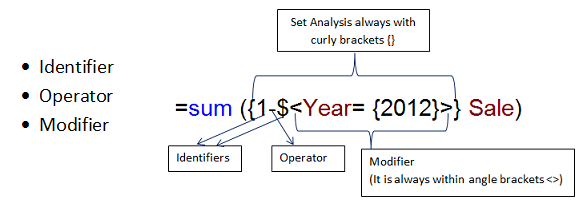
[stextbox id = “section”] Identifiers: [/stextbox]
|
Identifier |
Description |
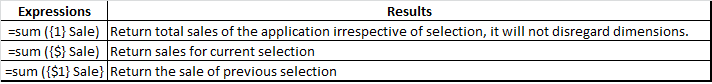
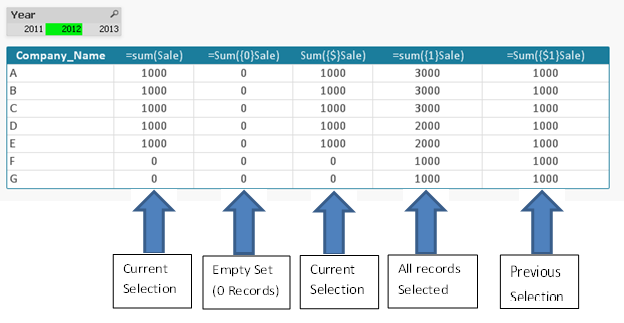
| 0 | :Represents an empty set, no records |
| 1 | :Represents the set of all the records in the application |
| $ | :Represents the records of the current selection |
| $1 | :Represents the previous selection |
| Bookrmark01 | :Represents the set of all records against bookmark ID or the bookmark name |
Examples:–
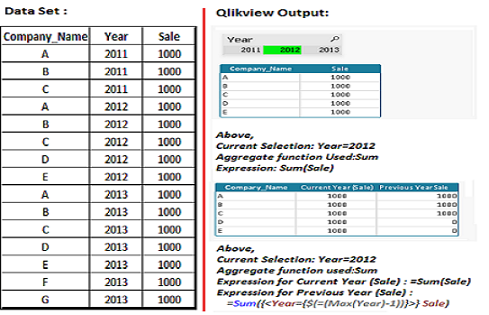
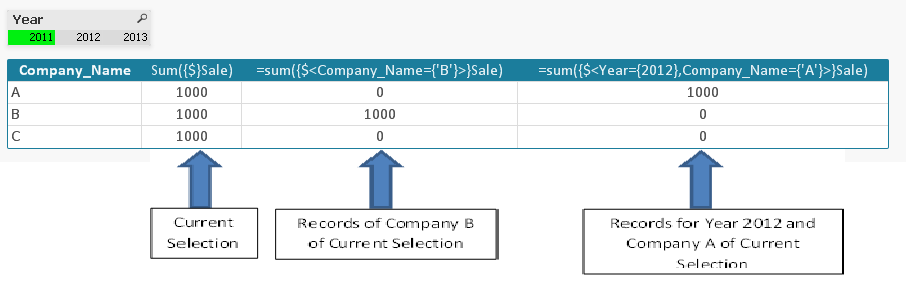
In below example, Current year selection is 2012 and previous selection was 2013.
[stextbox id = “section”] Operators : [/stextbox]
- It works on set identifiers
|
Operator |
Operator Name |
Description |
| + | Union | Returns a set of records that belongs to union of sets. |
| – | Exclusion | Returns records that belong to the first but not the second |
| * | Intersection | Returns records that belong to both of the set identifiers. |
| / | Symmetric Difference | Returns a set that belongs to either, but not both of the set identifiers. |
Examples:–

In below example, I have created a bookmark “BOOKMARK_1” for company selection A, B and C.
[stextbox id = “section”] Modifiers: [/stextbox]
- Modifiers are always in angle brackets <>.
- It consists multiple fields and all fields have selection criteria.
- Condition of fields within modifiers bypass the current selection criteria.
[stextbox id = “section”] Dollar Sign Expansion: [/stextbox]
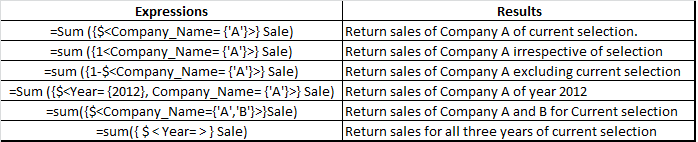
If we want to compare current year sale with previous year, previous year sales should reflect values in relation to current selection of year. For example if current selection of year is 2012, previous year should be 2011 and for current selection of year 2013, previous year is 2012.
“=Sum ({$<Year = {$ (=Max (Year)-1)} >} Sale) “
Above expression always returns sale for previous year. Here $ sign (Font color red) is used to evaluate the value for previous year. $ sign is used to evaluate expression and to use variables in set modifiers. If we have variable that holds last year value (vLASTYEAR) then expression can be written as:
“=Sum ({$vLASTYEAR)} >} Sale) “

[stextbox id = "section"]  Indirect SET ANALYSIS: Function P() and E() [/stextbox]
Let us take a scenario, where we want to show current sales of the companies who had sales last year.
Expression should be similar like:
=sum({$<Year={$(=Max(Year))},Company_Name={Companies who had sales last year}> } Sale)
First we have to identify companies who had sales last year. To fix this problem, we will use function P() that is used to identify values within a field and function E() that exclude values within a field.
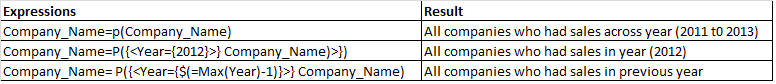
Finally, we have expression:
=sum({<Year={$(=Max(Year))},Company_Name=P({<Year={$(=Max(Year)-1)}>}Company_Name)>}Sale)
This post was an example where we have brought out methods to use SET ANALYSIS in Qlikview. Have you used this feature before? If yes, did you find it useful? Do you have more nifty tricks to make Set Analysis more interesting? If not, do you think this article will enable you to use Set Analysis in your next dashboard?
Do let me know your thoughts on using this feature in QlikView.
If you like what you just read & want to continue your analytics learning, subscribe to our emails or like our facebook page.
I am a Business Analytics and Intelligence professional with deep experience in the Indian Insurance industry. I have worked for various multi-national Insurance companies in last 7 years.


This is actually a very nice example of how to use Set Analysis. It's very simple and straight forward with some simple and easy to understand examples.
Thanks Steen. Stay tuned for some more posts on related topics. Regards, Sunil
great post... this examples could be helpful too… http://qlikviewapuntes.blogspot.com.ar/search/label/Set%20Analysis regards
nice post, Sunil, and great overview of set analysis features. it gets then more interesting with aggr function and nested scopes ;)
Thanks Borys. Stay tuned for some upcoming posts for interesting discussions! Regards, Sunil
i am a beginner in qlikview and this blog help me understand set analysis, thank to you bro, very good explanation....
i am a beginner in qlikview and this blog help me understand set analysis, thank to you bro, very good explanation.... keep it up godbless you
Thanks Webster Sacluti. We have various articles on our site, which you might find useful. Also, if you like the articles, please subscribe to our emails and you will get the summary of articles delivered in your mailbox. Regards, Kunal
yes sure can i get your email? so i can subscribe to it.... i want to get the summary of articles delivered in my mailbox... thanks and godbless
You can use the box provided on top right hand corner of the page. Alternately, you can click here.
Thanks for such a wonderful article. I have doubt wherein can a field be used more than once in the Set Analysis as a Modifier: =Sum({}Field2)
in the "Dollar Sign Expansion" section I think you have an error you write “=Sum ({$vLASTYEAR)} >} Sale) “, you didn't close thebraket By the way you made a very good tutorial very clear.
clear information on Set Analysis and have shown how easy it can be achieved!!
Hi, This was a great article, thanks. Could you please help me out with why this would give me a cumulative result: Count(DISTINCT{$<CCMonthID = {"<=$(=Max(CCMonthID))"},CCYear=,CCQuarter =,CCMonth = , [CustomerID]=P({ + $(=Max(CCMonthID))"}>}),[ CustomerID]=E({ * }) >}[ CustomerID]) But literally, by just removing the exclude will only give me month by month figures? Count(DISTINCT{$<CCMonthID = {"<=$(=Max(CCMonthID))"},CCYear=,CCQuarter =,CCMonth = , [CustomerID]=P({ + $(=Max(CCMonthID>}[ CustomerID]) Youre help would really be appreciated.
In QV publisher after having successful reloads i need the QVW files that are not reloaded which are scheduled reloads after particular period of time i.e current day at 9 am
i am a beginner in qlikview and this blog help me understand set analysis, Thank you..
Hi Sunil, I would like to know how you Managed to split up one column (The Sale column) into two column called Current Year Sale and Last Year Sale. Your help would be greatly appreciated. Regards Thanda
Hi, Thanks for the article; though I'm new with and looking to learn Qlikview on my own; please share (email- [email protected] ) useful link/resource for learning Qlikview at a beginner level if anyone is aware ... Thanks in advance,
Hi Sir, The Article is very help full.Am New in QlikView and try to learn and devlpp the thing on my own .please share tghe links and useful Article/resource to my (Mail ID: [email protected])
Hello All, I have Trans Number,Amt of Articles,Category i want build stacked bar chart for this to get % of amount of articles(% has to split into two again i,e Amt of articles contain valuea1,2,3,4,5 etc....here 1 represents "Single" more than 1 represents Multi.Each category having multiple transactions in that Single and Multi Is there.Now i want to show that No of single articles and No of multi articles in stacked bar chart.(Let us assume that (100 % in that 25 is single,75 is multi.)this has to represent in Stacked Bar Chart Can anyone pls help on this.its urgent requirement.
Thanks for sharing this useful tutorial on set analysis
Great article, thanks a lot! It's really a powerful feature. p.s.: please remove not required brackets/correct formulas in the article: 1) “=Sum ({$vLASTYEAR)} >} Sale) “ 2) in part Indirect SET ANALYSIS: Function P() and E() - on the screenshot with expressions Thank you!