Forum mining challenge – Get the right questions!
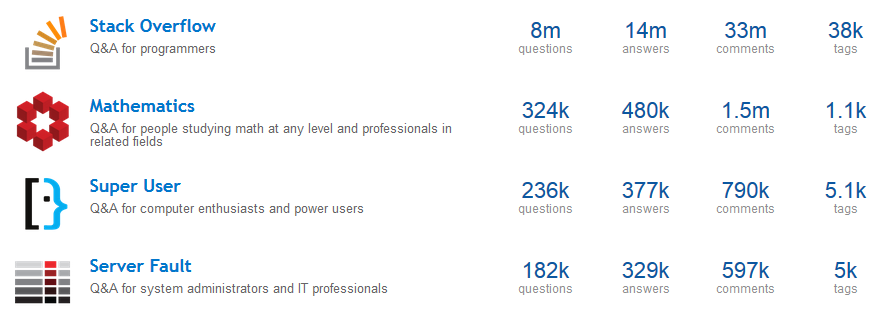
Analytics community is relatively small but very vocal on the web world. We subscribe to various Linkedin groups, Facebook groups and other websites to be aware of all that is going on in the industry. For instance, Stack overflow has more than 8 million questions asked till date. (Source: http://data.stackexchange.com/) .

The problem statement we are going to provide in this article is a good combination of data extraction and unsupervised modeling algorithms and will not only make you understand how to fetch data from forum websites but also make you understand what is the analytics industry wondering about.
Background
Analytics Vidhya was built with a vision of creating a strong analytics community ready to share knowledge and best practices. With such aspirations, Kunal and Tavish wish to answer questions on which people in the industry are either confused or need guidance. Now, answering more than a million questions posted till date on stack overflow is next to impossible.
It’s your turn to help Analytics Vidhya recognize the popular topics of discussions & have oodles of fun during the process.
Problem statement
Find the most popular forum questions (related to data-science) across stack overflow network. Now, as mentioned – this can be huge! So, here are some guidelines to identify relevant questions for your task:
- Questions posted with various data related tags (e.g. data-mining, data.frame, data-science etc.) across the network
- Questions on site dedicated to data science (e.g. datascience.stackexchange.com or stats.stackexchange.com)
Please note that these are guidelines and not a definition to use. Like all open problems, there might be pockets, these guidelines are missing.
Also, in order to keep the analysis relevant, you should include questions posted after Jan 2012.
What Data you need to use for categorization?
All the questions posted after 1st January 2012 (included) on stack overflow network can be used to train the model. You can use all the fields which can be obtained directly from the API of stack overflow. This can include topic of discussion, number of views, date of publish, author of the question etc.
Help : Text Mining tools on R and Clustering algorithms will come very handy to build the solution.
What is the evaluation metric?
The total popularity (views) of the top fifty questions found will be used as the evaluation metric. For instance, if the first question category found is “merging tables in SAS” and the number of views for the following questions are:
“How to merge two tables in SAS?” : 50
“Joining tables in SAS?” : 100
” Problem while finding linked rows between 2 datasets in SAS” : 200
The total number of views counted for the first question category is the total of all the linked questions (i.e. 350 in this case).
Submission Format :
We expect following three parts for the submission :
1. Codes built to do this analysis
2. Top 50 question category found
3. Mapping file, which should include all the linked questions to the question categories. We will do a search on these questions to calculate the total number of views. Note that all the questions put in the same category should have the same answer.
All submissions should reach us latest by 15th October 2014 on [email protected]
End Notes:
- The aim of this challenge is to foster analytical thinking in our reader’s mind and have some fun with practical machine learning / analytics challenges!
- We will give the winner of this challenge a chance to blog about his solution on Analytics Vidhya. Of course, he takes away all the visibility, which comes on the platform!
- Last but not the least, the entire story presented before is hypothetical. It was created with the sole aim to create this challenge.
If you like what you just read & want to continue your analytics learning, subscribe to our emails, follow us on twitter or like our facebook page.
Kunal is a post graduate from IIT Bombay in Aerospace Engineering. He has spent more than 10 years in field of Data Science. His work experience ranges from mature markets like UK to a developing market like India. During this period he has lead teams of various sizes and has worked on various tools like SAS, SPSS, Qlikview, R, Python and Matlab.


how to extract the data using api if u have the material in above said point please share with me