Tips to prepare an outstanding CV for data science roles
Here is a CV I received for a position of “Research scientist” some time back:
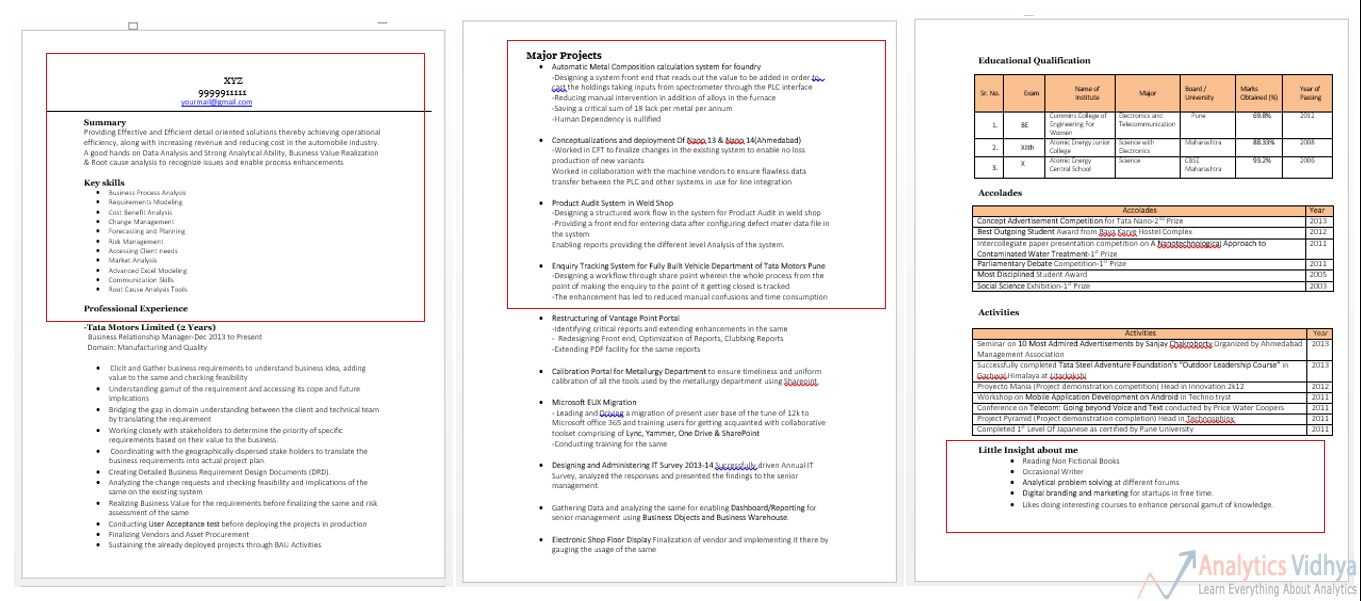
Sadly, the person who applied for the CV had very little chance of getting the position. I am not saying this after looking at the skillset of the person. Instead, I am instead telling this by just glancing through the person’s CV. The first half a page on CV doesn’t tell its reader anything about the person or his / her skillset. No wonder, this was a 3 page CV for a person with 2 years of experience!
Here is another instance – a cover email which led to rejection of the candidate even before his CV was opened.
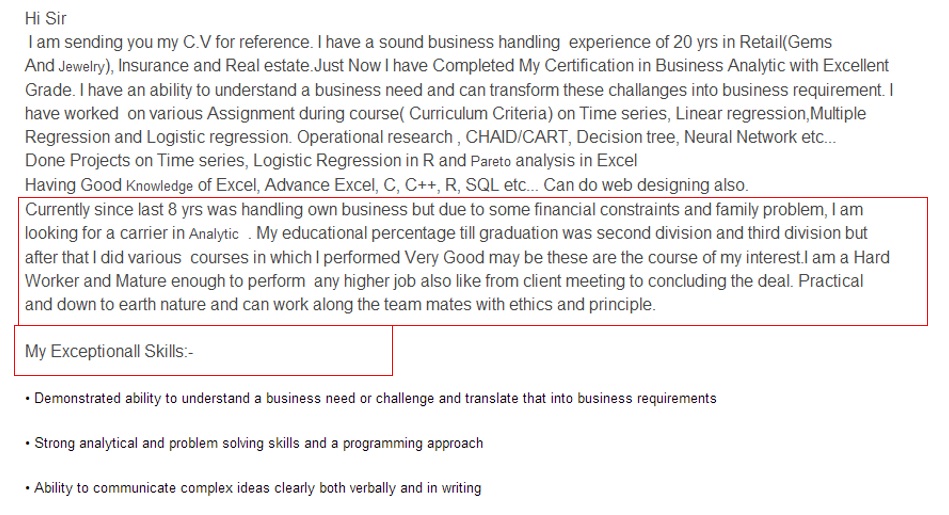
His “Exceptionall” skills were clearly at work here! Spelling errors, grammatical mistakes, poor typesetting, illogical sentences – you name a mistake and this email would likely have it!
Here is a tip which can save you from a lot of trouble:
A good CV might not be sufficient to get you selected,
But, a bad CV can be sufficient to get you rejected!
This article aims to provide you with some thoughts to make your CV stand out from the stack of CVs for any data science role.
Step 1: Get the basics right
Here are a few tips to get the basics in place. I am just listing the tips here as most of you would know these or can find better guidance on basics on the web.
- Make sure the CV has no errors – either typos or grammatical. This is something which leads to a straight rejection.
- The length of your CV should be ideally one page or a maximum of two pages. Any thing more than that is likely to be skimmed through, rather than being read.
- Make sure that every point you are mentioning in your CV is crisp and clear. Avoid using long, complex, technical statements.
- Attach clear (business) benefit attached to each and every project you mention or call out why the project you are mentioning stands out.
- The purpose of the CV is to showcase your work from past. Hence, you should emphasize on what you have done and not what you can do.
- Highlight skills relevant to the role (more on this later)
- Take review from a few experts in the industry. This is the acid test to check whether your CV is still up to the mark or not.
Step 2: Tailor your CV
Once a basic version of your CV is ready, you can start thinking “How to can tailor your CV depending on the role you are applying for?” Emphasize and highlight projects which showcase the skills required in the role you are applying for. There are broadly two classes of roles available in analytics industry currently:

- Technical data science roles: These roles require you to spend time working on / leading data science projects. You need to slice and dice data to come out with insights for your customers / stakeholders. If you are applying to these roles, here are a few tips:
- Focus on showcasing few key projects: Identify a select group of project (5 – 10) and focus on mentioning them only. Highlight the key benefits or uniqueness of each of these projects.
- Illustrate depth of knowledge: There roles require you to possess deep knowledge on a topic.
- Showcase technical skills: You should mention the types of tools you have worked on and your expertise with them.
- Get (meaningful) certifications and add them to your profile – Lookout for courses running on platforms like Coursera, Udacity, edX and complete them along with their assignments.
- Create a GitHub profile and share your work from past – Share whatever work you can share on GitHub (e.g. projects done while doing courses on Coursera, edX etc.), codes from Kaggle competitions, tutorials and blogs you have written in past
- Non-technical data science roles: I refer to the roles, which are either client facing or related to sales of analytics solutions here. If you are applying for jobs like these, you don’t necessarily need to showcase your expertise on a language. What you need to showcase are the skills which are critical to that role. For example, a client facing analytics consultant would need to be very good at structured thinking. A pre-sales person would need skills to influence people basis data based stories. Here are a few tips to make your CV stand out for these roles:
- Focus on breadth of knowledge rather than depth: These roles typically require you to know the entire spectrum of data science fields, so that you can understand the client requirement well and advice accordingly. So, you should focus on showing the breadth of knowledge rather than depth.
- Emphasize the business impact from your previous engagements: This could be the biggest sales you made, the number of clients you consulted or any metric, which directly impact the top line (or bottom line in some rare cases).
- If you have written blogs / views on the subject, you should include them in your CV.
Step 3: Stepping up the game
By now, you should have a basic CV ready and you would have emphasized the right skills for the role. Next, I would mention a few examples and techniques to take your CV to the next level. Consider these examples as High risk, High return strategies. You should not attempt them until your basic CV is ready.
If you do these things well, you can get a very high return. However, if you do a bad job in executing these things well, these things can backfire. The main purpose of these techniques is to distinguish your CV against the bunch of CVs, which employers get for good positions.
Example 1: Create an Infographic about yourself
Here is a good example of an infographic designed by a graphic designer. He has highlighted his skills and knowledge of tools.

Source: Ryan Eccleston (Behance)
Why does an infographic like this work? This works because creating this shows that you can take a lot of data and represent that in a nice and effective manner – a skill every data scientist or manager needs to possess.
Example 2: Creating a dashboard / story in the tool of your choice
Consider your CV as your real estate for showcasing yourself in a limited space – something similar to what you need to do in business dashboards. So, if you can create an interactive dashboard about yourself (with drill downs), you can again drive your CV home. Here are a CV from Dmitry Gudkov, which was available on the internet:
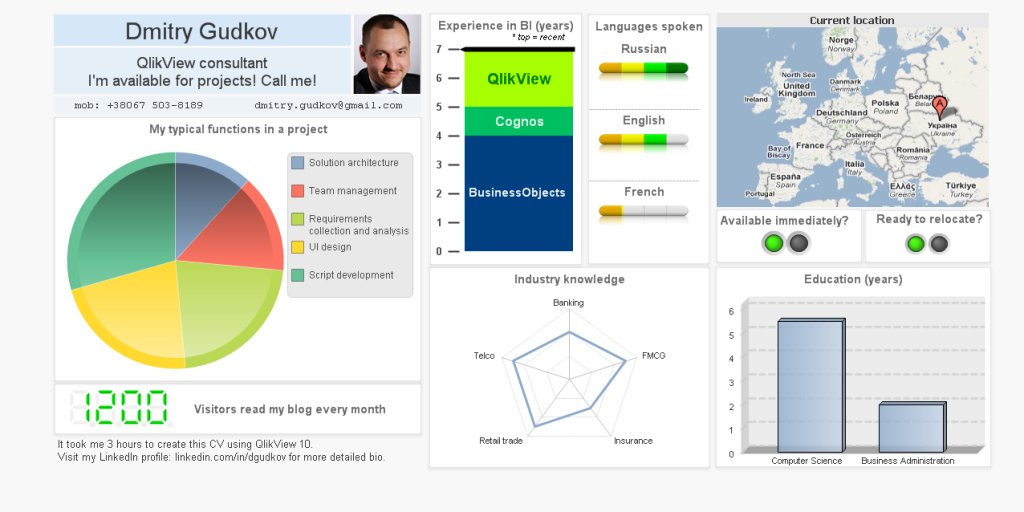
You can also use story-telling features from QlikSense or Tableau. This not only shows that you can visualize data effectively, but also that you know about the latest features in some of the tools.
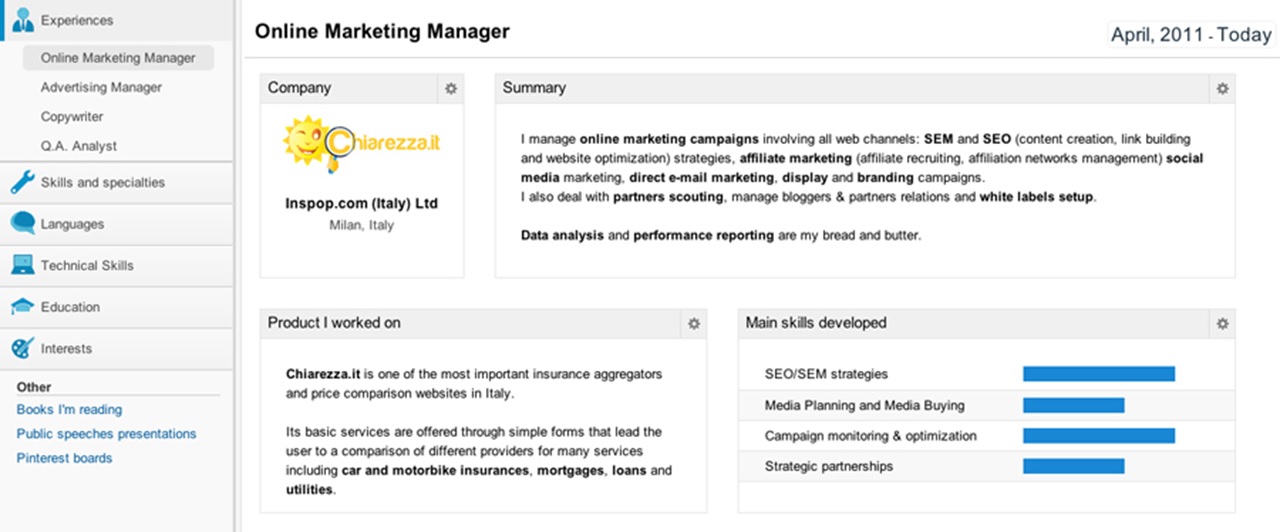
Here is another example of a CV, which an applicant created while applying for a Digital marketing manager. Google Analytics is the most commonly used tool for digital marketing. So, he created his CV in form of a dashboard, which resembles Google Analytics dashboard closely.
With these examples, you would now understand what I mean by high risk, high return strategy. If you do pursue to create something like this, you will need to spend a lot of time thinking what information should come on CV and what should go off. However, that is time well spent.
After all, if you do create a nice visualization about yourself, it will definitely set you apart from the league.
End Notes:
What do you think of these tips? Have you used them to differentiate your CV. I am trying to develop a Python script, which scraps my professional profile over the internet, mines the data and then summarizes the data in a page. Do you have any other idea which can make you stand out? Please feel free to share your thoughts through comments below.
If you like what you just read & want to continue your analytics learning, subscribe to our emails, follow us on twitter or like our facebook page.
Kunal is a post graduate from IIT Bombay in Aerospace Engineering. He has spent more than 10 years in field of Data Science. His work experience ranges from mature markets like UK to a developing market like India. During this period he has lead teams of various sizes and has worked on various tools like SAS, SPSS, Qlikview, R, Python and Matlab.


Hi Kunal, Its a really long time and I am writing again!!! I am currently looking out for jobs in the analytics space and this article is almost godsent. But back to serious topics, I have a couple of questions: - I know Qlikview and making a CV in Qlikview is a very good idea. But is it really applicable in today's environment, in India especially. Not saying that India is bad or anything, but I still see a majority of people who prefer the traditional Adobe or Word CV. Common reason is that most recruiters at least will not have a Qlikview at their fingertips. - Next one is just a question. I loved the digital marketing manager CV. But how was it made? Is it a webpage? Thanks Kunal...
Hi Jayana, Good to hear from you after long! Your article is still due :) 1. I think that if your potential manager does not appreciate the fact that you have created something like this to illustrate your Visualization skills – you should question whether you want to join such a manager / company. If job portals are causing this problem, then have 2 versions of your CV, a traditional one to put on portals and a visual one for social media and to carry for interviews. 2. Yes, it was a webpage Regards, Kunal
It's an awesome representation of what we know and what we can do
Hi Kunal,
Does it really make a difference whether one does the regular or the paid versions (certificate) of some of these courses? And would it help to attach "certificates of accomplishment" or provide links thereof in the CV?The difference between Coursera's "Signature track certificates" and "Statements of Accomplishment" is that the first ones provide authentication of the person who made the course and the later ones no. However, statements of accomplishment still have some value on my view and they can also be seen on your linkedIn profile. It is also important to realize that Cousera's certificaes are 2nd on the top 100 list of certifications providers of LinkedIn, which might give you more visibility. See this link: http://addtoprofile.linkedin.com/cert/ranking?trk=li_corpblog_corp_danshapero_showcaseprofessionalcertification
Kunal Jain you are Awesome in simplifying and articulating the way which really needs to be emphasized on current trends. KEEP IT UP!!!
Hi Kunal, Great tips on writing a CV!!! This is the first time I have seen people using Infographics,Qlikview to prepare their CV's!!! But will this work for us in India?
Hi Kunal, Thanks for sharing the details, do's n dont's etc to prepare effective resume. One important challenge I feel new comers to Analytics face is to identify where/which technology to focus on in order to start carreer in analytics. Laterals find it difficult to switch to analytic profiles if they do not have prior 5-6 years of work exp in analytics. Could you please share your views on this aspect?
Hi Ritz, Could you also share details of in what way(s) laterals found it difficult to switch to Analytics, what their backgrounds were, etc.?
The length of your CV should be ideally one page or a maximum of two pages. Q>> How can you complete your projects and professional experience when you have 10+ job experience.? Q>> What type of Tense should we you direct/indirect active/pasive Q>> Within two Page CV how can we arrange Business benefits?
Q1 . This is where infographics work. You dont have to put all the projects you worked in 10 yrs. YOu need to differentiate between whats necessary and whats not. After 10 yrs of experience, I don't think a Internship in your Engineering or MBA matters unless its in the same field/language in which you are still working. So remove whats not required. Q2 - I use Passive. . But no comments on that. Q3 - USually it will be like, this is my project or work, a 2 liner on what you did , describing your skill set used and then the business benifit for the client out of this in 2 lines.
Excellent tips, however they apply to the resume format, (~2 page summary used mainly in business) versus a CV or curriculum vitae (used mainly in academia and research). Curriculum vitae translates literally to 'course of life'. The resume is as described in this article, the CV is longer, more detailed and often up to 10 pages for highly experienced researchers. Details often include a publications list, which could take up multiple pages.
Hi Kunal, Really helpful article. Thought provoking for sure. Specially the examples you have come up with are very interesting way of showing your skills. Thanks a lot for your great work. Regards, VJ
Very insightful article. Infographics in CV's are really innovative & completely different from the conventional formats. Helps in marketing ourselves much better.. Thanks, Venkat
Hi Kunal, I follow your posts and find them very informative. I want to enter the field of analytics however I dont have a background in Maths. Can you suggest me a career path?I have already completed the Bigdata & hadoop training and currently learning python via courseera. Should I continue to master Hadoop,pig,hive etc and then go for cloudera certification or should I pursue SAS Or R? And where can I learn foundations of statistics?
Great Article, However, it would be nice if you could suggest some websites or tools/templates to make them?
Innovative way of making CV. Good article Kunal .
Very informative
Very creative ways of resume writing introduction
All the information is counted as valuable info . Thanks
Great artical Kunal. This is really impressive.I work in a MNC in analytical profile and m looking for inetersting project for free lancing. Please connect at [email protected] if anyone wants to leverage the opportunity.
Hi Kunal, Thank you for this blog. It's very helpful. Can you please suggest me something. I am working in Data warehouse testing and I want to move to Data Science. I am enrolled in Udacity's Data Analyst course. Will that help me get a job or I need to do other projects also. If so can you please provide some links from where I can do some projects. At the moment i know of Kaggle. Thanks, Anirban Chatterjee