What’s the difference between Causality and Correlation?
Introduction
Causation and Correlation are loosely used words in analytics. People tend to use these words interchangeably without knowing the fundamental logic behind them. Apparently, people get trapped in the phonetics of these words and end up using them at incorrect places. But, let me warn you that apart from the similar sounding names, there isn’t a lot common in the two phenomena. Their fundamental implications are very different.
Let’s understand the difference between Causation and Correlation using a few examples below. Analyze the following scenarios and tell us whether there is a causal relation between the two events (X and Y). Answers are provided below.
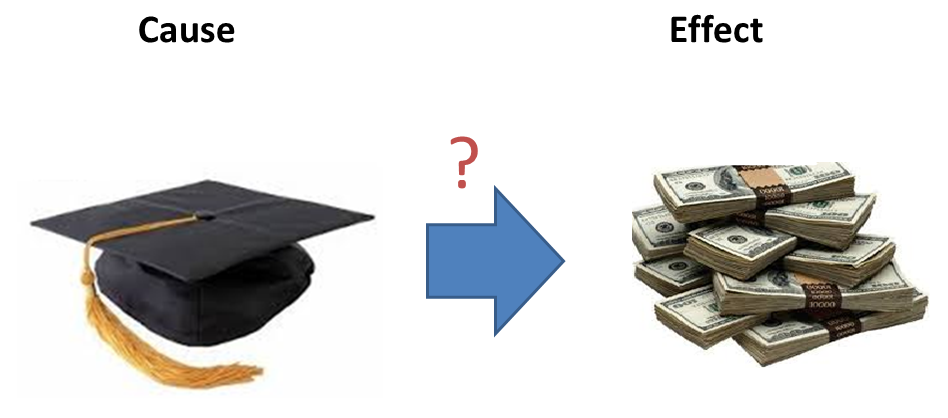
Example 1 : X – Tier of B-school college a student gets offer for => Y – Salary after the graduation
Hypothesis – Students going to premium B-schools get higher salaries on an average. Are these B-school a cause of getting better jobs?
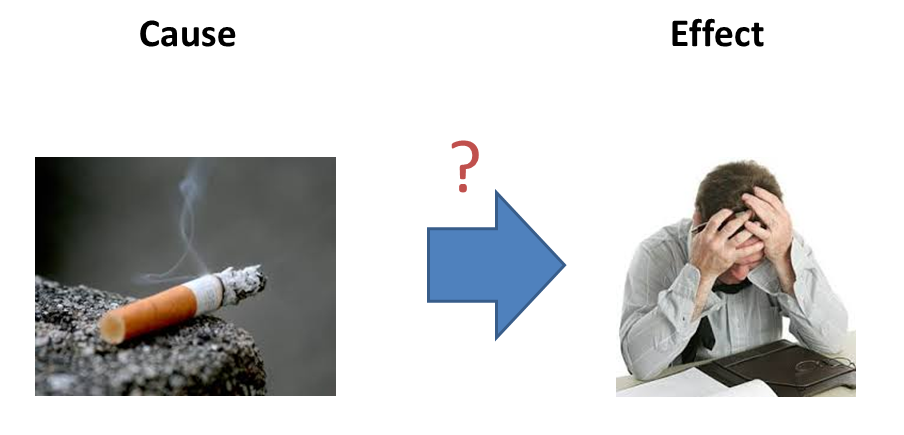
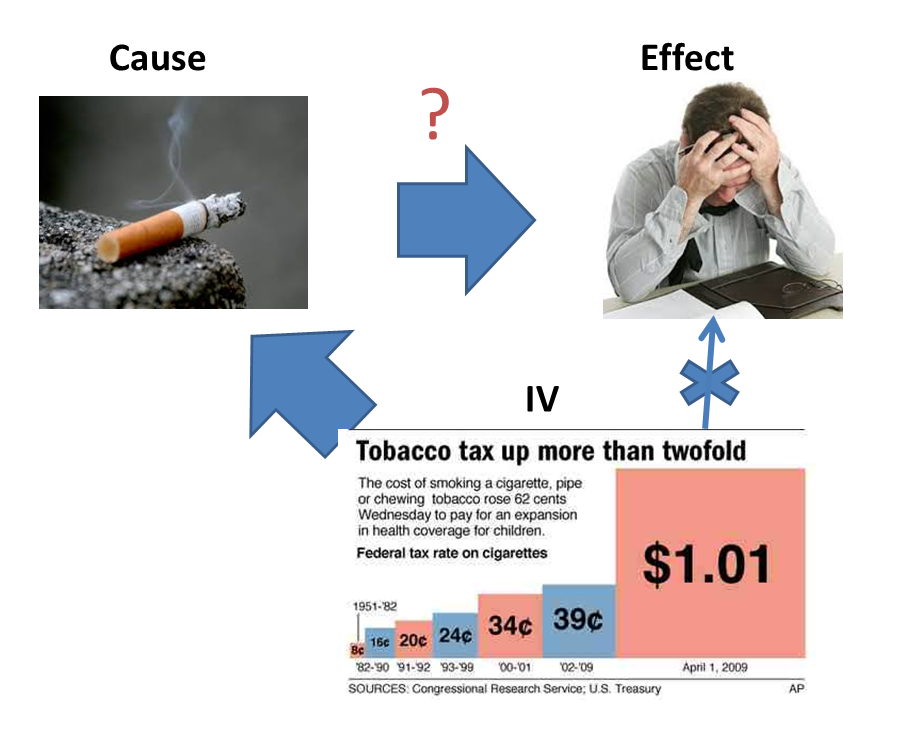
Example 2 : X – Smoking Cigarettes => Y – Level of Mental Stress
Hypothesis – People who smoke are found to have higher level of stress. Is smoking the reason of stress?
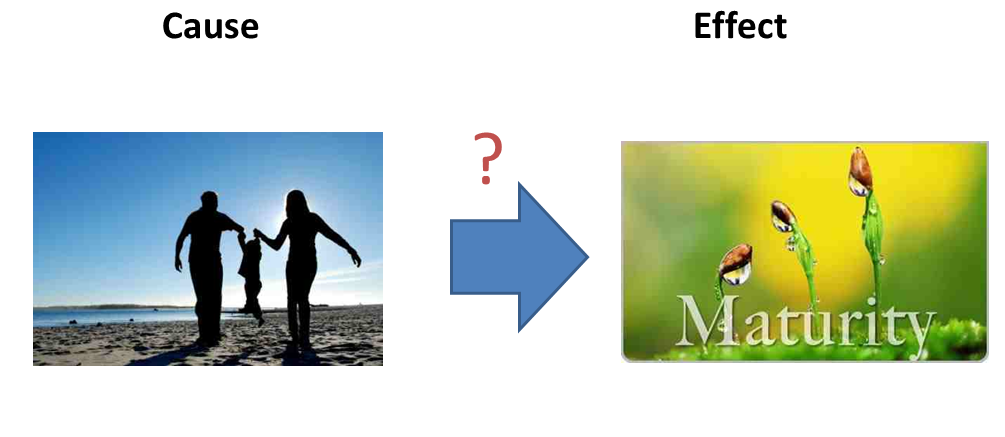
Example 3 : X – Having Kids => Y – Maturity level
Hypothesis – People get more matured after having kids? Is having kids a cause of attaining higher maturity levels?
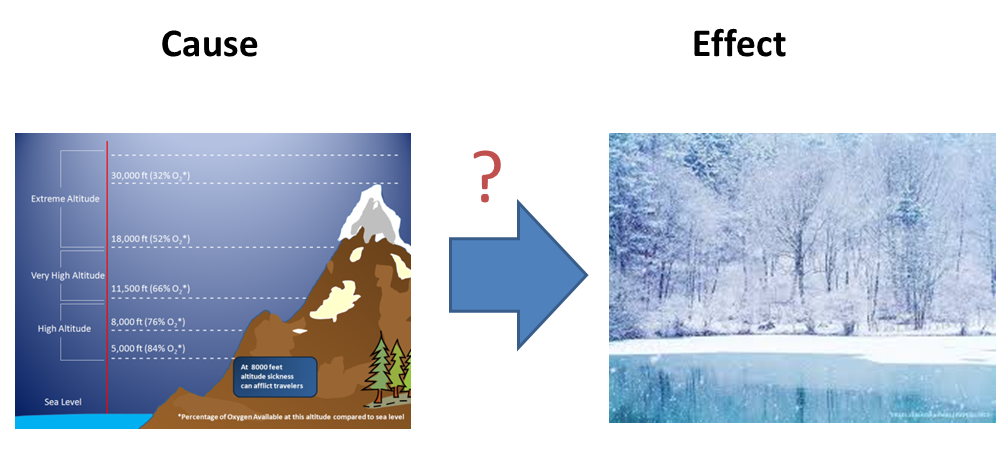
Example 4 : X – Altitude => Y – Temperature
Hypothesis – We witness lower temperature at high altitudes. Which means, the higher you go, the colder it would become. Is higher altitude a cause of lower temperature?
I hope the examples described above would have triggered your learning appetite and have got excited you to learn more on this. Though, this is not a newly discovered topic, but people still haven’t got firm grip on using these terms. Hence, I have tried to explain the aspects of causation and correlation in the simplest possible manner.
In this article, I’ll explain difference between correlation and causation followed by learning whether we just have correlation or we have causation pairs. Understanding of this concept is very essential if you want to keep your foundations strong in this analytics industry, where we now mostly work on black boxes. These techniques (causation and correlation) aren’t limited to only analytics, but their application spreads across all industries.
Here are the Answers:
Example 1 : Causal relation does not exist. For instance, only ambitious and intelligent people are selected from elite B-schools who further get much higher salary than the average. Hence, even if these students did not study in Tier 1 B-School, he/she still might get more than the average salaries. Hence, we have alternate reasoning issue in this case.
Example 2 : Causal relation does not exist. We can reject hypothesis based on inverse causality. For instance, higher mental stress can actually influence a person to smoke.
Example 3 : Causal relation does not exist. Once again, we can reject hypothesis based on inverse causality. For instance, only mature people are likely to be prepared to have kids. We can also apply alternate reasoning with underlying cause as the age. Higher age leads to both, having kids and higher maturity levels.
Example 4 : Causal relation does exist. We definitely know that inverse causality is not possible. Also alternate reasoning or mutual independence can be rejected.
Result: If you were able to answer all the 4 scenarios correctly, you are ready for the next concept. In case you got any of the scenario wrong, you probably need more practice on finding cause-effect pairs.
What are the keypoints in establishing causation?
Here are the key point ( X = > Y ) pairs used in establishing causation :
1. Alternate Reasoning : If there is an alternate reason (Z) which indeed can influence both X and Y (Z => X & Z => Y are true) , we can reject the hypothesis of X => Y.
2. Inverse Causality : If instead of X influencing Y, we have Y influencing X , we can reject X => Y hypothesis based on inverse causality.
3. Mutual independence : Sometimes X and Y might just be correlated and nothing else. In such cases we reject hypothesis based on mutual independence.
How can we conclusively derive cause-effect relationship?
In fields like pharma, it is very important to establish cause-effect pairs. And that’s why, there are enough researches done to find cause-effect pairs. Let’s understand the following definitions before we get down to mathematics :
1. Randomized Experimental data : An experiment is often defined as random assignment of observational units to different conditions, and conditions differ by the treatment of observational units. Treatment is a generic term, which translates most easily in medical applications (e.g. patients are treated differently under different conditions), but it applies to other areas as well.
2. Observational data : If we do not have the luxury to do a randomized experiment, we are forced to work on existing data sources. These events have already happened without any control. Hence, the selection is not random.
Deriving out causality from Observational data is very difficult and non-conclusive. For a conclusive result on causality, we need to do randomized experiments.
Why are observational data not conclusive?
1. Observational Data not conclusive because the selection in observational data are not randomized. We can never conclude individual cause-effect pair.
2. For instance, if the number of students graduating from Tier 1 B-school get higher salary; this will not conclude causality relationship because the selection was based on initial performance.
3. However, if we randomly select students for Tier 1 B-schools, this analysis will become more conclusive to establish causality.
Why don’t we do random experiment every time to establish causality?
There are multiple reason you might be asked to work on observational data instead of experiment data to establish causality.
First is, the cost involved to do these experiments. For instance, if your hypothesis is giving free I-phone to customers, this activity will have an incremental gain on sales of Mac. Doing this experiment without knowing anything on causality can be an expensive proposal.
Second is, not all experiments are allowed ethically. For instance, if you want to know whether smoking contributes to stress, you need to make normal people smoke, which is ethically not possible.
In that case, how do we establish causality using observational data?
There has been good amount of research done on this particular issue. The entire objective of these methodologies is to eliminate the effect of any unobserved variable. In this section, I will introduce you to some of these well known techniques :
1. Panel Model (Ordinary regression) : This method comes in very handy if the unobserved dimension is invariant along at least one dimension. For instance, if the unobserved dimension is invariant over time, we can try building a panel model which can segregate out the bias coming from unobserved dimension. For instance, in B Schools => High Salary example, we assumed that the non observable dimension is invariant over time.
Let’s try this methodology.
1. Following is the equation of regressing y (salary) against both Premium college (subscript T) and unobserved dimensions (subscript U)
![]()
2. But, because the unobserved dimension is invariant over time, we can simplify the equation as follows :
![]()
3. We can now eliminate the unobserved factor by differencing over time
![]()
Now, it becomes to find the actual coefficient of causality relationship between college and salary.
2. Simulated Control : Biggest concern with observation data is that we do not get treatment and non-treatment data for the same data point. For instance, referring to the smoking example above, a person can’t be a smoker and non-smoker at the same time.
But, what if, we can find out a look alike for all treated in the non-treated group. And then compare the response of this treatment among look alikes. This is the most common method implemented currently in the industry.
The look alike can be found using nearest neighbor algorithm, k-d tree or any other algorithm. Let’s take an instance, we have two people with same age group, gender, income etc. One of them starts smoking and another does not. Now the stress level can be compared over a period of time given no other condition changes among them.

While this might sound a very exciting approach theoretically, it is usually difficult to carve out pure simulated / virtual control and this can some time lead to conclusions, which may not be correct. This is actually a topic for a different article in future.
3. Instrumental Variable (IV) : This is probably the hardest one which I find to implement. Following are the steps to implement this technique :
- Find the cause – effect pair.
- Find an attribute which is related to cause but is independent of the error which we get by regressing cause-effect pair. This variable is known as Instrumental Variable.
- Now estimate the cause variables using IV.
- Try regressing estimated cause – effect to find the actual coefficient of causality.
What have we done here?
In observational data, any regression technique applied between cause-effect pair gives a biased coefficient. Using this methodology, we come out with an unbiased estimation. For example (in cigarette – mental stress pair), we might think it could be influenced by reverse causality.
Now, if we can find any information which is connected to cigarette consumption but not mental stress, we might be able to find the actual relationship. Generally IV are regulatory based variables. For example, here we found a tax regulation which increased only cigarette price and lead to lesser consumption of cigarettes across board. We can now try finding out the mental stress using the 4-step method discussed above.
4. Regression discontinuity design : This is amongst one of my favourite choices. It this makes the observational data really close to experimental design.
In the graph shown below, we are finding a dimension which has a spike on treatment and non-treatment population ratio. Suppose, we want to test the effect of scholarship in college on the grades by the end of course for students. Note that, scholarship is offered to students scoring more than 80% in their pre-college examinations. Here’s the twist. Because these students are already bright, they might continue being on top in future as well. Hence, this is a very difficult cause-effect relation to crack!
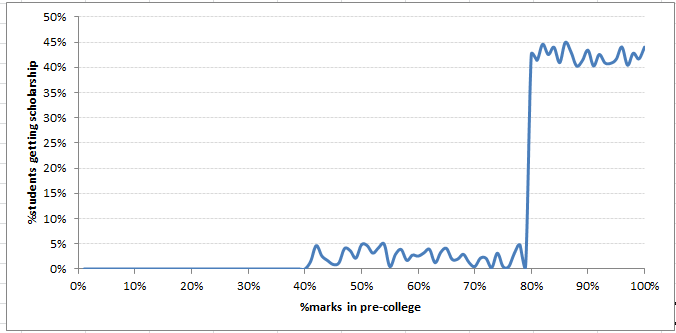
But, what if, we compare students who scored just below 80% (say 79.9%) with those who scored just above 80% (say 80.1%) on grades by end of the college. The assumption being that 79.9% student won’t be much different from 80.1% student. And the only thing which can change is the effect of scholarship. This is known as Quasi Randomized Selection.
Hence, the results are very close to perfect conclusions on causality. The only challenge with this methodology is that getting such a dimension is very difficult which can give a pure break up between treated and non-treated population.
End Notes
Establishing causality is probably the most difficult task in the field of analytics. The probability of getting it wrong is exceptionally high. Key concepts discussed in this article will help you address the question of causality to a good extent.
Just to end the article with some humor on the topic, here are a few images to drive the difference in correlation and causality.
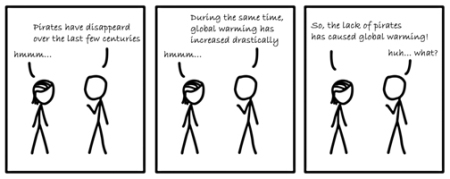
A spurious correlation:

Were you able to find the right cause-effect pairs given at the beginning of this article? Have you applied any of the 4 techniques discussed in this article? Do let us know your thoughts about this guide in the comments section below.
If you like what you just read & want to continue your analytics learning, subscribe to our emails, follow us on twitter or like our facebook page.
Tavish Srivastava, co-founder and Chief Strategy Officer of Analytics Vidhya, is an IIT Madras graduate and a passionate data-science professional with 8+ years of diverse experience in markets including the US, India and Singapore, domains including Digital Acquisitions, Customer Servicing and Customer Management, and industry including Retail Banking, Credit Cards and Insurance. He is fascinated by the idea of artificial intelligence inspired by human intelligence and enjoys every discussion, theory or even movie related to this idea.


Great article! Just a bit nit-picky, but can you really say that high altitude causes low temperatures, because it's really the low atmospheric pressures associated with high elevation that is the cause of the low temperature?
Nice read Tavish!
Very Nice Article. Thanks.
Good article Tavish
Pretty nicely explained the concepts...thanks
excellent article! could you please give some research papers on using simulated control to find causal relations? thanks a lot!
Nice !
Hi, Nice article. But to me, it depends on your point of view. For instance, the first example with college and salary, I had replied that it was a causality. Because they are smart people who doesn't have enough money to go the best school and, at least in my country, the salary depends more on your school than on your cleverness (because when you get hired, even if there some tests, you cannot really know how smart is the candidate). About the example 3, if you get pregnant accidently when you are young, I think at the same age, someone with a child is more mature than someone without child.
Very Well Explained...Thanks
Very well explained. Which applied research topics do you recommend for PhD level?