7 Regression Techniques You Should Know!
Introduction
Linear and Logistic regression techniques are usually the first algorithms people learn in data science. Due to their popularity, a lot of analysts even end up thinking that they are the only form of regression techniques. The ones who are slightly more involved think that they are the most important among all forms of regression analysis.
The truth is that there are innumerable forms of regressions. Each form holds its own importance and is best to apply in specific conditions. In this article, I have explained the most commonly used 7 types of regression in data science in a simple manner.
Through this article, I also hope that people develop an idea of the breadth of regressions, instead of just applying linear/logistic regression to every machine learning problem they come across and hoping that they would just fit!

If you’re new to data science and seeking a place to start your journey, we offer some comprehensive courses that might interest you:
- Introduction to Data Science Course: Covering the core topics of Python, Statistics and Predictive Modeling, it is the perfect way to take your first steps into data science
- Certified AI & ML Blackbelt+ Program
Learning Objectives
- Familiarize yourself with the different regression types in machine learning, including linear and logistic regression.
- Learn the regression equation and regression coefficients of each type.
- Know to differentiate between the 7 types of regression
Table of Contents
- Introduction
- What Is Regression Analysis?
- Why Do We Use Regression Analysis?
- Types of Regression Techniques
- 1. Linear Regression
- 2. Logistic Regression
- 3. Polynomial Regression
- 4. Stepwise Regression
- 5. Ridge Regression
- 6. Lasso Regression
- 7. ElasticNet Regression
- How to Select the Right Regression Model?
- Sample Projects
- Conclusion
- Frequently Asked Questions
What Is Regression Analysis?
Regression analysis is a form of predictive modelling technique which investigates the relationship between a dependent (target) and independent variable (s) (predictor). This technique is used for forecasting, time series modelling and finding the causal effect relationship between the variables. For example, relationship between rash driving and number of road accidents by a driver is best studied through regression.
Regression analysis is an important tool for modelling and analyzing data. Here, we fit a curve / line to the data points, in such a manner that the differences between the distances of data points from the curve or line is minimized. I’ll explain this in more details in coming sections.
Why Do We Use Regression Analysis?
As mentioned above, regression analysis estimates the relationship between two or more variables. Let’s understand this with an easy example:
Let’s say, you want to estimate growth in sales of a company based on current economic conditions. You have the recent company data which indicates that the growth in sales is around two and a half times the growth in the economy. Using this insight, we can predict future sales of the company based on current & past information.
There are multiple benefits of using regression analysis. They are as follows:
- It indicates the significant relationships between dependent variable and independent variable.
- It indicates the strength of impact of multiple independent variables on a dependent variable.
Regression analysis also allows us to compare the effects of variables measured on different scales, such as the effect of price changes and the number of promotional activities. These benefits help market researchers / data analysts / data scientists to eliminate and evaluate the best set of variables to be used for building predictive models.
Types of Regression Techniques
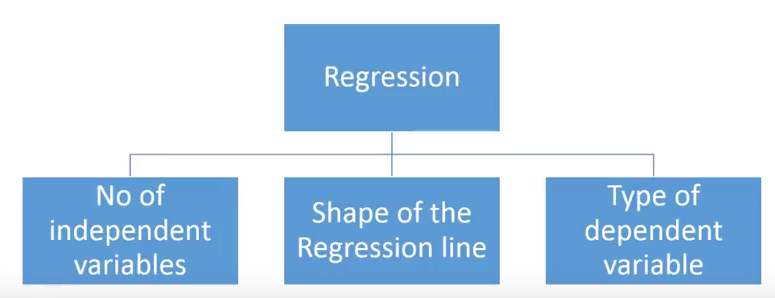
There are various kinds of regression techniques available to make predictions. These techniques are mostly driven by three metrics (number of independent variables, type of dependent variables and shape of regression line). We’ll discuss them in detail in the following sections.
For the creative ones, you can even cook up new regressions, if you feel the need to use a combination of the parameters above, which people haven’t used before. But before you start that, let us understand the most commonly used regressions.
1. Linear Regression
It is one of the most widely known modeling technique. Linear regression is usually among the first few topics which people pick while learning predictive modeling. In this technique, the dependent variable is continuous, independent variable(s) can be continuous or discrete, and nature of regression line is linear.
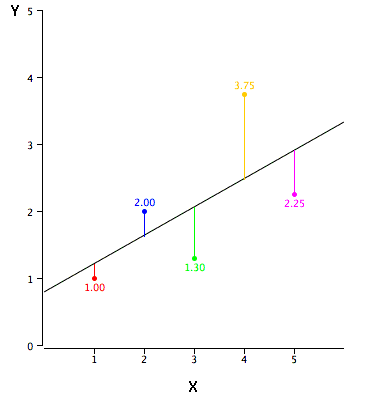
Linear Regression establishes a relationship between dependent variable (Y) and one or more independent variables (X) using a best fit straight line (also known as regression line).
It is represented by an equation Y=a+b*X + e, where a is intercept, b is slope of the line and e is error term. This equation can be used to predict the value of target variable based on given predictor variable(s).
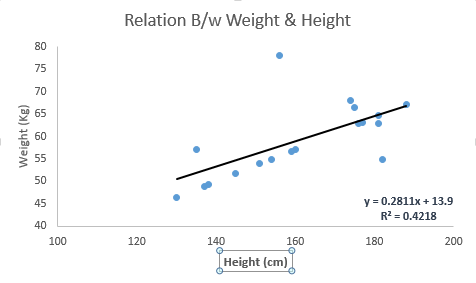
The difference between simple linear regression and multiple linear regression is that, multiple linear regression has (>1) independent variables, whereas simple linear regression has only 1 independent variable. Now, the question is “How do we obtain best fit line?”.
How to obtain best fit line (Value of a and b)?
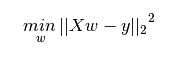
This task can be easily accomplished by Least Square Method. It is the most common method used for fitting a regression line. It calculates the best-fit line for the observed data by minimizing the sum of the squares of the vertical deviations from each data point to the line. Because the deviations are first squared, when added, there is no cancelling out between positive and negative values.
We can evaluate the model performance using the metric R-square. To know more details about these metrics, you can read: Model Performance metrics Part 1, Part 2 .
Important Points:
- There must be linear relationship between independent and dependent variables
- Multiple regression suffers from multicollinearity, autocorrelation, heteroskedasticity.
- Linear Regression is very sensitive to Outliers. It can terribly affect the regression line and eventually the forecasted values.
- Multicollinearity can increase the variance of the coefficient estimates and make the estimates very sensitive to minor changes in the model. The result is that the coefficient estimates are unstable
- In case of multiple independent variables, we can go with forward selection, backward elimination and step wise approach for selection of most significant independent variables.
2. Logistic Regression
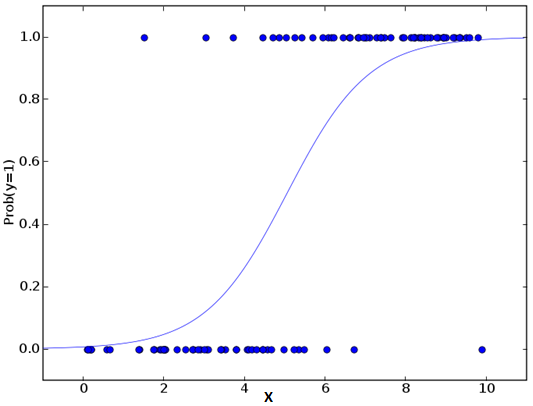
Logistic regression is used to find the probability of event=Success and event=Failure. We should use logistic regression when the dependent variable is binary (0/ 1, True/ False, Yes/ No) in nature. Here the value of Y ranges from 0 to 1 and it can represented by following equation.
odds= p/ (1-p) = probability of event occurrence / probability of not event occurrence
ln(odds) = ln(p/(1-p))
logit(p) = ln(p/(1-p)) = b0+b1X1+b2X2+b3X3....+bkXk
Above, p is the probability of presence of the characteristic of interest. A question that you should ask here is “why have we used log in the equation?”.
Since we are working here with a binomial distribution (dependent variable), we need to choose a link function which is best suited for this distribution. And, it is logit function. In the equation above, the parameters are chosen to maximize the likelihood of observing the sample values rather than minimizing the sum of squared errors (like in ordinary regression).
Important Points:
- Logistic regression is widely used for classification problems
- Logistic regression doesn’t require linear relationship between dependent and independent variables. It can handle various types of relationships because it applies a non-linear log transformation to the predicted odds ratio
- To avoid over fitting and under fitting, we should include all significant variables. A good approach to ensure this practice is to use a step wise method to estimate the logistic regression
- It requires large sample sizes because maximum likelihood estimates are less powerful at low sample sizes than ordinary least square
- The independent variables should not be correlated with each other i.e. no multi collinearity. However, we have the options to include interaction effects of categorical variables in the analysis and in the model.
- If the values of dependent variable is ordinal, then it is called as Ordinal logistic regression
- If dependent variable is multi class then it is known as Multinomial Logistic regression.
Note: You can understand the above regression techniques in a video format – Fundamentals of Regression Analysis
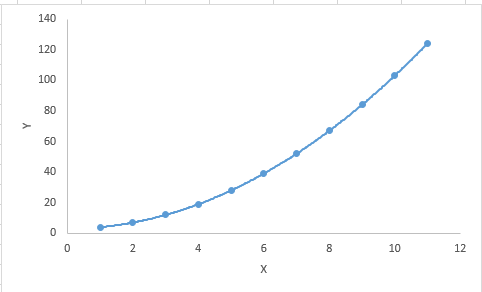
3. Polynomial Regression
A regression equation is a polynomial regression equation if the power of independent variable is more than 1. The equation below represents a polynomial equation:
y=a+b*x^2
In this regression technique, the best fit line is not a straight line. It is rather a curve that fits into the data points.
Important Points:
- While there might be a temptation to fit a higher degree polynomial to get lower error, this can result in over-fitting. Always plot the relationships to see the fit and focus on making sure that the curve fits the nature of the problem. Here is an example of how plotting can help:
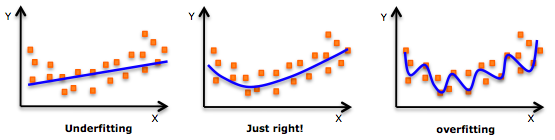
- Especially look out for curve towards the ends and see whether those shapes and trends make sense. Higher polynomials can end up producing wierd results on extrapolation.
4. Stepwise Regression
This form of regression is used when we deal with multiple independent variables. In this technique, the selection of independent variables is done with the help of an automatic process, which involves no human intervention.
This feat is achieved by observing statistical values like R-square, t-stats and AIC metric to discern significant variables. Stepwise regression basically fits the regression model by adding/dropping co-variates one at a time based on a specified criterion. Some of the most commonly used Stepwise regression methods are listed below:
- Standard stepwise regression does two things. It adds and removes predictors as needed for each step.
- Forward selection starts with most significant predictor in the model and adds variable for each step.
- Backward elimination starts with all predictors in the model and removes the least significant variable for each step.
The aim of this modeling technique is to maximize the prediction power with minimum number of predictor variables. It is one of the method to handle higher dimensionality of data set.
5. Ridge Regression
Ridge Regression is a technique used when the data suffers from multicollinearity (independent variables are highly correlated). In multicollinearity, even though the least squares estimates (OLS) are unbiased, their variances are large which deviates the observed value far from the true value. By adding a degree of bias to the regression estimates, ridge regression reduces the standard errors.
Above, we saw the equation for linear regression. Remember? It can be represented as:
y=a+ b*x
This equation also has an error term. The complete equation becomes:
y=a+b*x+e (error term), [error term is the value needed to correct for a prediction error between the observed and predicted value]
=> y=a+y= a+ b1x1+ b2x2+....+e, for multiple independent variables.
In a linear equation, prediction errors can be decomposed into two sub components. First is due to the biased and second is due to the variance. Prediction error can occur due to any one of these two or both components. Here, we’ll discuss about the error caused due to variance.
Ridge regression solves the multicollinearity problem through shrinkage parameter λ (lambda). Look at the equation below.
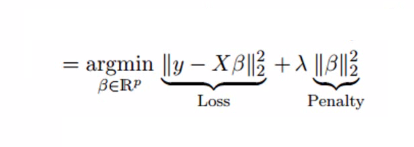
In this equation, we have two components. First one is least square term and other one is lambda of the summation of β2 (beta- square) where β is the coefficient. This is added to least square term in order to shrink the parameter to have a very low variance.
Important Points:
- The assumptions of this regression is same as least squared regression except normality is not to be assumed
- Ridge regression shrinks the value of coefficients but doesn’t reaches zero, which suggests no feature selection feature
- This is a regularization method and uses l2 regularization.
6. Lasso Regression
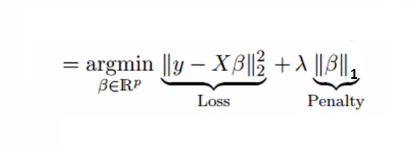
Similar to Ridge Regression, Lasso (Least Absolute Shrinkage and Selection Operator) also penalizes the absolute size of the regression coefficients. In addition, it is capable of reducing the variability and improving the accuracy of linear regression models. Look at the equation below: Lasso regression differs from ridge regression in a way that it uses absolute values in the penalty function, instead of squares. This leads to penalizing (or equivalently constraining the sum of the absolute values of the estimates) values which causes some of the parameter estimates to turn out exactly zero. Larger the penalty applied, further the estimates get shrunk towards absolute zero. This results to variable selection out of given n variables.
Important Points:
- The assumptions of lasso regression is same as least squared regression except normality is not to be assumed
- Lasso Regression shrinks coefficients to zero (exactly zero), which certainly helps in feature selection
- Lasso is a regularization method and uses l1 regularization
- If group of predictors are highly correlated, lasso picks only one of them and shrinks the others to zero
7. ElasticNet Regression
ElasticNet is hybrid of Lasso and Ridge Regression techniques. It is trained with L1 and L2 prior as regularizer. Elastic-net is useful when there are multiple features which are correlated. Lasso is likely to pick one of these at random, while elastic-net is likely to pick both.
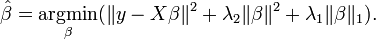
A practical advantage of trading-off between Lasso and Ridge is that, it allows Elastic-Net to inherit some of Ridge’s stability under rotation.
Important Points:
- It encourages group effect in case of highly correlated variables
- There are no limitations on the number of selected variables
- It can suffer with double shrinkage
Beyond these 7 most commonly used regression techniques, you can also look at other models like Bayesian, Ecological and Robust regression.
How to Select the Right Regression Model?
Life is usually simple, when you know only one or two techniques. One of the training institutes I know of tells their students – if the outcome is continuous – apply linear regression. If it is binary – use logistic regression! However, higher the number of options available at our disposal, more difficult it becomes to choose the right one. A similar case happens with regression models.
Within multiple types of regression models, it is important to choose the best suited technique based on type of independent and dependent variables, dimensionality in the data and other essential characteristics of the data.
Factors to Consider While Selecting Regression Model
Below are the key factors that you should practice to select the right regression model:
- Data exploration is an inevitable part of building predictive model. It should be you first step before selecting the right model like identify the relationship and impact of variables
- To compare the goodness of fit for different models, we can analyse different metrics like statistical significance of parameters, R-square, Adjusted r-square, AIC, BIC and error term. Another one is the Mallow’s Cp criterion. This essentially checks for possible bias in your model, by comparing the model with all possible submodels (or a careful selection of them).
- Cross-validation is the best way to evaluate models used for prediction. Here you divide your data set into two group (train and validate). A simple mean squared difference between the observed and predicted values give you a measure for the prediction accuracy.
- If your data set has multiple confounding variables, you should not choose automatic model selection method because you do not want to put these in a model at the same time.
- It’ll also depend on your objective. It can occur that a less powerful model is easy to implement as compared to a highly statistically significant model.
- Regression regularization methods(Lasso, Ridge and ElasticNet) works well in case of high dimensionality and multicollinearity among the variables in the data set.
Sample Projects
Now, its time to take the plunge and actually play with some other real datasets. Try the techniques learnt in this post on the datasets provided in the following practice problems and let us know in the comment section how it worked out for you!
 | Practice Problem: Food Demand Forecasting Challenge | Predict the demand of meals for a meal delivery company |
 | Practice Problem: Predict Number of Upvotes | Predict number of upvotes on a query asked at an online question & answer platform |
Conclusion
By now, I hope you would have got an overview of regression. These regression techniques should be applied considering the conditions of data. One of the best trick to find out which technique to use, is by checking the family of variables, i.e., discrete or continuous.
In this article, I discussed about 7 types of regression and some key facts associated with each technique. As somebody who’s new in this industry, I’d advise you to learn these techniques and later implement them in your models.
For better understanding, I recommend our free course – Fundamentals of Regression Analysis.
Frequently Asked Questions
A. The 7 most commonly used regression techniques everyone in data science must know are linear, logistic, polynomial, stepwise, ridge, lasso, and ElasticNet regression.
A. Linear regression and logistic regression are the two most basic regression techniques in data science.
A. Regression analysis is a predictive modeling technique that analyzes the relationship between a dependent (target) and independent variable(s) (predictor).
I am a Business Analytics and Intelligence professional with deep experience in the Indian Insurance industry. I have worked for various multi-national Insurance companies in last 7 years.


Hi Sunil, Really a nice article for understanding the regression models. Especially for novice like me who are stepping into Analytic .
Thanks for the comment ...
Could you please, provide a material ( book/website) where I can understand concept underlying in such regression techniques.
Thanks for the comment ... You can read book "The Elements of Statistical Learning", it has detailed explanation of these regression models. Regards, Sunil
A good refresher on Regression techniques
Hi Sunil Thanks for posting this. Very nice summary on a technique used so often but underutilised when looking at the different forms available. You wouldnt be interested in doing something similar for classification techniques..quite a few here as well.. Tom
Thanks Tom...you can refer article on most common machine learning algorithms http://www.analyticsvidhya.com/blog/2015/08/common-machine-learning-algorithms/. Here I have discussed various types of classification algorithms like decision tree, random forest, KNN, Naive Bayes... Regards, Sunil
Dear sir, Is the regression applied for predicting the results of a college for the coming academic year.
Hi Sunil, The difference given between linear regression and multiple regression needs correction. When there is just one independent and one dependent variable, it is called "simple linear regression" not just linear regression.
Hi PratzJoshi, Thanks for highlighting it... Regards, Sunil
Hey,quite nice article.It did help me broaden my perspective regarding the regression techniques(specially ElasticNet),but still it would be nice to elucidate upon the differences between l1 and l2 regularization techniques.For this,http://www.quora.com/What-is-the-difference-between-L1-and-L2-regularization will be very helpful.Though it could be incorporated into a new article I think.
I'm sorry but I am going to complain again. This is an excellent article. However, when I go to save it or print it, it is a mess! If I print from IE, the only browser allowed on my network, all the ads and hypertext links cover the article text; you cannot read the article. I had suggested having a feature where you use a button to convert the article to a PDF, which can them be printed without the ads and hypertext. You did in once, then stopped. Please start again!
Good consolidation of concepts...Sunil do you have a comprehensive data set upon which we can apply all/few of the the above techniques and see how each regression behaves...thanks again
Shashi, You can look at scikit-learn example data sets.. Regards, Sunil
Hi Sunil, Nice compilation. Suggesting a correction , elastic net penalty has another parameter too and is written as lambda * summation ([alpha * L2 penalty + (1-alpha)* L1 Penalty ] ).... Also quoting book by trevor & hastie "The elastic-net selects variables like the lasso, and shrinks together the coefficients of correlated predictors like ridge." like your posts, very informative. -Lalit
Hi, Can you please explain this point mentioned under the logistic regression - multi collinearity part "However, we have the options to include interaction effects of categorical variables in the analysis and in the model."
Hi Seema, Read this article to understand the effect of interaction in detail. http://www.theanalysisfactor.com/interpreting-interactions-in-regression/ Regards, Sunil
Hi sunil, The article seems very interesting. Please can you let me know how can we implement Forward stepwise Regression in python as we dont have any inbuilt lib for it.
good article especially for computer science students.please provide this and further articles in pdf.thank you.
thank you so much for this valuable article it is very nice
Thanks fo the guide. Just one question : do you really think that "stepwise regression" is a type of regression? In my point of view, it's just a compilation of methods for selecting relevant variables. And it is performed by making several successive (real) regression technics (linear, polynomial, ridge or lasso...).
Very useful article. Are there any specific types of regression techniques which can be used for a time series stationary data?
Hi, Very nice article, crisp n neat! Thank you☺ In 2. Logistic regression We use log because while calculating MLE ( Maximum Likelihood Estimate) it is easy to differentiate and equate to 0. Easy to differenciate log (a * b) rather than just (a * b) Where a = P and b = 1-P Correct me if I m wrong.
i just love this article :) very very useful :)
Sunil, Great feeling to get a modern insight to what I learnt 35 years ago. Excellent. Professional practicing today may have several question to clarify. We had no option to choose Data Analytics as a popular profession in 80's. It was mainly R&D to use regression techniques. Compliment to you for such a vast subject so lucidly worded and explained.. What fascinated me most, is you mention of a tutor teaching students in an institute - if outcome is continuous use linear and if it is binary, use logistics. That's simplistic for a reader to appreciate the importance of Regression. What I want to ask is as under: In case of multiple independent variables, we can go with forward selection, backward elimination and step wise approach for selection of most significant independent variables. Please let me know where to get little details on these? Compliments once again. All is well. Asesh Datta
Thanks Sunil , Useful article . Why is poisson regression not mentioned here.
Hi sunil Very nice aticle and really very informative and interesting. With regard Fazal azeem
Amazing article, broadens as once seemingly narrow concept and gives food for thought. Thank you.
Hi, greetings to you. Kindly provide the technical difference among the Ordinary Least Square / Robust regression, Step wise regression,principal component regression & partial least square regression.
Hi All, i would like to start data science from Zero to expert level. I donot how where to start this data science. Can you please help and suggest on this. Please provide me any material to start reading on my own. Please share any material - [email protected]
My lover returned back to me I'd like to say a big thanks to (dr_mack@yahoo. com) my lover have learned to appreciate me more and more day by day, and he doesn't take me for granted.
Excellent Post Sunil, I loved the way you explained the things. Very good post indeed. I would love to see as many examples from real life as possible.
Very nice article. You explained the techniques in a language that one could easily understand. Thanks
Very useful article. Are there any specific types of regression techniques which can be used for a time series stationary data?
of course it was good article.Could you please elaborate about principal component regression analysis and partial least square regression.
Hi Sunil, This article has very useful information. But I have a doubt. The correlation is hero of the regression techniques without which there is no scope for blockbuster movies called predictive models:) As far as I know Correlation cannot be causation. So, here in the "what is regression?" section, you have mentioned regression can be helpful in finding causal effect relationship between variables. Can you please brief about how can we find causal effect relation using regression conceptually or statistically? Thanks
Nice article. I want to use some regression technique for anomaly detection. But the data set contains only one predictor variable, Which model I can use for this scenario? Please help me
Just Amazing! The article is easy to understand for person like me who comes from biological background. Thanks buddy!
Thanks SMS
Thanks Sunil for a nice basic approach of Regression.
Thank you very much!
This is an awesome article. I just want to point out something important for people that may be new to modeling as many data science students I've mentored get overwhelmed and confused about what the different types of regression truly are, and what the true definition of linear regression is. These aren't really different types of regression models per se. This is a mix of different techniques with different characteristics, all of which can be used for linear regression, logistic regression or any other kind of generalized linear model. Linear and logistic are the only two types of base models covered. Polynomial is just using transformations of the variables, but the model is still linear in the beta parameters. Thus it is still linear regression. Even a weird model like y = exp(a + bx) is a generalized linear model if we use the log-link for logistic regression. This yields log y = a + bx. This is a concept that bewilders a lot of people. Stepwise is just a method of building a model by adding and removing variables based on the F statistic. Ridge, Lasso and ElasticNet aren't really regressions, they're penalties (regularization) on the loss function (OLS), or log-likelihood function (logistic and GLM). Hence, they are useful for other models that are distinct from regression, like SVMs. We usually say "linear regression with a regularization term/penalty." To be technical, different regression models would be plain linear, logistic, multinomial, poisson, gamma, Cox, etc.
Hi Sunil, Wonderfull put down information. Thanks for sharing this in detail.
Why do we need to predict the future by casual logic when it can be controlled by Effectual logic.
Hi Sunil , Really a good gist on regression techniques. Thanks for sharing the article.
Hi, Really appreciate the article and its content. Just one observation : As per the comment for line 51, the prediction should be ran on test dataset i.e. test_x but instead its done on train_x. Can we plz check on this ?
Thanks a lot Sunil for such a well explained article on regression types and selection. Your expert way of explaining difficult topic into easy way is really appreciated!