Data scientist hack to find the right Meetup groups (using Python)
Introduction
Data Scientists are a breed of lazy animals! We detest the practice of doing any repeatable work manually. We cringe at mere thought of doing tedious manual tasks and when we come across one, we try and automate it so that the world becomes a better place!
We have been running a few meetups across India for last few months and wanted to see what some of best meetups across the globe are doing. For a normal human, this would mean surfing through pages of meetups and finding out this information manually.
Not for a data scientist!
What are meetups?
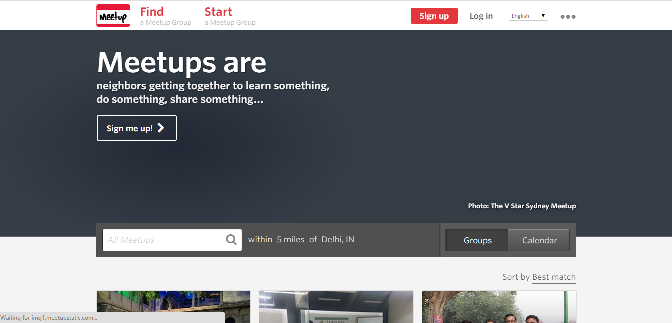
Meetup can be best understood as self organized gathering of people done to achieve a pre-defined objective. Meetup.com is the world’s largest network of local groups. Meetup’s mission is to ‘revitalize local community and help people around the world to self organize’.
The process of searching meetups can be quite time consuming (I’d rather say). There are multiple limitation attached to it (which I’ve explained in the following section). But, how would a data scientist perform this task to save time? Of course, he’d endeavor to automate this process!
In this article, I’ll introduce you to a data scientist’s approach of locating meetup groups using Python. Taking this as a reference, you can find groups located at any corner of the earth. You can also add your own layer of analysis to find out some interesting insights.
Register for Data Hackathon 3.X – Win Amazon Voucher worth Rs.10,000(~$200)
The Challenge with manual approach
Let us say, you want to find out and join some of the best meetups in your area. You can obviously do this task manually, but there are a few challenges you bump into:
- There could be several groups with similar sounding names and purpose. It becomes difficult to find the right ones by just reading names.
- Let us say, you are looking for meetups in data science, you will need to manually browse through each of the groups, see various parameters to judge its quality (e.g. frequency of meetup, number of members, average review etc.) and then take a decision to join the group or not – already sounds like a lot of work to me!
- In addition, if you have some specific requirement like you want to see groups present in multiple cities, you will end up browsing groups from each city manually – I am already cringing at the thought of it.
Assume that you are in a locality with more then 200 groups in area of your interest. How would you find the best ones?

The Data Scientist Solution
In this article, I have identified various Python meetup groups from cities of India, USA, UK, HK, TW and Australia. Following are the steps I will perform:
- Fetch information from meetup.com using the API they have provided
- Move the data into a DataFrame and
- Analyse it and join the right groups
These steps are quite easy to perform. Below, I am listing the steps to perform them. As mentioned before, this is just the start of possibilities which open up. You can use this information to pull out a lot of insights about various communities across the globe.
Step-0: Import Libraries
Below are the list of libraries, I have used to code this project.
import urllib
import json
import pandas as pd
import matplotlib.pyplot as plt
from geopy.geocoders import Nominatim
Here’s a quick overview of these libraries:
- urllib: This module provides a high-level interface for fetching data from the World Wide Web.
- json (Java Script Object Notation): The json library can parse JSON from strings or files. The library parses JSON into a Python dictionary or list.
- pandas: It is used for structured data operations and manipulations. It is extensively used for data munging and preparation.
- matplotlib: It is used for plotting vast variety of graphs, starting from histograms to line plots to heat plots.
- geocoders: Simple and consistent geocoding library written in Python.
Step-1: Use API to read data in JSON format
You can fetch data from any website in various ways:
- Crawl the web pages using a combination of libraries like BeautifulSoup and Scrapy. Find underlying trends in html using regular expressions to pull the required data.
- If the website provides an API (Application Programming Interface), use it to fetch the data. You can understand this as a middleman between a programmer and an application. This middleman accepts requests and, if that request is allowed, returns the data.
- Tools like import.io can also help you do this.
For the websites which provide an API, it is usually the best way to fetch the information. The first method mentioned above is susceptible to layout changes on a page and can get very messy at times. Thankfully, Meetup.com provides various APIs to access required data. Using this API, we can access information about various groups.
To access API based automated solution, we would require value for sig_id and sig (different for different users). Follow below steps to access these.
- Login on meetup.com. if you don’t have an account, then please signup
- To extract information about groups, go to API. To know more about attribute of API, read here.
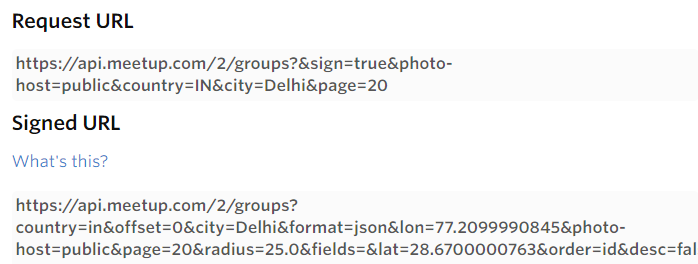
- Here, you can provide your input keywords for city, country, state, topic and various other fields for extracting relevant information. Provide value for any of the field. Like for topics, I have given “Python” and click on ‘show response’. You will get a signed url. It displays value for sig_id and sig, store these values.
"https://api.meetup.com/2/groups?offset=0&format=json&topic=python&photo-host=public&page=20&radius=25.0&fields=&order=id&desc=false&sig_id=******&sig=*****************"
Step-2: Generate list of signed URLs for all given cities
Now, we should solicit signed URL for each search (in our case, city+topic) and output of these signed URLs will provide the detail information about matched groups:
- Create a list of all cities
- Create an object to access longitude and latitude of city
- Access city from given list and generate latitude and longitude using “geolocator” object
- Generate url string with required attributes like data format(json), radius (number miles from center of the city, 50), topic(Python), latitude and longitude
- Iterate this step for each city and append all URLs in a list
places = [ "san fransisco", "california", "boston ", "new york" , "pennsylvania", "colorado", "seattle", "washington","los angeles", "san diego", "houston", "austin", "kansas", "delhi", "chennai", "bangalore", "mumbai" , "Sydney","Melbourne", "Perth", "Adelaide", "Brisbane", "Launceston", "Newcastle" , "beijing", "shanghai", "Suzhou", "Shenzhen","Guangzhou","Dongguan", "Taipei", "Chengdu", "Hong Kong"]
urls = [] #url lists
radius = 50.0 #add the radius in miles
data_format = "json"
topic = "Python" #add your choice of topic here
sig_id = "########" # initialize with your sign id, check sample signed key
sig = "##############" # initialize with your sign, check sample signed key
for place in places:
 location = geolocator.geocode(place)
 urls.append("https://api.meetup.com/2/groups?offset=0&format=" + data_format + "&lon=" + str(location.longitude) + "&topic=" + topic + "&photo-host=public&page=500&radius=" + str(radius)+"&fields=&lat=" + str(location.latitude) + "&order=id&desc=false&sig_id=" +sig_id + "&sig=" + sig)
Step-3: Read data from URL and access relevant features in a DataFrame
Now, we have list of URLs for all cities. Next, we will use urllib library to read data into JSON format. Then, we’ll read the data to a list before converting it to a DataFrame.
city,country,rating,name,members = [],[],[],[],[]
for url in urls:
response = urllib.urlopen(url)
data = json.loads(response.read())
data=data["results"] #accessed data of results key only
for i in data :
city.append(i['city'])
country.append(i['country'])
rating.append(i['rating'])
name.append(i['name'])
members.append(i['members'])
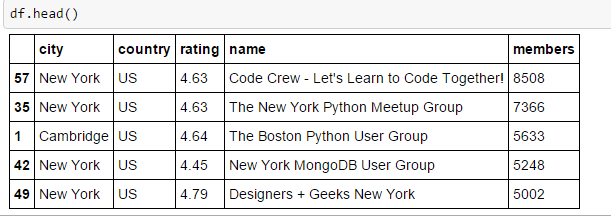
df = pd.DataFrame([city,country,rating,name,members]).T
df.columns=['city','country','rating','name','members']
Step-4: Compare Meetup groups across various cities
Time to analyse the data now and finding the appropriate groups based on various metrics like number of members, ratings, city and others. Below are the some basic findings, which I have generated for python groups across different cities of India, USA, UK, HK, TW and Australia.
To know more about these python codes, you can read articles on data exploration and visualization using python
Number of Python groups across six countries
freq = df.groupby('country').city.count()
fig = plt.figure(figsize=(8,4))
ax1 = fig.add_subplot(121)
ax1.set_xlabel('Country')
ax1.set_ylabel('Count of Groups')
ax1.set_title("Number of Python Meetup Groups")
freq.plot(kind='bar') 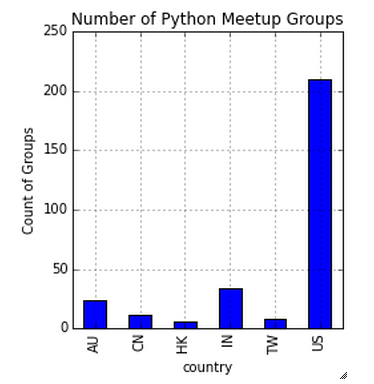 Above you can notice that US is the leader in python meetup groups. This stats can also help us to estimate the penetration of python in US data science industry compare to others.
Average size of groups across countries
freq = df.groupby('country').members.sum()/df.groupby('country').members.count()
fig = plt.figure(figsize=(8,4))
ax1 = fig.add_subplot(121)
ax1.set_xlabel('Country')
ax1.set_ylabel('Average Members in each group')
ax1.set_title("Python Meetup Groups")
freq.plot(kind='bar')
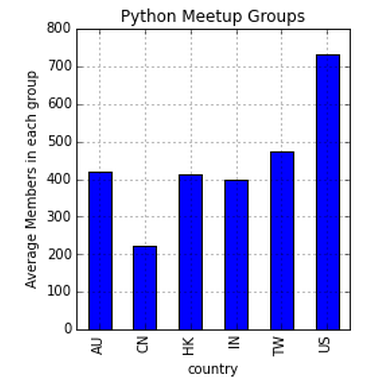
Once again, US emerges as the leader in average number of members in each group whereas CN has lowest average.
Average rating of groups across countries
freq = df.groupby('country').rating.sum()/df.groupby('country').rating.count()
fig = plt.figure(figsize=(8,4))
ax1 = fig.add_subplot(121)
ax1.set_xlabel('Country')
ax1.set_ylabel('Average rating')
ax1.set_title("Python Meetup Groups")
freq.plot(kind='bar')
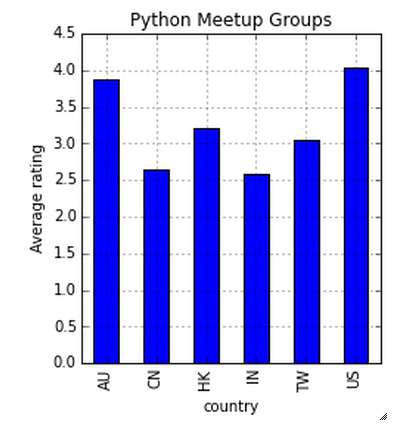 AU and US has similar average rating (~4) across groups.
Top 2 groups for each country
df=df.sort(['country','members'], ascending=[False,False])
df.groupby('country').head(2)
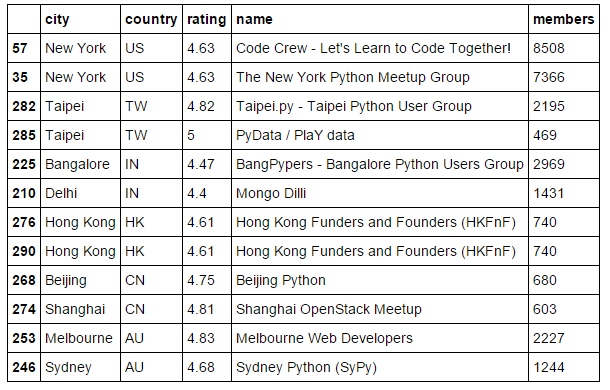
Time to identify top two groups from each country based on number of members. You can also identify the groups based on rating. Here I have done basic analysis to illustrate this approach. You can access other API’s also to find information like upcoming events, number of events, duration of events and others and after that merge all the relevant information based on group_id (or key value).
Final Code
Below is final code of this exercise, you can play with it by putting your sig_id and sig key and search various results of different topic across different cities. I have also uploaded it on GitHub.
import urllib
import json
import pandas as pd
import matplotlib.pyplot as plt
from geopy.geocoders import Nominatim
geolocator = Nominatim() #create object
places = [ "san fransisco", "california", "boston ", "new york" , "pennsylvania", "colorado", "seattle", "washington","los angeles", "san diego", "houston", "austin", "kansas", "delhi", "chennai", "bangalore", "mumbai" , "Sydney","Melbourne", "Perth", "Adelaide", "Brisbane", "Launceston", "Newcastle" , "beijing", "shanghai", "Suzhou", "Shenzhen","Guangzhou","Dongguan", "Taipei", "Chengdu", "Hong Kong"]
# login on meetup.com. if you dont have an account, then please signup
# Go to https://secure.meetup.com/meetup_api/console/?path=/2/groups
# In the topics like "Python", enter topic of your choice. and click on show response
# copy the signed key. in the singed key, copy the sig_id and sig and initialise variables sig_id and sig
# sample signed key : "https://api.meetup.com/2/groups?offset=0&format=json&topic=python&photo-host=public&page=20&radius=25.0&fields=&order=id&desc=false&sig_id=******&sig=*****************"
urls = [] #url lists
radius = 50.0 #add the radius in miles
data_format = "json" #you can add another format like XML
topic = "Python" #add your choice of topic here
sig_id = "186640998" # initialise with your sign id, check sample signed key
sig = "6dba1b76011927d40a45fcbd5147b3363ff2af92" # initialise with your sign, check sample signed key
for place in places:
 location = geolocator.geocode(place)
 urls.append("https://api.meetup.com/2/groups?offset=0&format=" + data_format + "&lon=" + str(location.longitude) + "&topic=" + topic + "&photo-host=public&page=500&radius=" + str(radius)+"&fields=&lat=" + str(location.latitude) + "&order=id&desc=false&sig_id=" +sig_id + "&sig=" + sig)
city,country,rating,name,members = [],[],[],[],[]
for url in urls:
 response = urllib.urlopen(url)
 data = json.loads(response.read())
 data=data["results"]

for i in data :
 city.append(i['city'])
 country.append(i['country'])
 rating.append(i['rating'])
 name.append(i['name'])
 members.append(i['members'])

df = pd.DataFrame([city,country,rating,name,members]).T
df.columns=['city','country','rating','name','members']
df.sort(['members','rating'], ascending=[False, False])
freq = df.groupby('country').city.count()
fig = plt.figure(figsize=(8,4))
ax1 = fig.add_subplot(121)
ax1.set_xlabel('Country')
ax1.set_ylabel('Count of Groups')
ax1.set_title("Number of Python Meetup Groups")
freq.plot(kind='bar')
freq = df.groupby('country').members.sum()/df.groupby('country').members.count()
ax1.set_xlabel('Country')
ax1.set_ylabel('Average Members in each group')
ax1.set_title("Python Meetup Groups")
freq.plot(kind='bar')
freq = df.groupby('country').rating.sum()/df.groupby('country').rating.count()
ax1.set_xlabel('Country')
ax1.set_ylabel('Average rating')
ax1.set_title("Python Meetup Groups")
freq.plot(kind='bar')
df=df.sort(['country','members'], ascending=[False,False])
df.groupby('country').head(2)
End Notes
In this article, we looked at the application of python to automate a manual process and the level of precision to find the right Meetup groups. We used API to access information from web and transferred it to a DataFrame. Later, we analysed this information to generate actionable insights.
We can make this application more smart by adding additional information like upcoming events, number of events, RSVP and various other metrics. You can also use this data to carve out interesting insights about community and people. For example, does the RSVP to attendance rate to review rate funnel differ from country to country? Which countries plan their meetups the most in advance?
Give it a try at your end and share your knowledge in the comment section below.
If you like what you just read & want to continue your analytics learning, subscribe to our emails, follow us on twitter or like our facebook page.
I am a Business Analytics and Intelligence professional with deep experience in the Indian Insurance industry. I have worked for various multi-national Insurance companies in last 7 years.


A good use case and it is neatly explained.
Thanks...
Would you be able to proved this same example for R?
A small correction, Sunil: the N is JSON stands for Notation. Also, if I may offer a suggestion, it would be helpful in general (maybe not so much for this example) to also show a sample of the data that we retrieve, e.g. the structure of the JSON document. Otherwise, yet another informative and useful article. :)
Thanks for highlighting and suggestion taken for another topic..
Good Job. Keep it coming!
Thanks
Hi Sunil This looks very interesting. I tried running your scripts and I get the following error: IOError: ('http error', 401, 'Unauthorized', ) at this stage: for url in urls: response = urllib.urlopen(url) data = json.loads(response.read()) data=data["results"] Any ideas why I am getting this? Thanks Lucas
Hi lucas, The indentation in the code is incorrect. Under for loop, code blocks should be indented. In this case, here is how you can write the code: for url in urls: response = urllib.urlopen(url) data = json.loads(response.read()) data=data[“results”]