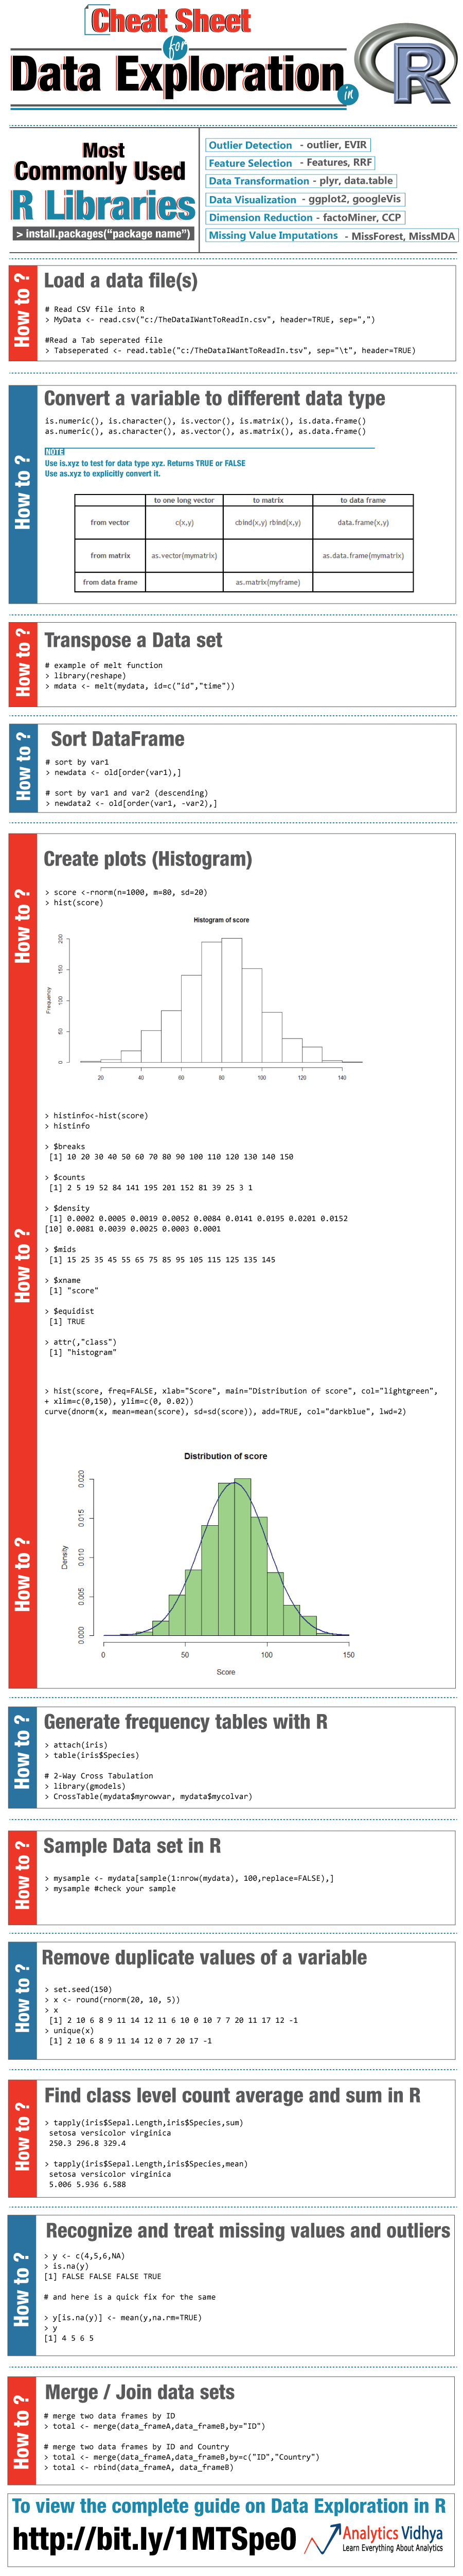
Cheatsheet – 11 Steps for Data Exploration in R (with codes)
Introduction
If you wish to build an impeccable predictive model, trust me, neither any programming language nor any machine learning algorithm can award it to you unless you perform data exploration.
Just like a baby learns to walk before running, every data scientist should learn to explore data prior to getting accustomed to algorithms. Data Exploration has paramount importance in predictive modeling.
Data Exploration not only uncovers the hidden trends and insights, but also allows you to take the first steps towards building a highly accurate model. Considering the popularity of R Programming and its fervid use in data science, I’ve created a cheat sheet of data exploration stages in R. This cheat sheet is highly recommended for beginners who can perform data exploration faster using these handy codes. All you need to do is, customize the codes according your need.
Note: This Cheat Sheet is also available for Download in PDF version below.


table() doesn't serve the purpose for continuous random variables, hence of limited use!!!
Awesome information.
In "how to generate frequency tables", there is no need to subset the iris data set with "iris$..." if you attached it.
The commands to sort a data.frame should be as following if var1 and var2 are its columns newdata <- old[with(old, order(var1)),] newdata2 <- old[with(old, order(var1, -var2)),]
I have registered for this site and want to download the data exploration guide but my login has not been approved yet - very frustrating.
Hi Kevin, Sincere apologies for the inconvenience caused. Your login has been approved. Best, Manish
But why is generating distributions from the mean and SD important in Data Prep, when we have to work on actual data. Couldnt get that part, could you pls explain. The rnorm you are using will only generate random samples from given mean and SD but how is that useful?