Beginner’s guide to Design of Experiments (with case study on banner advertisement)
Introduction
When you visit a supermarket, you might feel overwhelmed with the discounts and free gifts that you get with your purchase. Have you ever imagined, what makes a company decide if you will be excited more by ‘discounts’ or ‘free gift’? How could they even know about you so closely?
As analytics capabilities continue to evolve across businesses and geographies, it has been observed that marketing managers expect analytics departments to provide insights into numerous questions such as “Do our customers love a free gift more than a discount?” “Do our customers respond to advertising that contain the picture of a sports icon?” so on and many more…
It requires an analyst to delve deep into the data to find these answers, using all the available tools and techniques. But, what if we do not have the data? If the company has never leveraged a popular personality for advertising or if it has never offered a free gift, then how will data help us answer the question?
A situation where relevant data remains unavailable is quite common these days. When encountered with such a situation, we either take help of expert judgment, or try to identify suitable proxies or “ask the customer”. Once we execute the latter, we obtain the relevant data required to answer the question of interest. The process of “asking the customer” entails performing experiments or tests where one is able to read the result and obtain answers for the questions of interest.

The Concept of Testing (A/B, Split-Run, Flip-Flop and Test vs. Control)
A/B testing, split-run testing or tests vs. control comparisons are common methodologies that are adopted to understand the impact of single factor on customer behaviour.
Split – Run Testing
In order to test the effectiveness of a marketing communication (mostly print advertisement), one can either use a “split-run” testing or a “flip-flop” testing. Split-run testing is by far the most effective way of testing a print advertisement. For running a “split-run” testing, two different versions of the same advertisement, each with a different identification number, are placed in the publication as a split insertion on the same date.
This will ensure that exactly half of the publications will carry version one of the advertisement and the other half will carry the second version. Hence, the results of the split-run test can be thought of as two advertisements run on a random sample of the publication. The way the advertisements are inserted ensures that the samples are absolutely random in every respect. A very similar concept can be used for testing website banner advertisements as well.
Flip-Flop Testing
In a case, where a magazine does not offer the flexibility of running a split-run campaign but has a separate regional publication for various regions, then one can use the region-1 publication for one version of the advertisement and the region-2 publication for another. This form of testing is called flip-flop testing. It is an approximation of a split-run testing. The biggest shortcoming of this testing is that the two samples are not random and hence, there can be an inherent regional bias in the test results.
Test vs. Control
A control group is defined as a group of customers which are identical to the customers and eligible for a campaign or any other targeted marketing action. However, they are not subjected to any action under consideration. The behaviour of customers in the control group is compared with the behaviour of customers who are subjected to the marketing action. This comparison provides a good understanding of the impact of the marketing action in question.
Problems with Traditional Testing
The testing methodologies mentioned above provide robust answers for incremental impact of a single marketing intervention (or factor) one at a time. Then, what about the situation when the factors are too many in number?
In such case, one needs to conduct a large number of tests to ascertain the impact of each intervention (or factor). As we know, it takes significant amount of time and money to read and infer the results of a test, thus it is advisable that one should test the impact of multiple factors, do something different so as to ensure that one can generate all the required learnings within the limited budget that is available. What does one need to do differently? Let’s find out using an example.
Hence, in case one needs to test the impact of multiple factors, one needs to do something different so as to ensure that one can generate all the required learnings within the limited budget that is available. What does one need to do differently? Let’s find out using an example discussed in following sections.
The Concept of Design of Experiments
Marketers often need to test the impact of a wide range of targeting, advertising, promotion, pricing and product options to find out optimal combination of factors and obtain all the desired results at the minimum possible cost.
As marketing budget is always limited, it becomes impossible to test all combinations of every marketing parameter. Therefore, marketers often build a testing framework which helps them in identifying the critical few learning that they would like to derive out of the available test budget. In many cases, the concept of design of experiments is widely used in building the testing framework.
Design of experiments or DoE is a common analytical technique implemented to design the right testing framework. To illustrate the use of design of experiments, let’s begin with web banner advertising.
There are multiple factors which affect the successes of a banner advertisement. It is important to quantify the “success metric” for a banner advertisement. The most common success metric that is used is called the Click Through Rate (CTR). Click through rate is a very simple metric which is calculated as: Number of visitors clicking the link in the advertisement divided by the number of visitors who are exposed to the advertisement.
The success of a banner advertisement depends on numerous factors such as: website where the advertisement is displayed (possibly the most important), content of the advertisement, the placement of the advertisement etc. With available combination of advertising variables, the concepts of DoE can be very accurately applied and measured in this scenario.
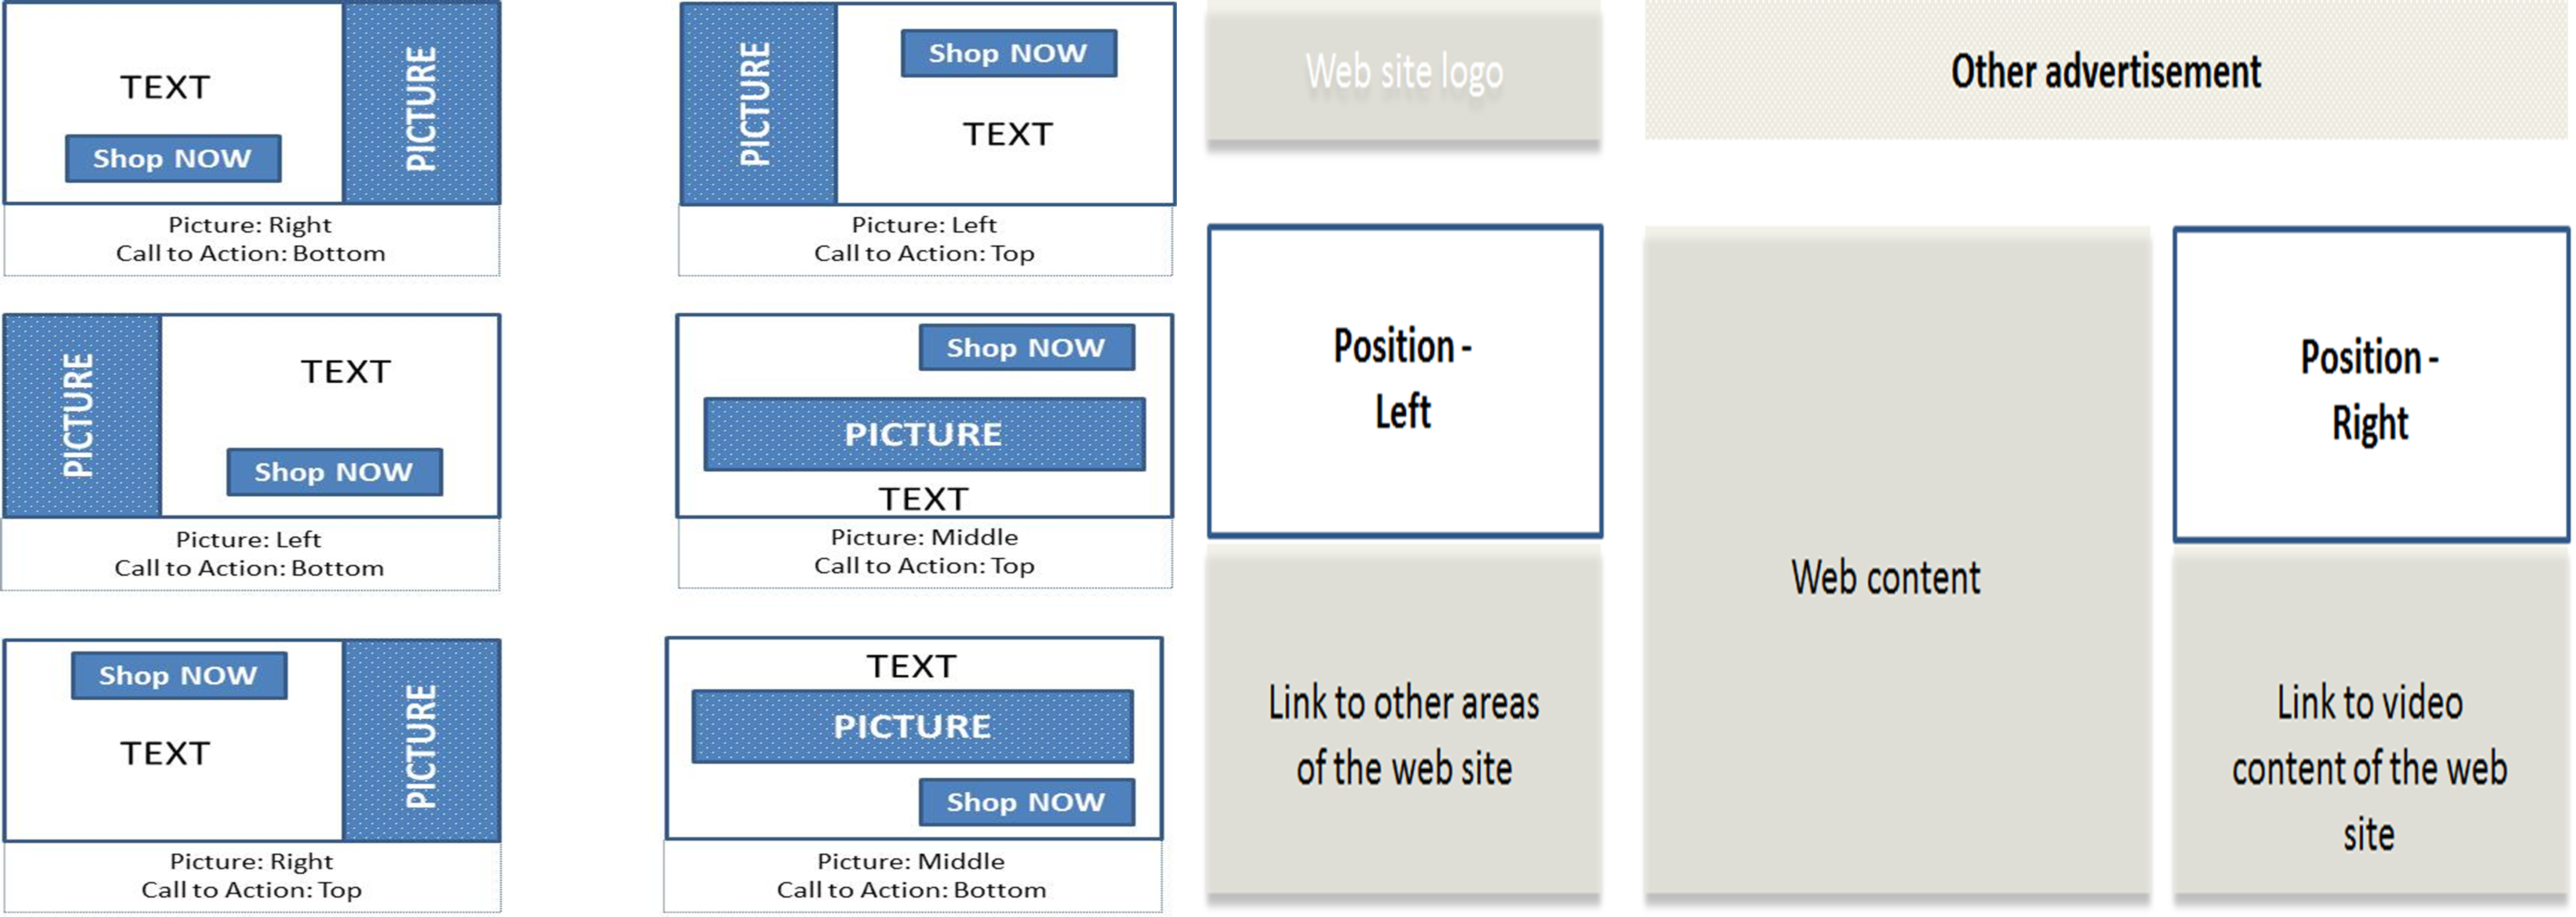
Enough of theory I guess, let’s understand this concept practically now! For simplicity, I’ve consider an advertisement, which consists of the following features:
- A picture
- A text message about the offer and product
- A redirect link(which takes to the landing page of advertiser). This is ‘Call to Action’ Link.
This example involves the following parameters.
- Position of the picture: Left, Right, Middle
- Position of the Call to Action link: Top and Bottom
- Presence of animation or movement in the picture: Yes, No
- Position of the banner advertisement on the web page: Left and Right
The parameters (mentioned above) are also referred to as factors. The values that a parameter or factor takes is often referred to as levels or attributes. For example “Position of the picture” is a parameter or factor, and the values that it takes i.e. “Left”, “Right” and “Middle” are levels/attributes.
Figure-1 illustrates the combinations (other than the presence or absence of animation).
Figure-1: Depiction of the parameters of banner advertisement
In order to ascertain the effectiveness of all these components, it is critical to conduct experiments where visitors are exposed to all possible combinations shown above and the effect of the same is measured on the click through rate.
Table-1 depicts the total possible combinations. The cells marked in grey are the ones which take a value of zero for that particular combination. For example:
- The combination C1 involves:
- Position of picture: left
- Position of call to action link: top
- Presence of animation: yes
- Position on website: left
Table-1: All possible combinations of the parameters
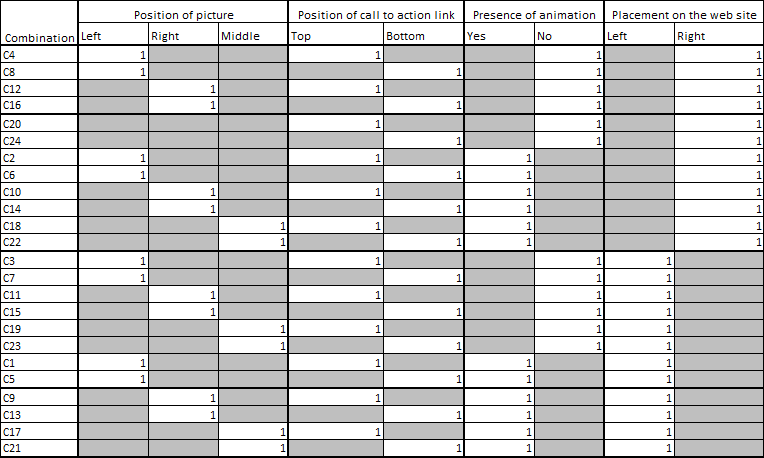
It can be observed that, there are 3 possible positions of the picture, 2 possible positions of the call to action link, 2 configurations with regards to animation (presence or absence) and 2 possible placements on the web site (left or right). Hence there will be 3*2*2*2 = 24 combinations that one could have; this is a large number of possible combinations to explore individually.
Marketers have used the concept of design of experiments to limit the number of combinations (out of the set of all possible combinations) which needs to be tested to make meaningful inferences. To understand, how design of experiments can help one in limiting the number of combinations that need to be tested, one needs to understand the effects of each attribute or level separately and the effect of these attributes acting in tandem.
Design of Experiments without Interaction Effects
The levels of a particular parameter or factor are used as variables for constructing the response function for each combination listed in Table-1. For example the factor “Position of picture” comprises of 3 levels. Therefore, due to degree of freedom constraints, it would require two variables to construct the response equation; any two of the levels can be used as binary variables. In case of position, one can use “Left” and “Right” as two binary variables. If the picture position is on the left then the binary variable “Left” takes the value of 1 otherwise it takes the value of 0. If the picture position is on the right then the binary variable “Right” takes the value of 1, otherwise it takes the value of 0. If the picture position is in the middle, then both the variables “Left” and “Right” takes the value 0.
Similarly, I could use 1 variable each for the other parameters (as all the other parameters consists of two levels each). If one assumes no interaction effect between the factors, then the generic response function can be written as:
Ln(CTR/(1-CTR)) = α + β1(Position of picture is left) + β2(Position of picture is right) + β3(Position of call to action link is top) + β4(Presence of animation is yes) + β5(Placement on web site is left)
In this expression “CTR” represents the probability of response or click through rate. β’s represent the effect of each attribute or level on probability of response.
Based on past experience, it has been found that in most cases, responses can be predicted by using a logistic function. The generic response function needs to be applied to each design combination. The resulting function for each design combination is depicted in Table-2.
Table-2: The Response Equation for all Possible Combinations of the Parameters
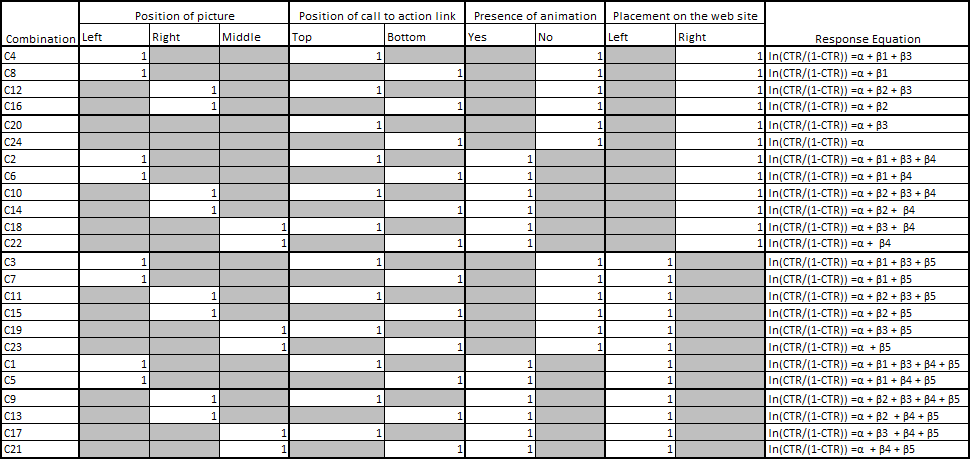
From the table, it can be observed that if one tests combination C4 (ln(CTR4/(1-CTR4))=α+β1 +β3 ) and C23 (ln(CTR23/(1-CTR23))=α +β5), then one could easily estimate the click through rate for combination C3 (ln(CTR3/(1-CTR3))=α+β1 +β3 +β5). It can be seen that:
(ln(CTR4/(1-CTR4) ) + (ln(CTR23/(1-CTR23) ) = (ln(CTR3/(1-CTR3) )
This feature is the key benefit of a properly designed experiment or test. By performing limited number of tests, it is possible to infer the results of some combinations, which have not been tested.
A case, where one tests all the combinations involved is referred to as “full factorial design”. On the other hand, as mentioned above, if the marketer is able to eliminate certain combinations, and test a limited set of combinations, then the same is referred to as “partial factorial design”
Table-3 illustrates how a limited set of experiments that can be used to compute all the required test results.
Table-3: The Partial Factorial Design
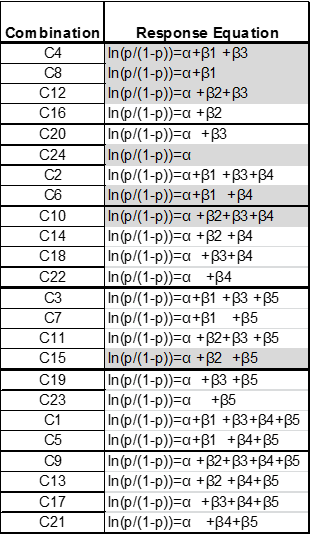
The analytical objective involves estimating the coefficients α, β1, β2, β3, β4, β5. The following combinations can be used to estimate the coefficients:
- Estimating α: If one has results of experiment C24 one will be able to ascertain the value of α
- Estimating β3: If one has the results of C4 and C8 then one can obtain the value of β3.
- Estimating β2: If one has the results of experiment C12 then one can plug in the values of α and β3 to obtain β2
- Estimating β4: If one has the result of C10 one could use the values of α β2 and β3 to obtain β4
- Estimating β1: The value of β4 can then be plugged into the result of C6 to obtain β1
- Estimating β5: The value of β5 can be obtained by plugging in the value of β2 into the result of experiment C15
It can be observed that by conducting only 7 experiments (C4, C8, C12, C14, C6, C10 and C15), one can obtain all the information that can be obtained by conducting 24 experiments. Hence, the concept of design of experiments has used to reduce the experiments from 24 to 7.
The property mentioned above, is the major benefit of partial factorial design where one can obtain the required learning without conducting all the possible experiments. However, as mentioned earlier, this approach assumes that there exists no interaction between the factors. It will be a worthwhile exercise to find out the minimum number of experiments that one will have to perform if presence of interaction is considered.
Design of Experiments with Interaction Effects
As a critic of the partial factorial approach, one could argue that the combination of an animation and placement of the advertisement to the right of the website would be more effective in conjunction, because most viewers tend to focus on the right side of the screen. This implies that the interaction between placement and animation needs to be taken into account. Hence the generic response function would take the following form:
Ln(CTR/(1-CTR)) = α + β1(Position of picture is left) + β2(Position of picture is right) + β3(Position of call to action link is top) + β4(Presence of animation is yes) + β5(Placement on web site is left) + β10(Placement on web site is left & Presence of animation)
It would be worthwhile to find out the minimum number of experiments that one will have to conduct if one assumes the presence of interaction effects. It can be easily seen, that it is difficult to limit the number of experiments or tests that needs to be conducted if there are significant number of interactions.
To generate the maximum learning from any test program, it is best to adopt a full factorial test design whereby all the possible combinations are tested. However, because of cost constraints a partial factorial design is often favoured. While adopting a partial factorial design, appropriate assumptions about interaction effects need to be put into place to limit the number of experiments that one needs to conduct.
Based on prior business knowledge one can eliminate certain interactions, thereby reducing the number of tests that should be performed. In this case, if one assumes that the only interaction effect that exists is between the placement of the advertisement and animation, then it will be interesting to find out the number of tests that needs to be conducted to estimate all the coefficients involved.
End Notes
In this article, I’ve elaborated the concept used behind Design of Experiments. By now, you would have got an intuition about the strategies that companies use to decide the best mode of advertisement for them. Earlier, companies use to face too much trouble in deriving positive returns on marketing budget, but this technique has not only saved million of hard cash, but has also provided a prudent method to reap benefits intelligently.
Did you find this article useful? Have you ever made use of this concept at work? What was your experience? I’ll be happy to hear from you in the comments section below.
About the Authors
Sandhya Kuruganti and Hindol Basu are authors of a book on business analytics titled “Business Analytics: Applications to Consumer Marketing”, recently published by McGraw Hill. The book is available on Flipkart and Amazon India/UK/Canada. They are seasoned analytics professionals with a collective industry experience of more than 30 years.


I think we can also get the values of α, β1, β2, β3, β4, β5 through C24, C8, C16, C20, C22 and C23. So instead 7 combinations we can run 6 combinations. Correct me if i am wrong.
Very good introductory level article. - Partial or full factor approach, the basic idea is to reduce the click-response matrix to some sparse form for computational efficiency. Right? - I don’t quite follow the degrees of freedom constraint. "For example the factor “Position of picture” comprises of 3 levels. Therefore, due to degree of freedom constraints, it would require two variables to construct the response equation; any two of the levels can be used as binary variables." I still would have to have a beta for all features? I don’t understand how one can simply ignore one of three levels from the equation? Could you elaborate?
Even though I was reading about DoE for the first time, I had no difficulty understanding the concept and the science behind the process. Thank you so much for making learning accessible with ease of understanding.