Clustering | Different Methods, and Applications (Updated 2024)
Introduction
When encountering an unsupervised learning problem initially, confusion may arise as you aren’t seeking specific insights but rather identifying data structures. This process, known as clustering or cluster analysis, identifies similar groups within a dataset.
It is one of the most popular clustering techniques in data science used by data scientists. Entities in each group are comparatively more similar to entities of that group than those of the other groups. In this article, I will be taking you through the types of clustering, different clustering algorithms, and a comparison between two of the most commonly used methods of clustering in machine learning.
Note: To learn more about clustering and other machine learning algorithms (both supervised and unsupervised) check out the following courses-
Learning Objectives
- Learn about Clustering in machine learning, one of the most popular unsupervised classification techniques.
- Get to know K means and hierarchical clustering and the difference between the two.
Table of contents
- What Is Clustering in Machine Learning?
- Types of Clustering in Machine Learning
- Different Types of Clustering Algorithms
- K Means Clustering
- Hierarchical Clustering
- Difference Between K Means and Hierarchical Clustering
- Applications of Clustering
- Improving Supervised Learning Algorithms With Clustering
- Frequently Asked Questions
What Is Clustering in Machine Learning?
Clustering is the task of dividing the unlabeled data or data points into different clusters such that similar data points fall in the same cluster than those which differ from the others. In simple words, the aim of the clustering process is to segregate groups with similar traits and assign them into clusters.
Let’s understand this with an example. Suppose you are the head of a rental store and wish to understand the preferences of your customers to scale up your business. Is it possible for you to look at the details of each customer and devise a unique business strategy for each one of them? Definitely not. But, what you can do is cluster all of your customers into, say 10 groups based on their purchasing habits and use a separate strategy for customers in each of these 10 groups. And this is what we call clustering.
Now that we understand what clustering is. Let’s take a look at its different types.
Types of Clustering in Machine Learning
Clustering broadly divides into two subgroups:
- Hard Clustering: Each input data point either fully belongs to a cluster or not. For instance, in the example above, every customer is assigned to one group out of the ten.
- Soft Clustering: Rather than assigning each input data point to a distinct cluster, it assigns a probability or likelihood of the data point being in those clusters. For example, in the given scenario, each customer receives a probability of being in any of the ten retail store clusters.
Different Types of Clustering Algorithms
Since the task of clustering is subjective, the means that can be used for achieving this goal are plenty. Every methodology follows a different set of rules for defining the ‘similarity’ among data points. In fact, there are more than 100 clustering algorithms known. But few of the algorithms are used popularly. Let’s look at them in detail:
Connectivity Models
As the name suggests, these models are based on the notion that the data points closer in data space exhibit more similarity to each other than the data points lying farther away. These models can follow two approaches. In the first approach, they start by classifying all data points into separate clusters & then aggregating them as the distance decreases. In the second approach, all data points are classified as a single cluster and then partitioned as the distance increases. Also, the choice of distance function is subjective. These models are very easy to interpret but lack scalability for handling big datasets. Examples of these models are the hierarchical clustering algorithms and their variants.
Centroid Models
These clustering algorithms iterate, deriving similarity from the proximity of a data point to the centroid or cluster center. The k-Means clustering algorithm, a popular example, falls into this category. These models necessitate specifying the number of clusters beforehand, requiring prior knowledge of the dataset. They iteratively run to discover local optima.
Distribution Models
These clustering models are based on the notion of how probable it is that all data points in the cluster belong to the same distribution (For example: Normal, Gaussian). These models often suffer from overfitting. A popular example of these models is the Expectation-maximization algorithm which uses multivariate normal distributions.
Density Models
These models search the data space for areas of the varied density of data points in the data space. They isolate different dense regions and assign the data points within these regions to the same cluster. Popular examples of density models are DBSCAN and OPTICS. These models are particularly useful for identifying clusters of arbitrary shape and detecting outliers, as they can detect and separate points that are located in sparse regions of the data space, as well as points that belong to dense regions.
Now I will be taking you through two of the most popular clustering algorithms in detail – K Means and Hierarchical. Let’s begin.
K Means Clustering
K means is an iterative clustering algorithm that aims to find local maxima in each iteration. This algorithm works in these 5 steps:
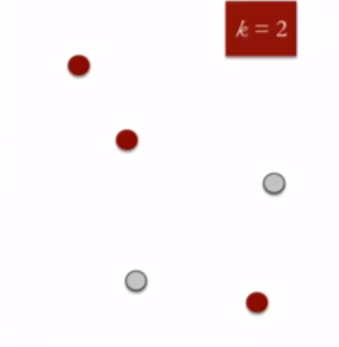
1. Specify the desired number of clusters K: Let us choose k=2 for these 5 data points in 2-D space.

2. Randomly assign each data point to a cluster: Let’s assign three points in cluster 1, shown using red color, and two points in cluster 2, shown using grey color.
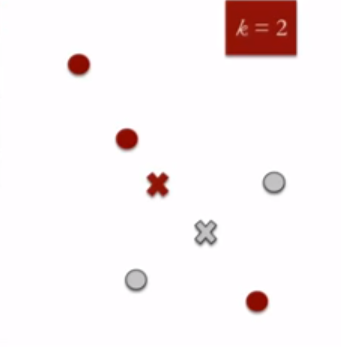
3. Compute cluster centroids: The centroid of data points in the red cluster is shown using the red cross, and those in the grey cluster using a grey cross.
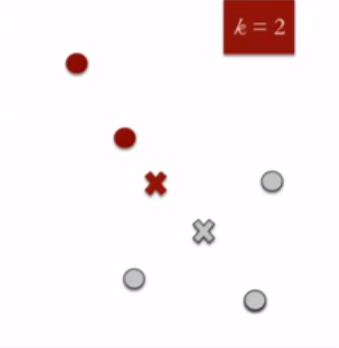
4. Re-assign each point to the closest cluster centroid: Note that only the data point at the bottom is assigned to the red cluster, even though it’s closer to the centroid of the grey cluster. Thus, we assign that data point to the grey cluster.
5. Re-compute cluster centroids: Now, re-computing the centroids for both clusters.
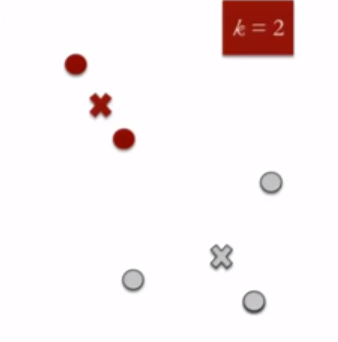
Repeat steps 4 and 5 until no improvements are possible: Similarly, we’ll repeat the 4th and 5th steps until we’ll reach global optima, i.e., when there is no further switching of data points between two clusters for two successive repeats. It will mark the termination of the algorithm if not explicitly mentioned.
Here is a live coding window where you can try out K Means Algorithm using the scikit-learn library.
Hierarchical Clustering
Hierarchical clustering, as the name suggests, is an algorithm that builds a hierarchy of clusters. This algorithm starts with all the data points assigned to a cluster of their own. Then two nearest clusters are merged into the same cluster. In the end, this algorithm terminates when there is only a single cluster left.
The results of hierarchical clustering can be shown using a dendrogram. The dendrogram can be interpreted as:
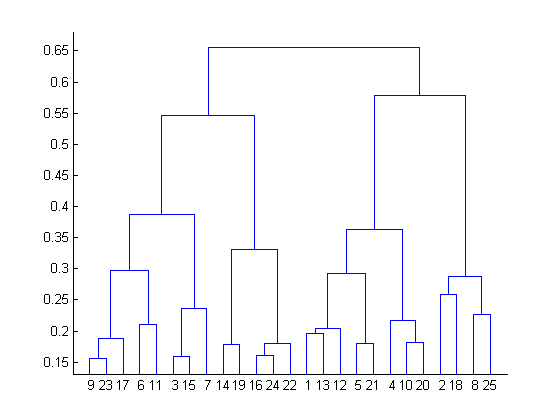
At the bottom, we start with 25 data points, each assigned to separate clusters. The two closest clusters are then merged till we have just one cluster at the top. The height in the dendrogram at which two clusters are merged represents the distance between two clusters in the data space.
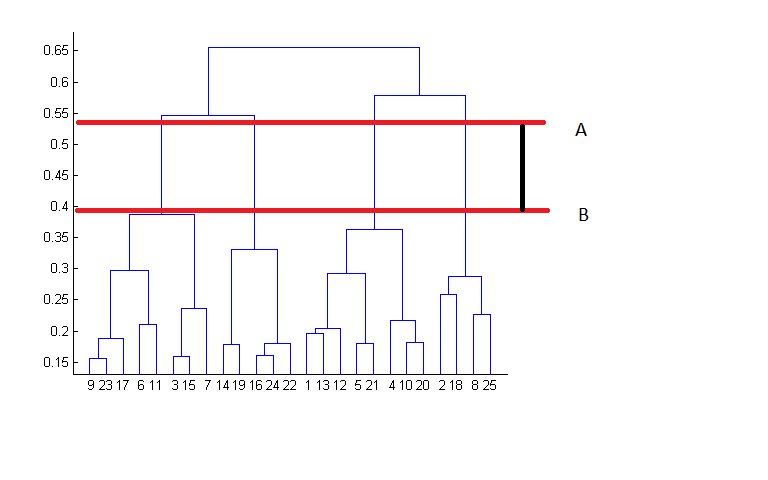
The decision of the no. of clusters that can best depict different groups can be chosen by observing the dendrogram. The best choice of the no. of clusters is the no. of vertical lines in the dendrogram cut by a horizontal line that can transverse the maximum distance vertically without intersecting a cluster.
In the above example, the best choice of no. of clusters will be 4 as the red horizontal line in the dendrogram below covers the maximum vertical distance AB.
Important Points for Hierarchical Clustering
- This algorithm has been implemented above using a bottom-up approach. It is also possible to follow a top-down approach starting with all data points assigned in the same cluster and recursively performing splits till each data point is assigned a separate cluster.
- The decision to merge two clusters is taken on the basis of the closeness of these clusters. There are multiple metrics for deciding the closeness of two clusters:
- Euclidean distance: ||a-b||2 = √(Σ(ai-bi))
- Squared Euclidean distance: ||a-b||22 = Σ((ai-bi)2)
- Manhattan distance: ||a-b||1 = Σ|ai-bi|
- Maximum distance:||a-b||INFINITY = maxi|ai-bi|
- Mahalanobis distance: √((a-b)T S-1 (-b)) {where, s : covariance matrix}
Difference Between K Means and Hierarchical Clustering
- Hierarchical clustering can’t handle big data well, but K Means can. This is because the time complexity of K Means is linear, i.e., O(n), while that of hierarchical is quadratic, i.e., O(n2).
- Since we start with a random choice of clusters, the results produced by running the algorithm multiple times might differ in K Means clustering. While in Hierarchical clustering, the results are reproducible.
- K Means is found to work well when the shape of the clusters is hyperspherical (like a circle in 2D or a sphere in 3D).
- K Means clustering requires prior knowledge of K, i.e., no. of clusters you want to divide your data into. But, you can stop at whatever number of clusters you find appropriate in hierarchical clustering by interpreting the dendrogram.
Applications of Clustering
Clustering has a large no. of applications spread across various domains. Some of the most popular applications of clustering are recommendation engines, market segmentation, social network analysis, search result grouping, medical imaging, image segmentation, and anomaly detection.
Improving Supervised Learning Algorithms With Clustering
Clustering is an unsupervised machine learning approach, but can it be used to improve the accuracy of supervised machine learning algorithms as well by clustering the data points into similar groups and using these cluster labels as independent variables in the supervised machine learning algorithm? Let’s find out.
Let’s check out the impact of clustering on the accuracy of our model for the classification problem using 3000 observations with 100 predictors of stock data to predict whether the stock will go up or down using R. This dataset contains 100 independent variables from X1 to X100 representing the profile of a stock and one outcome variable Y with two levels: 1 for the rise in stock price and -1 for drop in stock price.
The dataset is available here: Download
Let’s first try applying random forest without clustering in python.
#loading required librarieslibrary('randomForest')
library('Metrics')
#set random seedset.seed(101)
#loading dataset
data<-read.csv("train.csv",stringsAsFactors= T)
#checking dimensions of datadim(data)
## [1] 3000 101
#specifying outcome variable as factor
data$Y<-as.factor(data$Y)
#dividing the dataset into train and testtrain<-data[1:2000,]
test<-data[2001:3000,]
#applying randomForest model_rf<-randomForest(Y~.,data=train)
preds<-predict(object=model_rf,test[,-101])
table(preds)
## preds
## -1 1
## 453 547
#checking accuracy
auc(preds,test$Y)
## [1] 0.4522703So, the accuracy we get is 0.45. Now let’s create five clusters based on values of independent variables using k-means and reapply random forest.
#combing test and train

all<-rbind(train,test)

#creating 5 clusters using K- means clustering

Cluster <- kmeans(all[,-101], 5)

#adding clusters as independent variable to the dataset.all$cluster<-as.factor(Cluster$cluster)

#dividing the dataset into train and testtrain<-all[1:2000,]
test<-all[2001:3000,]

#applying randomforestmodel_rf<-randomForest(Y~.,data=train)

preds2<-predict(object=model_rf,test[,-101])

table(preds2)

## preds2

## -1   1

##548 452

auc(preds2,test$Y)

## [1] 0.5345908
Whoo! In the above example, even though the final accuracy is poor but clustering has given our model a significant boost from an accuracy of 0.45 to slightly above 0.53.
This shows that clustering can indeed be helpful for supervised machine-learning tasks.
Conclusion
In this article, we have discussed the various ways of performing clustering. We came across applications for unsupervised learning in a large no. of domains and also saw how to improve the accuracy of a supervised machine learning algorithm using clustering.
Although clustering is easy to implement, you need to take care of some important aspects, like treating outliers in your data and making sure each cluster has a sufficient population. These aspects of clustering are dealt with in great detail in this article.
Key Takeaways
- Clustering helps to identify patterns in data and is useful for exploratory data analysis, customer segmentation, anomaly detection, pattern recognition, and image segmentation.
- It is a powerful tool for understanding data and can help to reveal insights that may not be apparent through other methods of analysis.
- Its types include partition-based, hierarchical, density-based, and grid-based clustering.
- The choice of clustering algorithm and the number of clusters to use depend on the nature of the data and the specific problem at hand.
Frequently Asked Questions
A. Agglomerative clustering is a popular data mining technique that groups data points based on their similarity, using a distance metric such as Euclidean distance. Different distance measures can be used depending on the type of data being analyzed. It is a bottom-up approach that merges similar clusters iteratively, and the resulting hierarchy can be represented as a dendrogram.
A. DBSCAN (density-based spatial clustering of applications) has several advantages over other clustering algorithms, such as its ability to handle data with arbitrary shapes and noise and its ability to automatically determine the number of clusters. It is also computationally efficient and can scale to large datasets.
A. A hierarchical clustering structure is a type of clustering structure that forms a tree-like structure of clusters, with the individual data points at the bottom and the root node at the top. It can be further divided into agglomerative and divisive hierarchical clustering.
Saurav is a Data Science enthusiast, currently in the final year of his graduation at MAIT, New Delhi. He loves to use machine learning and analytics to solve complex data problems.


Very nice tutorial Saurav!
Good to see you liked it. Thank you!
Nice, post! Please correc the last link - it is broken - thanks!
Hi, Richard. Glad you liked it ! Thanks for pointing out. Its fixed now!
I accept that clustering may help in improving the supervised models. But here in the above: Clustering is performed on sample points (4361 rows). Is that right.? But I think correct way is to cluster features (X1-X100) and to represent data using cluster representatives and then perform supervised learning. Can you please elaborate further? Why samples are being clustered in the code (not independent variables)?
Hey, Sai. So, Yes. I have clustered the observations ( or rows, 3000 in total). Consider all these data points ( observations) in data space with all the features (x1-x100) as dimensions. What I'm doing is to cluster these data points into 5 groups and store the cluster label as a new feature itself. Clustering the 100 independent variables will give you 5 groups of independent variables. Going this way, how exactly do you plan to use these cluster labels for supervised learning?
Nice article! How would you handle a clustering problem when there are some variables with many missing values (let's say...around 90% of each column). These missing values are not random at all, but even they have a meaning, the clustering output yields some isolated (and very small) groups due to these missing values. Thanks in advance!
Hi Luis. Thanks. 1. Since the missing values are as high as 90%, you can consider dropping these variables. 2. As you said, these missing values are not completely meaningless, try imputing them (might not yield good results with this high percentage of missing values.) 3. If the pattern in missing values is something like say… values are missing because students didn’t took a certain test otherwise that column contains the scores of that test. You can try replacing the variable with another variable having 0 for missing values and 1 for some valid value.
Hello Saurav, Your article and related explanation on clustering and the two most used methods was very insightful. However, please do enlighten us by telling how does one interpret cluster output for both these methods - K-means and Hierarchical. Also, it would be nice if you could let the reader know when could one use K-means versus say something like K-median. In what scenario does the former work and in which one does the latter??? It would also be a great idea to: 1. Discuss the ways to implement a density based algorithm and a distribution based one 2. Maybe show an actual example of market segmentation You have done a good job of showing how clustering could in sense preclude a following classification method but if the problem is such that it is only limited to clustering, then how would you explain the output to an uninitiated audience? Maybe some thoughts for your second article in the clustering article. But great job. I enjoyed reading your piece.
Hi Kunal, I'm happy that you liked the article. Actually, clustering is a very wide topic to be completely covered in a single article. For some of the things that you mentioned like when to use which method out of two , you can refer to differences between two. For interpretation of Clusters formed using say Hierarchical clustering is depicted using dendrograms. Apart from these, things like using density based and distribution based clustering methods, market segmentation could definitely be a part of future articles on clustering. Thank you for your thoughts.
Also Saurav, It might be a good idea to suggest which clustering algorithm would be appropriate to use when: 1. All variables are continuous 2. All variables are categorical - many times this could be the case 3. All variables are count - maybe sometimes 4. A mix of continuous and categorical - this could be possibly the most common 5. Similarly a mix of continuous, categorical and count To be more precise, if I had one or more scenarios above, and was using a distance based method to calculate distances between points, what distance calculation method works where. Any insights would be great!!
So, to understand this, its important to understand how categorical variables behave in clustering. If the levels of your categorical variables are in sequence like : Very bad, bad, Average, Good, Very Good. You can try encoding labels say with 0,1,2,3 and 4 respectively. If there is no sequence in levels like : red, green and orange , you can try one hot encoding. Also, there is no one definite best distance metric to cluster your data. It depends on various factors like the ones you mentioned : type of variables. Also, things like the scales of variables , no. of clusters you want are important while deciding the best distance metric.
Hi Saurav, Since we are classifying assets in this tutorial, don't you think corelation based distance should give us better results than eucledian distances (which k-means normally uses)?
Hi Nikunj, Intuitively speaking, its definitely worth a shot. Good suggestion.
Hi It 's a good post on covering a broad topic like Clustering. However, I'm not so convinced about using Clustering for aiding Supervised ML. For me, Clustering based approaches tend to be more 'exploratory' in nature to understand the inherent data structure, segments et al. Dimensionality Reduction techniques like PCA are more intuitive approaches (for me) in this case, quite simple because you don't get any dimensionality reduction by doing clustering and vice-versa, yo don't get any groupings out of PCA like techniques. my distinction of the two, PCA is used for dimensionality reduction / feature selection / representation learning e.g. when the feature space contains too many irrelevant or redundant features. The aim is to find the intrinsic dimensionality of the data. K-means is a clustering algorithm that returns the natural grouping of data points, based on their similarity. I'd like to point to the excellent explanation and distinction of the two on Quora : https://www.quora.com/What-is-the-difference-between-factor-and-cluster-analyses my question to you how would you fit / cluster the same groupings (you obtained out of clustering the training set) onto a unseen test set? or would you apply clustering to it again? typically, you perform PCA on a training set and apply the same loadings on to a new unseen test set and not fit a new PCA to it..
Really nice article Saurav , this helped me understand some of the basic concepts regarding clustering. I was hoping if you can post similar articles on Fuzzy, DBSCAN, Self Organizing Maps. Aditya
Hi Saurav Kaushik, I am new to this area, but I am in search of help to understand it deeper. One of my personal projects involves analysing data for creating a "predictive model" based on some information collected about previous historical data which I have in a spreadsheet (or in .txt file if it is bette). Could you recommend a simple package (in Python or in Delphi) that can help me do something like this? My spreadsheet has (for example), 1500 lines which represent historical moments (Test 1, Test2...Test1500). On the columns, I have the Labels and Values for each of 1000 characteristics I analyse separately at each Test. What I would like to do with this? To be able to "predict" some 10 ou 20 values for 10 or 20 characteristics for the next Test1501. Do you think it is possible? If you are involved in this kind of project, what would it cost me to have your help in building a tool for doing that? I can send you an example file, if you would be interested in helping me. My direct contact : dixiejoelottolex at gmail dot com
Hi and thank you for your article. Running your example I am running in a series of issues. The first one being the result of preds<-predict(object=model_rf,test[,-101]) head(table(preds)) preds -0.192066666666667 -0.162533333333333 -0.120533333333333 -0.0829333333333333 -0.0793333333333333 1 1 1 1 1 -0.079 1 Then auc(preds,test$Y) [1] NaN The second exemple with the added cluster produces the same result. Any idea why my result is so different than yours?
Hey Laurent, 1. Make sure your outcome variable in categorical and so are your predictions. 2. Make sure you have loaded the Metrics package as auc() is the function defined in that package. Hope this will resolve your query.
Hey Saurav, Could you please give a code for Python? Thanks
Hi Saurav, In the last section, where you calculate Area under ROC (auc), the syntax seems incorrect. The syntax mentioned for auc in help is : auc(actual , predicted) whereas you have taken auc(predicted, actual). Thanks, Hitesh
Hi Saurav I am new to this area and want to further look into it. Can you tell me how to include the package metaviz in R?
Thank you so much for such a beautiful lesson. This was the first time I was trying to understand Clustering and I have nailed it, Thanks to you!
Hi, can K means be applied on Geo coordinates I have a data on 100 locations (lat Long) which i have to group in 10 clusters and assign each cluster to a person and also identify a central location frm where this person operates. query 1 : can i use k means on geo coordinates to form clusters query 2: centroids are the means of the clusters, so these can be different than the actual observation values. how do i find out actual observation closest to centroid
Hi Saurav, It is Good for understanding but add the elbow method
Your auc improves because clusters are created using all the data so when you fit your model on the augmented training set you are implicitly including an information (the clustering labels) correlated with the response variable in the test set.
Nice Article ! Much appreciation to the author. But, I am wondering we are running cluster in the over all data and then dividing the dataset in training and testing. No the testing data is not completely unseen to the model developed using training data. Because the clusters in the testing data was designed with the help of training data and model knows what to map to cluster 1,2, 3,..... ! Rather, if we can cluster only basis the training data and then predict the cluster in test data and run the model and still if we get better accuracy we can certainly conclude the same the clustering is enhancing the accuracy. Can you clarify the doubt please ?