40 questions to test your skill on R for Data Science
R is one of the most popular language among the data science community. If you are serious about data science, chances are that you either already know R or are learning it. R also has a thriving ecosystem of various statistics and data science libraries. In order to help our community test themselves on their knowledge of R, we created these skill tests as part of DataFest 2017.
More than 1500 people registered for this skill test and close to 500 people took this test. Below is the distribution of scores from various participants:
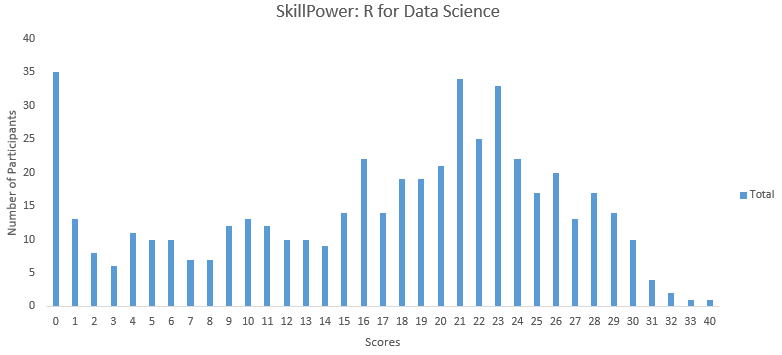
You can access the final scores here. Here are a few statistics about the distribution:
Mean Score: 16.69
Median Score: 19
Mode Score: 0
We are releasing the solutions to the skill tests, so that you can evaluate where you went wrong. If you missed the test, you can still look at the Questions and Answers to see where you stand.
Happy Learning!
Questions & Answers
Question Context 1
Consider the following function.
f <- function(x) {

      g <- function(y) {

             y + z

      }

      z <- 4

      x + g(x)

}
1)If we execute following commands (written below), what will be the output?
z <- 10
f(4)
A) 12
B) 7
C) 4
D) 16
Solution: (A)
Scoping rule of R will cause z<-4 to take precedence over z<-10. Hence, g(x) will return a value of 8. Therefore, option A is the correct answer.
Question context 2
The iris dataset has different species of flowers such as Setosa, Versicolor and Virginica with their sepal length. Now, we want to understand the distribution of sepal length across all the species of flowers. One way to do this is to visualise this relation through the graph shown below.
2) Which function can be used to produce the graph shown above?
A) xyplot()
B) stripplot()
C) barchart()
D) bwplot()
Solution: (B)
The plot above is of type strip whereas the options a, c and d will produce a scatter, bar and box whisker plot respectively. Therefore, option B is the correct solution.
Question Context 3
| Alpha | 125.5 | 0 |
| Beta | 235.6 | 1 |
| Beta | 212.03 | 0 |
| Beta | 211.30 | 0 |
| Alpha | 265.46 | 1 |
File Name – Dataframe.csv
3) Which of the following commands will correctly read the above csv file with 5 rows in a dataframe?
B) csv(‘Dataframe.csv’,header=TRUE)
C) dataframe(‘Dataframe.csv’)
D) csv2(‘Dataframe.csv’,header=FALSE,sep=’,’)
Solution: (D)
Options 1 and 2 will read the first row of the above dataframe as header. Option 3 doesn’t exist. Therefore, option D is the correct solution.
Question Context 4
Excel file format is one of the most common formats used to store datasets. It is important to know how to import an excel file into R. Below is an excel file in which data has been entered in the third sheet.
| Alpha | 125.5 | 0 |
| Beta | 235.6 | 1 |
| Beta | 212.03 | 0 |
| Beta | 211.30 | 0 |
| Alpha | 265.46 | 1 |
File Name – Dataframe.xlsx
4) Which of the following codes will read the above data in the third sheet into a dataframe in R?
B) Xlsx::read.xlsx(“Dataframe.xlsx”,sheetIndex=3,header=FALSE)
C)XLConnect::readWorksheetFromFile(“Dataframe.xlsx”,sheet=3,header=FALSE)
D)All of the above
Solution: (D)
All of the above options are true, as they give out different methods to read an excel file into R and reads the above file correctly. Therefore, option D is the correct solution.
Question Context 5
| A | 10 | Sam | |
| B | 20 | Peter | |
| C | 30 | Harry | |
| D | ! | ? | |
| E | 50 | Mark |
File Name – Dataframe.csv
5) Missing values in this csv file has been represented by an exclamation mark (“!”) and a question mark (“?”). Which of the codes below will read the above csv file correctly into R?
B) csv(‘Dataframe.csv’,header=FALSE, sep=’,’,na.strings=c(‘?’))
C) csv2(‘Dataframe.csv’,header=FALSE,sep=’,’,na.strings=c(‘?’,’!’))
D) dataframe(‘Dataframe.csv’)
Solution: (C)
Option A will not be able to read “?” and “!” as NA in R. option B will be able to read only “?” as NA but not “!”. Option 4 doesn’t exist. Therefore, option C is the correct solution.
Question Context 6-7
| Column 1 | Column 2 | Column 3 | |
| Row 1 | 15.5 | 14.12 | 69.5 |
| Row 2 | 18.6 | 56.23 | 52.4 |
| Row 3 | 21.4 | 47.02 | 63.21 |
| Row 4 | 36.1 | 56.63 | 36.12 |
File Name – Dataframe.csv
6) The above csv file has row names as well as column names. Which of the following code will read the above csv file properly into R?
B) csv2(‘Train.csv’,header=TRUE, row.names=TRUE)
C) dataframe(‘Train.csv’,header=TRUE,sep=’,’)
D) csv(‘Train.csv’,,header=TRUE,sep=’,’)
Solution: (D)
row.names argument in options A and B takes only the vector containing the actual row names or a single number giving the column of the table which contains the row names and not a logical value. Option C doesn’t exist. Therefore, option D is the correct solution.
Question Context 6-7
| Column 1 | Column 2 | Column 3 | |
| Row 1 | 15.5 | 14.12 | 69.5 |
| Row 2 | 18.6 | 56.23 | 52.4 |
| Row 3 | 21.4 | 47.02 | 63.21 |
| Row 4 | 36.1 | 56.63 | 36.12 |
File Name – Dataframe.csv
7) Which of the following codes will read only the first two rows of the csv file?
B) csv2(‘Dataframe.csv’,row.names=1,nrows=2)
C) delim2(‘Dataframe.csv’,header=T,row.names=1,sep=’,’,nrows=2)
D) dataframe(‘Dataframe.csv’,header=TRUE,row.names=1,sep=’,’,skip.last=2)
Solution: (A)
Option B will not be able to read the csv file correctly since the default separator in csv2 function is “;” whereas csv files are of type “,”. Option C has wrong header argument value. Option D doesn’t exist. Therefore, Option A is the correct answer.
Question Context 8
Dataframe1
|
Dataframe2
|
8) There are two dataframes stored Dataframe1 and Dataframe2 shown above. Which of the following codes will produce the output shown below?
| Feature1 | Feature2 | Feature3 |
| A | 1000 | 25.5 |
| B | 2000 | 35.5 |
| C | 3000 | 45.5 |
| D | 4000 | 55.5 |
| E | 5000 | 65.5 |
| F | 6000 | 75.5 |
| G | 7000 | 85.5 |
| H | 8000 | 95.5 |
A) merge(dataframe[,1:3],dataframe2)
B) merge(dataframe1,dataframe2)[,1:3]
C) merge(dataframe1,dataframe2,all=TRUE)
D) Both 1 and 2
E) All of the above
Solution: (D)
Option C will result in feature 4 being included in the merged dataframe which is what we do not want. Therefore, Option D is the correct solution.
Question Context 9
| V1 | V2 | |
| 1 | 121.5 | 461 |
| 2 | 516 | 1351 |
| 3 | 451 | 6918 |
| 4 | 613 | 112 |
| 5 | 112.36 | 230 |
| 6 | 25.23 | 1456 |
| 7 | 12 | 457 |
dataframe
9) A data set has been read in R and stored in a variable “dataframe”. Which of the below codes will produce a summary (mean, mode, median) of the entire dataset in a single line of code?
B) stats(dataframe)
C) summarize(dataframe)
D) summarise(dataframe)
E) None of the above
Solution: (E)
Option A will give only the mean and the median but not the mode. Option B, C and D will also fail to provide the required statistics. Therefore, Option E is the correct solution.
Question Context 10
A dataset has been read in R and stored in a variable “dataframe”. Missing values have been read as NA.
| A | 10 | Sam |
| B | NA | Peter |
| C | 30 | Harry |
| D | 40 | NA |
| E | 50 | Mark |
dataframe
10) Which of the following codes will not give the number of missing values in each column?
B) apply(is.na(dataframe),2,sum)
C) sapply(dataframe,function(x) sum(is.na(x))
D) table(is.na(dataframe))
Solution: (D)
Option D will give the overall count of the missing values but not column wise. Therefore, Option D is the correct solution.
Question context 11
One of the important phase in a Data Analytics pipeline is univariate analysis of the features which includes checking for the missing values and the distribution, etc. Below is a dataset and we wish to plot histogram for “Value” variable.
| Parameter | State | Value | Dependents |
| Alpha | Active | 50 | 2 |
| Beta | Active | 45 | 5 |
| Beta | Passive | 25 | 0 |
| Alpha | Passive | 21 | 0 |
| Alpha | Passive | 26 | 1 |
| Beta | Active | 30 | 2 |
| Beta | Passive | 18 | 0 |
dataframed
11) Which of the following commands will help us perform that task ?
B) ggplot2::qplot(dataframed$Value,geom=”Histogram”)
C)ggplot2::ggplot(data=dataframed,aes(dataframe$Value))+geom_histogram()
D) All of the above
Solution: (D)
All of the given options will plot a histogram and that can be used to see the skewness of the desired data.
Question Context 12
| Parameter | State | Value | Usage |
| Alpha | Active | 50 | 0 |
| Beta | Active | 45 | 1 |
| Beta | Passive | 25 | 0 |
| Alpha | Passive | 21 | 0 |
| Alpha | Passive | 26 | 1 |
| Beta | Active | 30 | 1 |
| Beta | Passive | 18 | 0 |
Certain Algorithms like XGBOOST work only with numerical data. In that case, categorical variables present in dataset are first converted to DUMMY variables which represent the presence or absence of a level of a categorical variable in the dataset. For example After creating the Dummy Variable for the feature “Parameter”, the dataset looks like below.
| Parameter_Alpha | Parameter_Beta | State | Value | Usage |
| 1 | 0 | Active | 50 | 0 |
| 0 | 1 | Active | 45 | 1 |
| 0 | 1 | Passive | 25 | 0 |
| 1 | 0 | Passive | 21 | 0 |
| 1 | 0 | Passive | 26 | 1 |
| 0 | 1 | Active | 30 | 1 |
| 0 | 1 | Passive | 18 | 0 |
12) Which of the following commands will help us to achieve this?
B) dataframe$Parameter_Alpha=0
dataframe$Gende_Beta=0
dataframe$Parameter_Alpha[which(dataframe$Parameter==’Alpha’)]=1
dataframe$Parameter_Beta[which(dataframe$Parameter==’Alpha’)]=0
dataframe$Parameter_Alpha[which(dataframe$Parameter==’Beta’]=0
dataframe$Parameter_Beta[which(dataframe$Parameter==’Beta’]=1
C) contrasts(dataframe$Parameter)
D) Both 1 and 2
Solution: (D)
Option C will encode the Parameter column will 2 levels but will not perform one hot encoding. Therefore, option D is the correct solution.
Question context 13
| Column1 | Column2 | Column3 | Column4 | Column5 | Column6 | |
| Name1 | Alpha | 12 | 24 | 54 | 0 | Alpha |
| Name2 | Beta | 16 | 32 | 51 | 1 | Beta |
| Name3 | Alpha | 52 | 104 | 32 | 0 | Gamma |
| Name4 | Beta | 36 | 72 | 84 | 1 | Delta |
| Name5 | Beta | 45 | 90 | 32 | 0 | Phi |
| Name6 | Alpha | 12 | 24 | 12 | 0 | Zeta |
| Name7 | Beta | 32 | 64 | 64 | 1 | Sigma |
| Name8 | Alpha | 42 | 84 | 54 | 0 | Mu |
| Name9 | Alpha | 56 | 112 | 31 | 1 | Eta |
dataframe
13) We wish to calculate the correlation between “Column2” and “Column3” of a “dataframe”. Which of the below codes will achieve the purpose?
B) (cov(dataframe$column2,dataframe$column3))/(var(dataframe$column2)*sd(dataframe$column3))
C)
(sum(dataframe$Column2*dataframe$Column3)- (sum(dataframe$Column2)*sum(dataframe$Column3)/nrow(dataframe)))/(sqrt((sum(dataframe$Column2*dataframe$Column2)-(sum(dataframe$Column2)^3)/nrow(dataframe))* (sum(dataframe$Column3*dataframe$Column3)-(sum(dataframe$Column3)^2)/nrow(dataframe))))
D) None of the Above
Solution: (D)
In option A, corr is the wrong function name. Actual function name to calculate correlation is cor. In option B, it is the standard deviation which should be the denominator and not variance. Similarly, the formula in Option C is wrong. Therefore, Option D is the correct solution.
Question Context 14
| Parameter | State | Value | Dependents |
| Alpha | Active | 50 | 2 |
| Beta | Active | 45 | 5 |
| Beta | Passive | 25 | 0 |
| Alpha | Passive | 21 | 0 |
| Alpha | Passive | 26 | 1 |
| Beta | Active | 30 | 2 |
| Beta | Passive | 18 | 0 |
dataframe
14) The above dataset has been loaded for you in R in a variable named “dataframe” with first row representing the column name. Which of the following code will select only the rows for which parameter is Alpha?
B) subset(dataframe, Parameter==’Alpha’)
C) filter(dataframe,Parameter==’Alpha’)
D) Both 2 and 3
E) All of the above
Solution: (D)
In option A, there should be an equality operator instead of the assignment operator. Therefore, option D is the correct solution.
15) Which of the following function is used to view the dataset in spreadsheet like format?
A) disp()
B) View()
C) seq()
D) All of the Above
Solution : (B)
Option B is the only option that will show the dataset in the spreadsheet format. Therefore, option B is the correct solution.
Question Context 16
The below dataframe is stored in a variable named data.
| A | B |
| 1 | Right |
| 2 | Wrong |
| 3 | Wrong |
| 4 | Right |
| 5 | Right |
| 6 | Wrong |
| 7 | Wrong |
| 8 | Right |
data
16) Suppose B is a categorical variable and we wish to draw a boxplot for every level of the categorical level. Which of the below commands will help us achieve that?
B) boxplot(A~B,data=data)
C) boxplot(A|B,data=data)
D) None of the above
Solution: (B)
Boxplot function in R requires a formula input to draw different boxplots by levels of a factor variable. Therefore, Option B is the correct solution.
17) Which of the following commands will split the plotting window into 4 X 3 windows and where the plots enter the window column wise.
B) par(mfcol=c(4,3))
C) par(mfrow=c(4,3))
D) par(col=c(4,3))
Solution: (B)
mfcol argument will ensure that the plots enter the plotting window column wise. Therefore, Option B is the correct solution.
Question Context 18
A Dataframe “df” has the following data:
Dates
2017-02-28
2017-02-27
2017-02-26
2017-02-25
2017-02-24
2017-02-23
2017-02-22
2017-02-21
After reading above data, we want the following output:
Dates
28 Tuesday Feb 17
27 Monday Feb 17
26 Sunday Feb 17
25 Saturday Feb 17
24 Friday Feb 17
23 Thursday Feb 17
22 Wednesday Feb 17
21 Tuesday Feb 17
18) Which of the following commands will produce the desired output?
B) format(df,”%D %A %b %y”)
C) format(df,”%D %a %B %Y”)
D) None of above
Solution: (D)
None of the above options will produce the desired output. Therefore, Option D is the correct solution.
19) Which of the following command will help us to rename the second column in a dataframe named “table” from alpha to beta?
B) colnames(table)[which(colnames==’alpha’)]=’beta’
C) setnames(table,’alpha’,’beta’)
D) All of the above
Solution: (D)
All of the above options are different methods to rename the column names of a dataframe.Therefore, option D is the correct solution.
Question Context: 20
A majority of work in R uses systems internal memory and with large datasets, situations may arise when the R workspace cannot hold all the R objects in memory. So removing the unused objects is one of the solution.
20) Which of the following command will remove an R object / variable named “santa” from the workspace?
B) rm(santa)
C) Both
D) None
Solution : (C)
remove and rm , both can be used to clear the workspace. Therefore, option C is the correct solution.
21) “dplyr” is one of the most popular package used in R for manipulating data and it contains 5 core functions to handle data. Which of the following is not one of the core functions of dplyr package?
B) filter()
C) arrange()
D) summary()
Solution: (D)
summary is a function in the R base package and not dplyr.
Context – Question 22
During Feature Selection using the following dataframe (named table), “Column1” and “Column2” proved to be non-significant. Hence, we would not like to take these two features into our predictive model.
| Column1 | Column2 | Column3 | Column4 | Column5 | Column6 | |
| Name1 | Alpha | 12 | 24 | 54 | 0 | Alpha |
| Name2 | Beta | 16 | 32 | 51 | 1 | Beta |
| Name3 | Alpha | 52 | 104 | 32 | 0 | Gamma |
| Name4 | Beta | 36 | 72 | 84 | 1 | Delta |
| Name5 | Beta | 45 | 90 | 32 | 0 | Phi |
| Name6 | Alpha | 12 | 24 | 12 | 0 | Zeta |
| Name7 | Beta | 32 | 64 | 64 | 1 | Sigma |
| Name8 | Alpha | 42 | 84 | 54 | 0 | Mu |
| Name9 | Alpha | 56 | 112 | 31 | 1 | Eta |
table
22) Which of the following commands will select all the rows from column 3 to column 6 for the below dataframe named table?
B) table[,3:6]
C) subset(table,select=c(‘Column3’,’Column4’,’Column5’,’Column6’))
D) All of the above
Solution: (D)
Option A, B and C are different column sub setting methods in R. Therefore, option D is the correct solution.
Context Question 23-24
| Column1 | Column2 | Column3 | Column4 | Column5 | Column6 | |
| Name1 | Alpha | 12 | 24 | 54 | 0 | Alpha |
| Name2 | Beta | 16 | 32 | 51 | 1 | Beta |
| Name3 | Alpha | 52 | 104 | 32 | 0 | Gamma |
| Name4 | Beta | 36 | 72 | 84 | 1 | Delta |
| Name5 | Beta | 45 | 90 | 32 | 0 | Phi |
| Name6 | Alpha | 12 | 24 | 12 | 0 | Zeta |
| Name7 | Beta | 32 | 64 | 64 | 1 | Sigma |
| Name8 | Alpha | 42 | 84 | 54 | 0 | Mu |
| Name9 | Alpha | 56 | 112 | 31 | 1 | Eta |
table
23) Which of the following commands will select the rows having “Alpha” values in “Column1” and value less than 50 in “Column4”? The dataframe is stored in a variable named table.
A) dplyr::filter(table,Column1==’Alpha’, Column4<50)
B) dplyr::filter(table,Column1==’Alpha’ & Column4<50)
C) Both of the above
D) None of the above
Solution: (C)
- filter function in dplyr package uses “,” and “&” to add the condition. Therefore, Option C is the correct solution.
Question Context 23-24
| Column1 | Column2 | Column3 | Column4 | Column5 | Column6 | |
| Name1 | Alpha | 12 | 24 | 54 | 0 | Alpha |
| Name2 | Beta | 16 | 32 | 51 | 1 | Beta |
| Name3 | Alpha | 52 | 104 | 32 | 0 | Gamma |
| Name4 | Beta | 36 | 72 | 84 | 1 | Delta |
| Name5 | Beta | 45 | 90 | 32 | 0 | Phi |
| Name6 | Alpha | 12 | 24 | 12 | 0 | Zeta |
| Name7 | Beta | 32 | 64 | 64 | 1 | Sigma |
| Name8 | Alpha | 42 | 84 | 54 | 0 | Mu |
| Name9 | Alpha | 56 | 112 | 31 | 1 | Eta |
table
24) Which of the following code will sort the dataframe based on “Column2” in ascending order and “Column3” in descending order?
B) table[order(-Column3,Column2),]
C) Both of the above
D) None of the above
Solution: (C)
Both order and arrange functions can be used to order the columns in R. Therefore, Option C is the correct solution.
25) Dealing with strings is an important part of text analytics and splitting a string is often one of the common task performed while creating tokens, etc. What will be the output of following commands?
A<-paste(“alpha”,”beta”,”gamma”,sep=” ”)
B←paste(“phi”,”theta”,”zeta”,sep=””)
parts←strsplit(c(A,B),split=” ”)
A) alpha
B) beta
C) gamma
D) phi
E) theta
F) zeta
Solution : (B)
c(A.B) would concatenate A=”alpha beta gamma” and B=”phithetazeta” separated by a white space. Upon using strsplit, the two strings will be separated at the white space between A and B into two lists. Parts[[1]][2] tells us to print the second sub element of the first element of the list which is “beta”. Therefore, option B is the correct solution.
26) What will be the output of the following command
grepl(“neeraj”,c(“dheeraj”,”Neeraj”,”neeraj”,”is”,”NEERAJ”))
A) [FALSE TRUE TRUE FALSE TRUE]
B) [FALSE TRUE TRUE FALSE FALSE]
C) [FALSE FALSE TRUE FALSE FALSE]
D) None of the above
Solution: (C)
The above command will go for the exact match of the passed argument and therefore Option C is the correct solution.
Question Context 27
Sometimes as a Data Scientist working on textual data we come across instances where we find multiple occurrences of a word which is unwanted. Below is one such string.
A<-c("I can use because thrice in a sentence because because is a special word.")
A) gsub(“because”,”since”,A)
B) sub(“because”,”since”,A
C) regexec(“because”,”since”,A)
D) None of the above
Solution: (A)
sub command will replace only the first occurrence in a string whereas regexec will return a list of positions of the match or -1 if no match occurs. Therefore, Option A is the correct solution.
28) Imagine a dataframe created through the following code.
Which of the following command will help us remove the duplicate rows based on both the columns?
B) unique(df)
C) dplyr::distinct(df)
D) All of the above
Solution: (D)
All the above methods are different ways of removing the duplicate rows based on both the columns. Therefore, Option D is the correct solution.
Question Context 29
Grouping is an important activity in Data Analytics and it helps us discover some interesting trends which may not be visible easily in the raw data.
Suppose you have a dataset created by the following lines of code.
table<-data.table(foo=c("A","B","A","A","B","A"),bar=1:6)
29) Which of the following command will help us to calculate the mean bar value grouped by foo variable?
B) table::df[,mean(bar),by=foo]
C) dplyr::table%>%group_by(foo)%>%summarize(mean=mean(bar))
D) All of the above
Solution: (D)
All the above methods are used to calculate the grouped statistic of a column. Therefore, Option D is the correct solution.
30) If I have two vectors x<- c(1,3, 5) and y<-c(3, 2), what is produced by the expression cbind(x, y)?
B) a matrix with 3 columns and 2 rows
C) a data frame with 2 columns and 3 rows
D) a data frame with 3 columns and 2 rows
Solution: (D)
All of the above options define messy data and hence Option D is the correct solution.
31) Which of the following commands will convert the following dataframe named maverick into the one shown at the bottom?
| Grade | Male | Female |
| A | 10 | 15 |
| B | 20 | 15 |
| A | 30 | 35 |
Output dataframe
| Grade | Sex | Count |
| A | Male | 10 |
| A | Female | 15 |
| B | Male | 30 |
| B | Female | 15 |
| A | Male | 30 |
| A | Female | 35 |
A) tidyr::Gather(maverick, Sex,Count,-Grade)
B) tidyr::spread(maverick, Sex,Count,-Grade
C) tidyr::collect(maverick, Sex,Count,-Grade)
D) None of the above
Solution: (A)
Spread command converts rows into columns whereas there is no collect command in tidyr or base package.
Therefore, Option A is the correct solution.
32) Which of the following command will help us to replace every instance of Delhi with Delhi_NCR in the following character vector?
C<-c(“Delhi is”,”a great city.”,”Delhi is also”,”the capital of India.”)
B) sub(“Delhi”,”Delhi_NCR”,C)
C) Both of the above
D) None of the above
Solution: (C)
Though sub command only replaces the first occurrence of a pattern. In this case, strings have just a single appearance of Delhi. Hence, both gsub and sub command will work in this situation. Therefore, Option C is the correct solution.
Question Context 33
Sometimes creating a feature which represents whether another variable has missing values or not can prove to be very useful for a predictive model.
Below is a dataframe which has missing values in one of its columns.
| Feature1 | Feature2 |
| B | NA |
| C | 30 |
| D | 40 |
| E | 50 |
33) Which of the following commands will create a column named “missing” with value 1 where variable “Feature2” has missing values?
| Feature1 | Feature2 | Missing |
| B | NA | 1 |
| C | 30 | 0 |
| D | 40 | 0 |
| E | 50 | 0 |
A)
dataframe$missing<-0
dataframe$Missing[is.na(dataframe$Feature2)]<-1
B)
dataframe$missing<-0
dataframe$Missing[which(is.na(dataframe$Feature2))]<-1
C) Both of the above
D) None of the above
Solution: (C)
Option C is the correct answer.
34) Suppose there are 2 dataframes “A” and “B”. A has 34 rows and B has 46 rows. What will be the number of rows in the resultant dataframe after running the following command?
merge(A,B,all.x=TRUE)
B) 12
C) 34
D) 80
Solution: (C)
all.x forces the merging to take place on the basis of A and hence will contain the same number of rows as of A. Therefore, Option C is the correct solution.
Question context 35
The very first thing that a Data Scientist generally does after loading dataset is find out the number of rows and columns the dataset has. In technical terms, it is called knowing the dimensions of the dataset. This is done to get an idea about the scale of data that he is dealing with and subsequently choosing the right techniques and tools.
35) Which of the following command will not help us to view the dimensions of our dataset?
A) dim()
B) str()
C) View()
D) None of the above
Solution: (C)
View command will print the dataset to the console in a spreadsheet like format but will not help us to view the dimensions. Therefore, option C is the correct solution.
Question context 36
Sometimes, we face a situation where we have two columns of a dataset and we wish to know which elements of the column are not present in another column. This is easily achieved in R using the setdiff command.
| Column1 | Column2 | Column3 | Column4 | Column5 | Column6 | |
| Name1 | Alpha | 12 | 24 | 54 | 0 | Zion |
| Name2 | Beta | 16 | 32 | 51 | 1 | Beta |
| Name3 | Alpha | 52 | 104 | 32 | 0 | Gamma |
| Name4 | Beta | 36 | 72 | 84 | 1 | Delta |
| Name5 | Beta | 45 | 90 | 32 | 0 | Phi |
| Name6 | Alpha | 12 | 24 | 12 | 0 | Zeta |
| Name7 | Beta | 32 | 64 | 64 | 1 | Sigma |
| Name8 | Alpha | 42 | 84 | 54 | 0 | Mu |
| Name9 | Alpha | 56 | 112 | 31 | 1 | Eta |
dataframe
36) What will be the output of the following command?
setdiff(dataframe$Column1,dataframe$Column6)==setdiff(dataframe$Column6,dataframe$Column1)
B)FALSE
C) Can’t Say
Solution: (B)
The order of arguments matter in setdiff function. Therefore, option B is the correct solution.
Question Context 37
The below dataset is stored in a variable called “frame”.
| A | B |
| alpha | 100 |
| beta | 120 |
| gamma | 80 |
| delta | 110 |
37) Which of the following commands will create a bar plot for the above dataset. Use the values from Column B to represent the height of the bar plot.
B) ggplot(frame,aes(A,B))+geom_bar(stat=”bin”)
C) ggplot(frame,aes(A,B))+geom_bar()
D) None of the above
Solution: (A)
stat=”identity” will ensure the values in column B become the height of the bar. Therefore, Option A is the correct solution.
Question Context 38
| A | mpg | cyl | disp | hp | drat | wt | qsec | vs | am | gear | carb |
| Mazda RX4 | 21.0 | 6 | 160 | 110 | 3.90 | 2.620 | 16.46 | 0 | 1 | 4 | 4 |
| Mazda RX4 Wag | 21.0 | 6 | 160 | 110 | 3.90 | 2.875 | 17.02 | 0 | 1 | 4 | 4 |
| Datsun 710 | 22.8 | 4 | 108 | 93 | 3.85 | 2.320 | 18.61 | 1 | 1 | 4 | 1 |
| Hornet Drive | 21.4 | 6 | 258 | 110 | 3.08 | 3.215 | 19.44 | 1 | 0 | 3 | 1 |
| Hornet Sportabout | 18.7 | 8 | 360 | 175 | 3.15 | 3.440 | 17.02 | 0 | 0 | 3 | 2 |
| Valiant | 18.1 | 6 | 225 | 105 | 2.76 | 3.460 | 20.22 | 1 | 0 | 3 | 1 |
38) We wish to create a stacked bar chart for cyl variable with stacking criteria Being vs Variable. Which of the following commands will help us perform this action?
B) ggplot(mtcars,aes(factor(cyl),fill=factor(vs)))+geom_bar()
C) All of the above
D) None of the above
Solution: (C)
Both options A and B will create a stacked bar chart guided by the “fill” parameter. Therefore, option C is the correct solution.
39) What is the output of the command – paste(1:3,c(“x”,”y”,”z”),sep=””) ?
B) [1:3x y z]
C) [1x 2y 3z]
D) None of the above
Solution: (C)
Question Context 40
R has a rich library reserve for drawing some of the very high end graphs and plots and many a times you want to save the graphs for presenting your findings to someone else. Saving your plots to a PDF file is one such option.
40) If you want to save a plot to a PDF file, which of the following is a correct way of doing that?
B) Construct the plot on the PNG device with png(), then copy it to a PDF with dev.copy2pdf().
C) Open the PostScript device with postscript(), construct the plot, then close the device with dev.off().
D) Open the screen device with quartz(), construct the plot, and then close the device with dev.off().
Solution: (A)
The plots are first created on the screen device and then can be copied easily to a pdf file. Therefore, option A is the correct solution.
End Notes
If you are learning R, you should use the test above to check your skills in R. If you have any questions or doubts, feel free to post them below.
Learn, compete, hack and get hired!
I am a perpetual, quick learner and keen to explore the realm of Data analytics and science. I am deeply excited about the times we live in and the rate at which data is being generated and being transformed as an asset. I am well versed with a few tools for dealing with data and also in the process of learning some other tools and knowledge required to exploit data.


OK, this was meant to be a test for R, and not for data science as such, but the latter part should definitely not be neglected in such a blog, What disappointed me were examples like: The bar chart at the beginning just skips the scores between 33 and 40, which were not reached. The histogram example prompts you to do a histogram of 7 values. Statistical literacy is more important than knowing whether "corr" or "cor" is the right syntax - R will give you an error message if you're wrong. As a suggestion: one of your bloggers should do another 40 questions on correct data treatment and visualisation. Not meant as critics - I think the topic will be quite interesting to your readers.
Thanks Stephanie for your suggestion. I will surely look into it.
In 23), the solution should be C because dplyr's filter also supports '&' for the logic and.
Thanks for pointing that out. Change has been made.
In question 30. Answer is Matrix with 2 columns and 3 rows. Please update
Hello I have doubts in Questions 1 , 2, 25 and 30. Could you please explain how Question 1 the result is Option (A) ? In Question2 you have mentioned that there is a figure, but there is no figure. Could you please clarify? In Question 25, the last command is parts <- strsplit(c(A,B),split=" ") . This will produce a list and then we need to get the correct element from the list. In the Explanation for the answer you have mentioned parts[[1]][2] but there is nothing like that in the Question 25 description. Could you please check? And in Question 30, I tried the code in Question on R in my computer. and got option (A) a matrix with 3 rows and 2 columns. Could you please clarify?