Heart Sound Segmentation using Deep Learning – A doctor in making?
Introduction
The idea of doing a project on heart sound segmentation came from a recent breakthrough I heard over the internet. One of the influencers I follow – Andrew Ng published a research paper a while back – which essentially is a state-of-the-art method for detecting heart disease.
Heart disease? ML diagnoses from ECG better than cardiologist! @awnihannun @pranavrajpurkar @iRhythmTech @willknight https://t.co/bZAm8Y5Z09
— Andrew Ng (@AndrewYNg) July 7, 2017
It was an intriguing idea for me, so I went through all the materials published on the subject to understand what was the original idea behind.
To keep the story short, the authors said that they used deep learning – a technique which has been in the news for a while now, for extracting the patterns that experts used to identify a diseased patient. This algorithm after training, became so good at the task that the authors claim to surpass even seasoned doctors. This idea influenced me that even I – albeit small – could have an impact on the substantial advancements that these researchers are having!
This article focuses on audio segmentation problem in ECG signals and how we leverage deep learning to solve the task. I will first discuss a bit about segmentation problem in general and then show you the ways that can be used to solve the problem. I will also discuss what “heart sound” is and then show you an implementation of heart sound segmentation.
So let’s get on with it!
Note: This article assumes that you have a basic knowledge of audio data analysis. If you want to brush up the concepts – you can go through the article
Table of Contents
- What is a Segmentation problem in general?
- Supervised Segmentation approach
- Understanding our problem – What do you mean by “Heart Sound”?
- Implementation of Heart Sound Segmentation
What is a Segmentation problem (in general)?
Before we dive into heart sound segmentation, let us go back and understand what segmentation problem entails. Segmentation literally means dividing a particular object into parts (or segments) based on a defined set of characteristics. This object can be anything – ranging from concrete things like a frame of an image or an audio signal, to abstract objects like market or consumers.
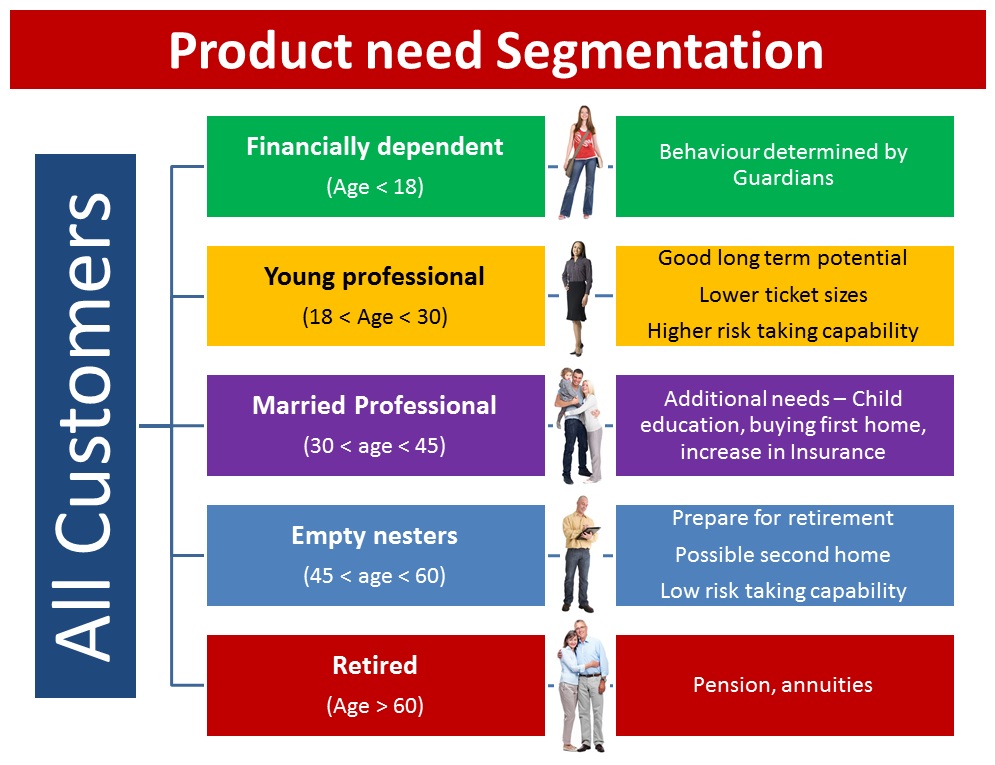
You may ask, why would you segment objects? The answer is simple – if you break down an object, it becomes an easier task extract information from it. For example in Customer Management, working with averages never reveals actionable insights until broken down in segments. As mentioned in the article, this is an example of customer segmentation of credit card usage on the basis of their age.
Supervised Segmentation approach
Now that you know Segmentation as a problem, let us understand the approaches to solve a segmentation problem.
Segmentation, specially for audio data analysis, is an important pre-processing step. This is because you can segment a noisy and lengthy audio signal into short homogeneous segments, which are handy short sequences of audio used for further processing. Now to solve a segmentation problem, you can either do it directly using unsupervised methods or convert it into a supervised problem and then group it according to its class.
To explain this more intuitively, lets take an example of Image Segmentation task.
Suppose you have an image of a cat in a field as we can see below. What you want is to divide the image into chunks – so that one individual object can be separately identified from the other. You can do this in two ways
- Approach 1: From each pixel of the image, find out the pixels which are close to each other and have an approximately similar color. You can cluster these pixels together to form a bigger picture of an object. In the example below, our cat is mostly greyish white. So it would be easier to find the pixels and segmenting the cat out of the image. This is an unsupervised approach to segmentation.
- Approach 2: Train a model by giving it explicit examples of the classes belonging to the image – specifically a cat, trees and sky. Then get the model predictions on which class is present where in the image. This is a supervised approach to segmentation.

Although both the approaches has its pros and cons, the decision to start out with either of the approach will depend upon how hard it is to get training examples to go on with the supervised approach.
Understanding our problem – What do you mean by “Heart Sound”?
Without wasting any time, let us jump on to what our actual problem is and try to solve it. Quoting the challenge page itself,
According to the World Health Organisation, cardiovascular diseases (CVDs) are the number one cause of death globally: more people die annually from CVDs than from any other cause. An estimated 17.1 million people died from CVDs in 2004, representing 29% of all global deaths. Of these deaths, an estimated 7.2 million were due to coronary heart disease. Any method which can help to detect signs of heart disease could therefore have a significant impact on world health. This challenge is to produce methods to do exactly that.
The task in the challenge is to find a method that can locate sounds particular to a heart (aka lub & dub, which are technically called S1 and S2) within audio data and then segment the audio files on the basis of these sounds. After segmenting the sounds, the challenge then asks us to produce a method that can classify heartbeat into normal and diseased categories. For the purpose of this article, we will take up only the first task of the challenge, i.e. to segment heart audio.
To give you a practical glimpse, this is how the heart sounds like
A normal heart sound has a clear “lub dub, lub dub” pattern, with the time from “lub” to “dub” shorter than the time from “dub” to the next “lub” (when the heart rate is less than 140 beats per minute). A temporal description of “lub” and “dub” locations over time in the following illustration:
lub……….dub……………. lub……….dub……………. lub……….dub……………. lub……….dub
Implementation of Heart Sound Segmentation
The very basic step you need to do whenever you start up on a problem is to understand the data and go through it record by record. Let us start with this:
Note: you can download the required dataset from this webpage. Only download Dataset A of challenge 1 (Atraining_normal.zip and Atraining_normal_seg.csv)
# import modules%pylab inline

import librosa
import numpy as np
import pandas as pd
from librosa import display
# read csv filetemp = pd.read_csv('../misc/Atraining_normal_seg.csv')
temp.head()

- Let’s plot a sample heartbeat from out dataset
# load sampledata, sampling_rate = librosa.load('../misc/Atraining_normal/201102081321.wav', sr=44100 )
display.waveplot(data, sr=sampling_rate)

We see that there are cycles of heartbeat, with a higher intensity sound followed by a lower intensity sound.
- For our problem, we would have to create training data from the raw files. The code below does this simply by going though all the raw files, and extracting a part of the audio along with its respective label
# create training data
data_x = []
data_y = []
for j in range(temp.shape[0]):
   for i in range(1, temp.shape[1] - 1):
     try:
       data, sampling_rate = librosa.load('../misc/Atraining_normal/'+ temp.iloc[j, 0].split('.')[0] +'.wav', sr=44100 )
       temp_data = data[int(temp.iloc[j, i]):int(temp.iloc[j, i+1])]
       temp_label = temp.iloc[:, i].name.split('.')[0]

       data_x.append(temp_data)
       data_y.append(temp_label)
     except:
       pass
- When we create this data, a bit of pre-processing is required. First is to make all the the extracted samples of same shape, second is to normalize the data and third is to create appropriate X and Y for our deep learning model.
# preprocessing from keras.preprocessing.sequence import pad_sequences

# step 1data_x = pad_sequences(data_x, maxlen=20000, dtype='float', padding='post', truncating='post', value=0.)

# step 2data_x = data_x / np.max(data_x)

# step 3
data_x = data_x[:,:,np.newaxis]
data_y = pd.Series(data_y)
data_y.value_counts()

data_y = data_y.map({'S1':0, 'S2':1}).values
- Now let us build our deep learning model. We will build a CNN model, as CNN have proved to be state-of-the-art architecture for sequence understanding and classification
from keras.layers import InputLayer, Conv1D, Dense, Flatten, MaxPool1D
from keras.models import Sequential
model = Sequential()
model.add(InputLayer(input_shape=data_x.shape[1:]))
model.add(Conv1D(filters=50, kernel_size=10, activation=’relu’))
model.add(MaxPool1D(strides=8))
model.add(Conv1D(filters=50, kernel_size=10, activation=’relu’))
model.add(MaxPool1D(strides=8))
model.add(Flatten())
model.add(Dense(units=1, activation=’softmax’))
model.compile(optimizer=’adam’, loss=’binary_crossentropy’, metrics=[‘accuracy’])
Our model will have this type of architecture

- The next step is to train your model on the transformed dataset
# train modelmodel.fit(data_x, data_y, batch_size=32, epochs=1)
We are restricting the training for only 1 epoch here. But you can increase this to make your model perform better.
And voila! You have a trained model which can be used to perform segmentation task. Now to get the durations where you should segment a heartbeat, just divide your raw test file into multiple parts and get the top prediction out of it. The model would give a prediction like this

End Notes
I hope this article gave you a glimpse of how advancements in audio analysis can help us creating amazing technologies that can change our lives. The possibilities it opens up for humans can be huge.
I have specially included an implementation of the technique so that you can use it to try it out locally. If you find the article helpful or have any suggestions, do let me know in the comments below!
Learn, engage , hack and get hired!
Faizan is a Data Science enthusiast and a Deep learning rookie. A recent Comp. Sc. undergrad, he aims to utilize his skills to push the boundaries of AI research.


You are doing wonderful work. Have you written a journal paper based on this paper already? Which courses do you offer that can empower me with this knowledge. Perhaps, I need to send you my CV to see what I have done, for you to be well informed in giving me direction. Thank you.
James can you share your paper
Hey James! Thanks for the kind words. I mainly write on Deep Learning and the related domains. You can check out the rest of my articles here - https://www.analyticsvidhya.com/blog/author/jalfaizy/
Great work with lots of freshness in it ...... Keep it up :)
Thanks saurabh!
Nice and informative article. Enjoyed reading. Thanks for writing such an wonderful piece. Need a small clarification, Atraining_normal_seg.csv contain some values of S1 and S2. Can you briefly elaborate what these values indicates and what is the unit of these values.
Hi Shan, S1 and S2 are the sound of heart (lub-dub sound). The values represent the timestamp at which the sound occurs
Can you also share the code to predict and plot the last two graphs.
Sure - I'll add it in due time.
Hi , Can you please write the code for doing the same exercise in R. I am more comfortable with R than Python and want to do the same exercise in R. Thanks in Advance
How did you get the last two graphs? Could you share the code.
Didn’t reduce training loss to less than 8.3 for me? And predicted everything as 1. Help please!!
I would like to kindly second what sushil shah said - could you please make a follow-up post explaining how to use the trained model to make predictions as you showed with the plot? It's a rather unique method and there doesn't seem to be any other sources for such a task.
Hi, Thank you very much for the nice article and the code, otherwise, I have two remarques: First: my training gives me always accuracy =8.3384 and accuracy=0.477 and it never change ever with the different epochs . And second, can plz provide us the code to plot the last two figures, it's so important for me . Thank you.