Learn How to use the Transform Function in Pandas (with Python code)
Introduction
The Transform function in Pandas (Python) can be slightly difficult to understand, especially if you’re well-versed in Excel. Most data scientists don’t use it immediately in their learning journey.
But Pandas’ transform function is quite a handy tool for a data scientist! It is a powerful function that you can lean on for feature engineering in Python.
I personally started using this when I was looking to perform feature engineering in a hackathon – and I was pleasantly surprised by how quickly the Transform function worked. I strongly feel you will benefit from knowing and using the Transform function, so I decided to write about it in this article.
To learn the basics of Python and Pandas for data science, check out these popular courses:

Table of contents
What is the Transform Function in Python?
Python’s Transform function returns a self-produced dataframe with transformed values after applying the function specified in its parameter. This dataframe has the same length as the passed dataframe. The argument supplied to the transform() method can be either a NumPy function, the name of a string function, or a user-defined function.
A Pandas series is a one-dimensional ndarray with axis labels. While the labels do not have to be unique, they must be of a hashable type.
That was a lot, so let me explain using an example.
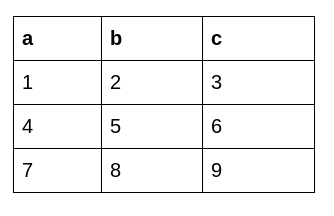
Let’s say we want to multiply 10 by each element in a dataframe:
GitHub Link:
The original dataframe looks like this:
Python Code
Syntax
#import library
import pandas as pd
import numpy as np
#creating a dataframe
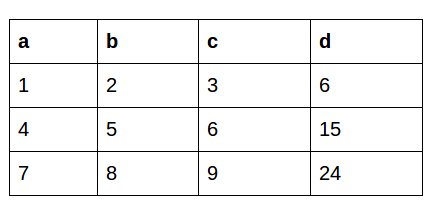
df=pd.DataFrame(np.array([[1, 2, 3], [4, 5, 6], [7, 8, 9]]), columns=['a', 'b', 'c'])
#applying the transform function
print(df.transform(func = lambda x : x * 10))For better understanding, let’s dissect each line of the above-given code:
- Import Libraries
pdis an alias for the Pandas library, which is used for data manipulation and analysis.npis an alias for the NumPy library, used for numerical operations in Python.
- Creating a DataFrame
- Creates a Pandas DataFrame using a NumPy array. The array contains numerical data arranged in rows and columns, and column names are specified as ‘a, ‘b,’ and ‘c.’
- Applying the Transform Function
- Uses the
transformfunction of the DataFrame to apply a specified function to each element of the DataFrame. - The function specified is a lambda function (
lambda x: x * 10), which multiplies each element (x) by 10. - The transformed DataFrame is then printed.
- Uses the
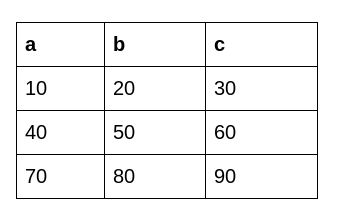
This is the dataframe we get after applying Python’s Transform function:
Why is Python’s Transform Function Important?
Transform comes in handy during feature extraction. As the name suggests, we extract new features from existing ones. Let’s understand the importance of the transform function with the help of an example.
Here, we have a dataset about a department store:
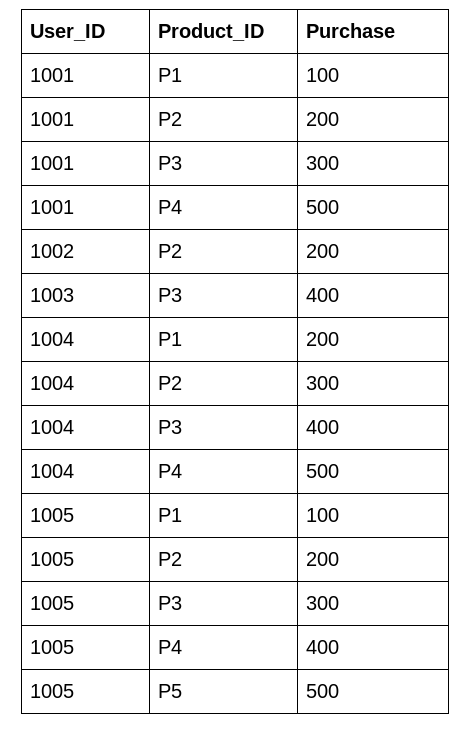
We can see that each user has bought multiple products with different purchase amounts. We would like to know the mean purchase amount of each user. This helps us create a new feature for the model to understand the relationship better.
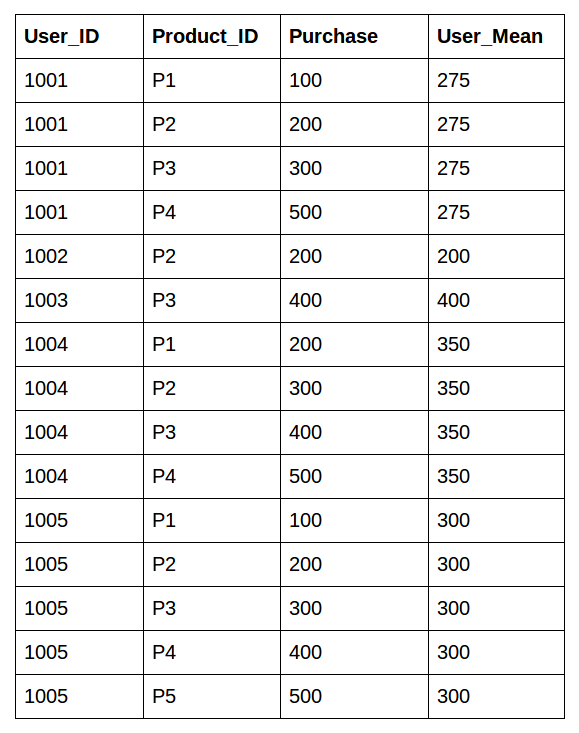
This is the desired output
There are multiple approaches to do this:
- Using Groupby followed by merge()
- Transform function approach
I’ll implement both of them in this article.
To know Learn Machine Learning Tutorial: Top 10 Machine Learning Algorithms to Use in 2024
Approach 1: Using Groupby followed by merge()
The first approach is using groupby to aggregate the data and then merge this data back into the original dataframe using the merge() function. Let’s do it!
Step1: Import the Libraries and Read the Dataset
Step2: Use groupby to Calculate the Aggregate
Here is a pictorial representation of how groupby puts together the mean of each user:
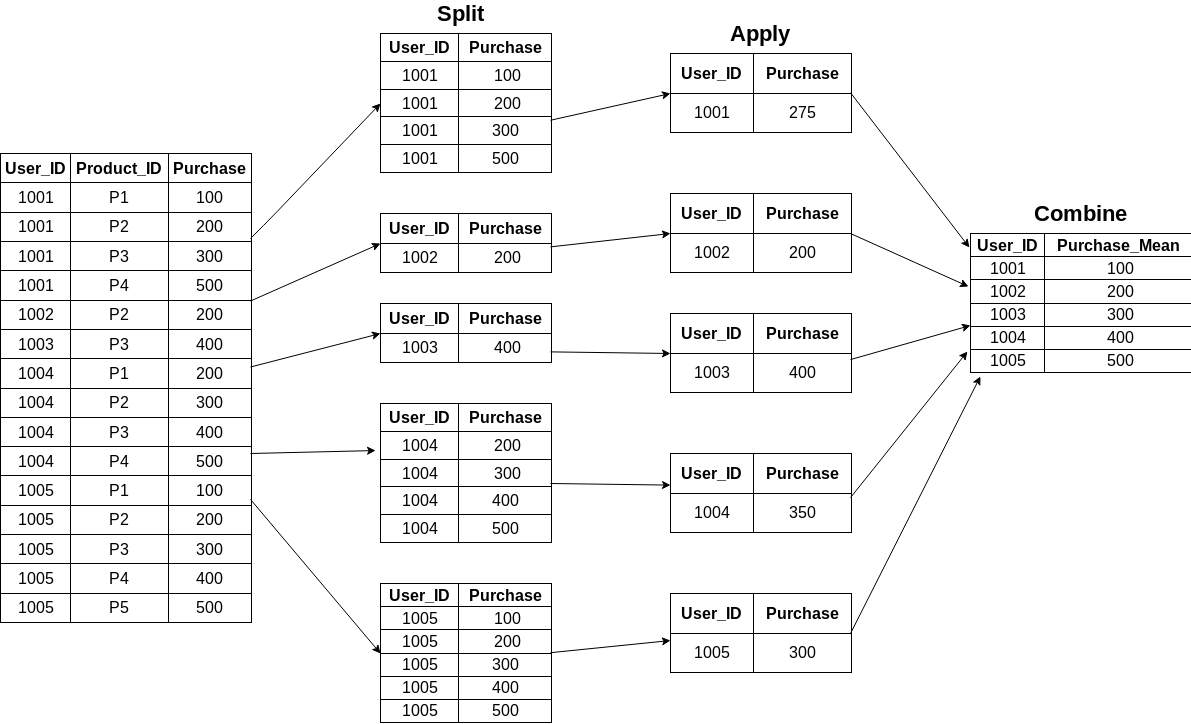
Step3: Using merge() function to recombine
Now, the tough part. How do we combine this data back to the original dataframe? We’ll be using the merge() function for this task. You can read more about joins and merges in Python using Pandas here and here.
Our original dataframe looks like this:
Creates a Pandas DataFrame using a NumPy array. The array contains numerical data arranged in rows and columns, and column names are specified as ‘a, ‘b,’ and ‘c.’
This certainly does our work. However, it is a multistep process and requires extra code to get the data in the form we require. This multistep process can be resource-consuming in hackathons where time is a major constraint.
We can solve this effectively using the transform function in Pandas.
Approach 2: Using Python’s Transform Function
This is an important function for creating features. Trust me, it can be a game-changer!
After performing the transformation, the transform function retains the same number of items as the original dataset. We’ll be leaning on a super-easy one-line step using groupby followed by a transform:
The pictorial representation is as follows:
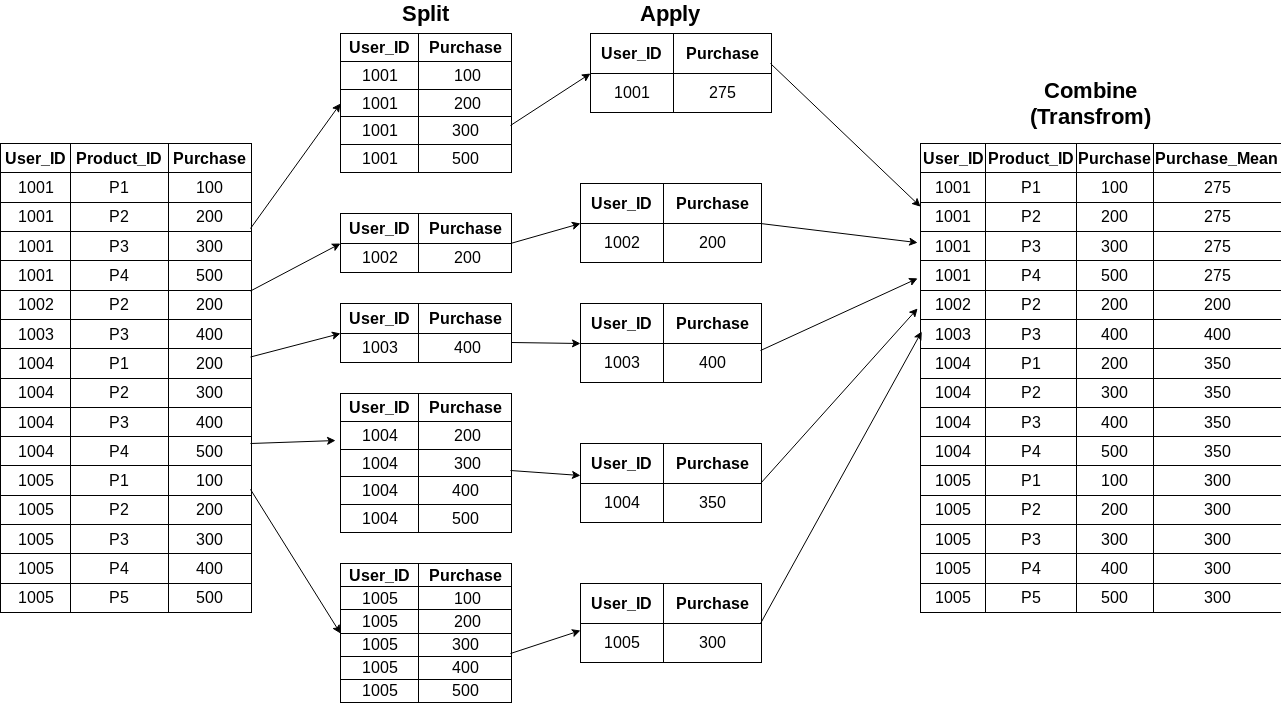
Couldn’t be simpler, right? The original dataframe looks similar to the above one in the last step.
The time taken by the transform function to perform the above operation is comparatively less over a large dataframe. That’s a sigificant advantage as comapred to the first approach we used.
Let me demonstrate the Transform function using Pandas in Python.
Suppose we create a random dataset of 1,000,000 rows and 3 columns. Now we calculate the mean of one column based on groupby (similar to mean of all purchases based on groupby user_id).
Step 1: Import the libraries
Step 2: Create the dataframe
Step 3: Use the merge procedure
Output:![]()
Step 4: Use the transform function
Output:![]()
This clearly shows the transform function is much faster than the previous approach. Well done!
Also read Spark DataFrame: Complete Guide on DataFrame Operations in PySpark.
Difference Between Apply And Transform Function in Python
Now, let’s say we want to create a new column based on the values of another column. This is the dataframe we’re working with:
With the Apply Function
This is what the output looks like using the Apply function:
The apply function sends a whole copy of the dataframe to work upon so we can simultaneously manipulate all the rows or columns.
With the Transform Function
This feature is not possible in the Transform function. This manipulates a single row or column based on axis value and doesn’t manipulate a whole dataframe. So, we can use either the Apply or the Transform function, depending on the requirement.
Learn SQL Tutorial: Hands-on Beginner’s Guide to SQL
Conclusion
Python’s Transform function in Pandas, a valuable tool for efficient feature engineering, proves crucial in hackathons. It simplifies tasks like aggregations, making it a game-changer for data scientists dealing with data structures, data types, and dtype. Embracing this function enhances the toolkit, offering a faster feature extraction and manipulation approach.
The Transform function is super useful when I’m quickly looking to manipulate rows or columns. As I mentioned earlier, this is especially handy in hackathons when time is of the essence.
If you come across any more such Pandas functions, do comment, and I’ll be happy to learn and share!
Start participating in competitions to showcase your skills. This is a great starting point: Black Friday Sales Project.
You can register on the DataHack platform, participate in cool competitions, and compete with the best data science experts!
Also read Pandas series: The Ultimate Guide to Pandas For Data Science!
Frequently Asked Questions
Ans. The Transform function in pandas performs group-specific computations and returns a DataFrame with the same shape as the original. It allows for efficient data manipulation by applying a function to each group within a DataFrame, facilitating group-wise transformations and aggregations.
Ans. To plot a DataFrame using Pandas, you can utilize the built-in plotting functions. Use commands like df.plot() for basic plots or specify plot types, columns, and styling options. This enables easy visualization of data trends and patterns directly from your Pandas DataFrame. Additionally, to transform the data before plotting, you can explore the pandas DataFrame.transform method to apply a function to the DataFrame’s elements.
Ans. To implement a custom transform function on a DataFrame in Python, define the function, then use the apply method on the DataFrame, passing the custom function as an argument. This allows you to transform the data according to your requirements, enhancing DataFrame manipulation and analysis capabilities. The keyword json can also indicate that the transformation involves JSON data manipulation.
Ans. To utilize Python Pandas for real-time data, use functions like read_csv or read_excel to fetch data from sources such as APIs or databases. Employ libraries like requests for API integration, ensuring regular updates for dynamic datasets.
Ans. In Python, ‘Transform’ is generally used in the context of feature engineering, modifying data with functions. At the same time, ‘Apply’ is used with pandas DataFrames to apply a function along a specific axis. ‘Transform’ often creates new features, whereas ‘apply’ processes existing data within a DataFrame.
Ans. In Python, args and kwargs are used for handling variable-length argument lists in functions. args allows passing a variable number of positional arguments, while kwargs enables handling variable-length keyword arguments, allowing the passing of named parameters in a function.
Aspiring Data Scientist with a passion to play and wrangle with data and get insights from it to help the community know the upcoming trends and products for their better future.With an ambition to develop product used by millions which makes their life easier and better.


I think representation of groupby in split combine is incorrect, as you get indexed values after group by, what picture is showing is reset_index look of group by, although its very minor thing but can still confuse beginners and they may think that then what is the use of reset_index if result is already like the one shown in diagram.
Beautiful and mindblowing the pictorial way of explaining what is happening as the data is tranformed is spot on and it helps to understand what the command is supposed to do to the data being worked on.. Thank you.