Difference Between Z-Test and T-Test
The coronavirus pandemic has made a statistician out of us all. We are constantly checking the numbers, making our own assumptions on how the pandemic will play out, and generating hypotheses on when the “peak” will happen. And it’s not just us performing hypothesis building – the media is thriving on it.
The coronavirus pandemic has made a statistician out of us all. We are constantly checking the numbers, making our own assumptions on how the pandemic will play out, and generating hypotheses on when the “peak” will happen. And it’s not just us performing hypothesis building – the media is thriving on it. Amidst this statistical exploration, understanding the Z test and T test difference becomes crucial. These tests serve as valuable tools for statisticians, allowing them to draw meaningful conclusions and make informed decisions based on the data at hand.
A few days back, I was reading a news article that mentioned this outbreak “could potentially be seasonal” and relent in warmer conditions:

So I started wondering – what else can we hypothesize about the coronavirus? Are adults more likely to be affected by the outbreak of coronavirus? How does Relative Humidity impact the spread of the virus? What is the evidence to support these claims? How can we test these hypotheses? As a Statistic enthusiast, all these questions dig up my old knowledge about the fundamentals of Hypothesis Testing. In this article, we will discuss the concept of Hypothesis Testing and the difference between the z-test and t-test. We will then conclude our Hypothesis Testing learning using a COVID-19 case study.
Learning Objectives
- Understand the fundamentals of hypothesis testing
- Learn how hypothesis testing works
- Be able to differentiate between z-test, t-test, and other statistics concepts
Table of contents
What is Hypothesis Testing?
Hypothesis testing helps in data analysis by providing a way to make inferences about a population based on a sample of data. It allows analysts to decide whether to accept or reject a given assumption or hypothesis about the population based on the evidence provided by the sample data. For example, hypothesis testing can determine whether a sample mean significantly differs from a hypothesized population mean or whether a sample proportion differs substantially from a hypothesized population proportion. This information helps decide whether to accept or reject a given assumption or hypothesis about the population. In statistical analysis, hypothesis testing makes inferences about a population based on a sample of data.
In machine learning, hypothesis testing evaluates a model’s performance and determines its parameters’ significance. For example, a t-test or z-test compares the means of two data groups to determine if there is a significant difference between them. Improve your model using this information, or select the best set of features. Additionally, hypothesis testing can evaluate a model’s accuracy and decide how to proceed with further development or deployment. We can even test the statistical validity of machine learning algorithms like linear regression and logistic regression on a given dataset using the process of hypothesis testing.
This extensive tutorial on hypothesis testing is what you need to get started with the topic.
Fundamentals of Hypothesis Testing
Let’s take an example to understand the concept of Hypothesis Testing. A person is on trial for a criminal offense, and the judge needs to provide a verdict on his case. Now, there are four possible combinations in such a case:
- First Case: The person is innocent, and the judge identifies the person as innocent
- Second Case: The person is innocent, and the judge identifies the person as guilty
- Third Case: The person is guilty, and the judge identifies the person as innocent
- Fourth Case: The person is guilty, and the judge identifies the person as guilty
![Outcome possibilities of Hypothesis Testing [z test and t test],difference between z test and t test](https://av-eks-blogoptimized.s3.amazonaws.com/Screenshot-from-2020-03-03-15-19-28.jpg)
As you can clearly see, there can be two types of error in the judgment – Type 1 error, when the verdict is against the person while he was innocent, and Type 2 error, when the verdict is in favor of the person while he was guilty.
According to the Presumption of Innocence, the person is considered innocent until proven guilty. That means the judge must find the evidence which convinces him “beyond a reasonable doubt.” This phenomenon of “Beyond a reasonable doubt” can be understood as Probability (Judge Decided Guilty | Person is Innocent) should be small.
Basic Concepts of Hypothesis Testing
We consider the Null Hypothesis to be true until we find strong evidence against it. Then we accept the Alternate Hypothesis. We also determine the Significance Level (⍺), which can be understood as the probability of (Judge Decided Guilty | Person is Innocent) in the previous example. Thus, if ⍺ is smaller, it will require more evidence to reject the Null Hypothesis. Don’t worry; we’ll cover all this using a case study later.
![Inferential statistics [z test and t test]](https://av-eks-blogoptimized.s3.amazonaws.com/Screenshot-from-2020-03-03-16-06-59.jpg)
Steps to Perform Hypothesis Testing
There are four steps to performing Hypothesis Testing:
- Set the Null and Alternate Hypotheses
- Set the Significance Level, Criteria for a decision
- Compute the test statistic
- Make a decision
![Steps of Hypothesis Testing [z test and t test], difference between z test and t test](https://av-eks-blogoptimized.s3.amazonaws.com/Screenshot-from-2020-03-03-17-09-56.jpg)
It must be noted that z-Test & t-Tests are Parametric Tests, which means that the Null Hypothesis is about a population parameter, which is less than, greater than, or equal to some value. Steps 1 to 3 are quite self-explanatory but on what basis can we make a decision in step 4? What does this p-value indicate?
We can understand this p-value as the measurement of the Defense Attorney’s argument. If the p-value is less than ⍺ , we reject the Null Hypothesis, and if the p-value is greater than ⍺, we fail to reject the Null Hypothesis.
Critical Value, P-Value
Let’s understand the logic of Hypothesis Testing with the graphical representation for Normal Distribution.
![Graphical representation of normal distribution [z test and t test]](https://av-eks-blogoptimized.s3.amazonaws.com/Screenshot-from-2020-03-03-18-01-53.jpg)
The above visualization helps to understand the z-value and its relation to the critical value. Typically, we set the Significance level at 10%, 5%, or 1%. If our test score lies in the Acceptance Zone, we fail to reject the Null Hypothesis. If our test score lies in the Critical Zone, we reject the Null Hypothesis and accept the Alternate Hypothesis.
Critical Value is the cut off value between Acceptance Zone and Rejection Zone. We compare our test score to the critical value and if the test score is greater than the critical value, that means our test score lies in the Rejection Zone and we reject the Null Hypothesis. On the other hand, if the test score is less than the Critical Value, that means the test score lies in the Acceptance Zone and we fail to reject the null Hypothesis.
But why do we need a p-value when we can reject/accept hypotheses based on test scores and critical values?
P-value has the benefit that we only need one value to make a decision about the hypothesis. We don’t need to compute two different values such as critical value and test scores. Another benefit of using the p-value is that we can test at any desired level of significance by comparing this directly with the significance level.
![p-value [z test and t test]](https://av-eks-blogoptimized.s3.amazonaws.com/Screenshot-from-2020-03-04-14-44-14.jpg)
This way, we don’t need to compute test scores and critical values for each significance level. We can get the p-value and directly compare it with the significance level of our interest.
Directional Hypothesis
In the Directional Hypothesis, the null hypothesis is rejected if the test score is too large (for right-tailed) or too small (for left-tailed). Thus, the rejection region for such a test consists of one part, which is on the right side for a right-tailed test; or the rejection region is on the left side from the center in the case of a left-tailed test.
![Directional hypothesis graph [z test and t test]](https://av-eks-blogoptimized.s3.amazonaws.com/Screenshot-from-2020-03-04-14-46-19.jpg)
Non-Directional Hypothesis
In a Non-Directional Hypothesis test, the Null Hypothesis is rejected if the test score is either too small or too large. Thus, the rejection region for such a test consists of two parts: one on the left and one on the right. This is a case of a two-tailed test.
![Non-directional hypothesis graph [z test and t test]](https://av-eks-blogoptimized.s3.amazonaws.com/Screenshot-from-2020-03-04-14-48-36.jpg)
What is the Z-Test Statistic?
z tests are a statistical way of testing a Null Hypothesis when either:
- We know the population variance, or
- We do not know the population variance, but our sample size is large n ≥ 30
If we have a sample size of less than 30 and do not know the population variance, we must use a t-test. This is how we judge when to use the z-test vs the t-test. Further, it is assumed that the z-statistic follows a standard normal distribution. In contrast, the t-statistics follows the t-distribution with a degree of freedom equal to n-1, where n is the sample size.
It must be noted that the samples used for z-test or t-test must be independent sample, and also must have a distribution identical to the population distribution. This makes sure that the sample is not “biased” to/against the Null Hypothesis which we want to validate/invalidate.
Examples of Z Test
One-Sample Z-Test
We perform the One-Sample z-Test when we want to compare a sample mean with the population mean.![Z-score formula [z test]](https://av-eks-blogoptimized.s3.amazonaws.com/Screenshot-from-2020-03-04-11-06-38.jpg)
Here’s an Example to Understand a One Sample z-Test
Let’s say we need to determine if girls on average score higher than 600 in the exam. We have the information that the standard deviation for girls’ scores is 100. So, we collect the data of 20 girls by using random samples and record their marks. Finally, we also set our ⍺ value (significance level) to be 0.05.

In this example:
- Mean Score for Girls is 641
- The number of data points in the sample is 20
- The population mean is 600
- Standard Deviation for Population is 100
![Z score, p-value, and critical value example [z test and t test]](https://av-eks-blogoptimized.s3.amazonaws.com/Screenshot-from-2020-03-04-14-54-51.jpg)
Since the P-value is less than 0.05, we can reject the null hypothesis and conclude based on our result that Girls on average scored higher than 600.
Two-Sample Z-Test
We perform a Two Sample z-test when we want to compare the mean of two samples.![Z score calculation [z test]](https://av-eks-blogoptimized.s3.amazonaws.com/Screenshot-from-2020-03-04-11-50-51.jpg)
Here’s an Example to Understand a Two Sample Z-Test
Here, let’s say we want to know if Girls on an average score 10 marks more than the boys. We have the information that the standard deviation for girls’ Score is 100 and for boys’ score is 90. Then we collect the data of 20 girls and 20 boys by using random samples and record their marks. Finally, we also set our ⍺ value (significance level) to be 0.05.

In this example:
- Mean Score for Girls (Sample Mean) is 641
- Mean Score for Boys (Sample Mean) is 613.3
- Standard Deviation for the Population of Girls’ is 100
- Standard deviation for the Population of Boys’ is 90
- Sample Size is 20 for both Girls and Boys
- Difference between Mean of Population is 10
![Two-sample z-score calculations [z-test]](https://av-eks-blogoptimized.s3.amazonaws.com/Screenshot-from-2020-03-04-15-03-22.jpg)
Thus, we can conclude based on the p-value that we fail to reject the Null Hypothesis. We don’t have enough evidence to conclude that girls on average score of 10 marks more than the boys. Pretty simple, right?
What is the T-Test?
T-tests are a statistical way of testing a hypothesis when:
- We do not know the population variance
- Our sample size is small, n < 30
Examples of T Test
One-Sample T-Test
We perform a One-Sample t-test when we want to compare a sample mean with the population mean. The difference from the z-Test is that we do not have the information on Population Variance here. We use the sample standard deviation instead of population standard deviation in this case.
![t score formula [t test]](https://av-eks-blogoptimized.s3.amazonaws.com/Screenshot-from-2020-03-04-15-11-01.jpg)
Here’s an Example to Understand a One Sample T-Test
Let’s say we want to determine if on average girls score more than 600 in the exam. We do not have the information related to variance (or standard deviation) for girls’ scores. To a perform t-test, we randomly collect the data of 10 girls with their marks and choose our ⍺ value (significance level) to be 0.05 for Hypothesis Testing.

In this example:
- Mean Score for Girls is 606.8
- The size of the sample is 10
- The population mean is 600
- Standard Deviation for the sample is 13.14
![t score calculation [t test]](https://av-eks-blogoptimized.s3.amazonaws.com/Screen-Shot-2020-06-19-at-12.jpg)
Our p-value is greater than 0.05 thus we fail to reject the null hypothesis and don’t have enough evidence to support the hypothesis that on average, girls score more than 600 in the exam.
Two-Sample T-Test
We perform a Two-Sample t-test when we want to compare the mean of two samples.
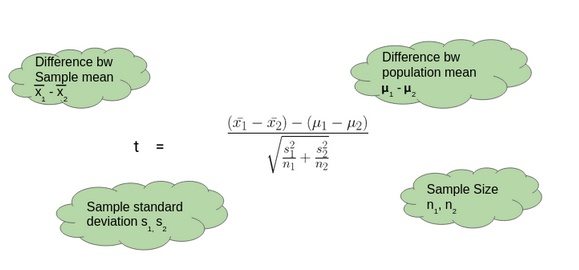
Here’s an Example to Understand a Two-Sample T-Test
Here, let’s say we want to determine if on average, boys score 15 marks more than girls in the exam. We do not have the information related to variance (or standard deviation) for girls’ scores or boys’ scores. To perform a t-test. we randomly collect the data of 10 girls and boys with their marks. We choose our ⍺ value (significance level) to be 0.05 as the criteria for Hypothesis Testing.

In this example:
- Mean Score for Boys is 630.1
- Mean Score for Girls is 606.8
- Difference between Population Mean 15
- Standard Deviation for Boys’ score is 13.42
- Standard Deviation for Girls’ score is 13.14

Thus, p-value is less than 0.05 so we can reject the null hypothesis and conclude that on average boys score 15 marks more than girls in the exam.
Deciding Between Z-Test and T-Test
So when should we perform the z-test, and when should we perform the t-Test? It’s a critical question we need to answer if we want to master statistics.

If the sample size is large enough, then the z-Test and t-Test will conclude with the same results. For a large sample size, Sample Variance will be a better estimate of Population variance, so even if population variance is unknown we can use the z-test using sample variance.
Similarly, for a Large Sample, we have a high degree of freedom. And since t-distribution approaches the normal distribution, the difference between the z score and t score is negligible.
Z Test vs T Test
| Z Test | T Test | |
|---|---|---|
| Assumption | Population standard deviation is known | Population standard deviation is unknown |
| Sample Size | Large sample size (n > 30) | Small sample size (n < 30) |
| Distribution | Z-distribution | T-distribution |
| Test Statistic | (Sample mean – Population mean) / (Population SD / √n) | (Sample mean – Population mean) / (Sample SD / √n) |
| Hypothesis Testing | Test for a population mean or proportion | Test for a population mean |
| Degrees of Freedom | Not applicable | n – 1 |
| Application | Used when the population standard deviation is known and the sample size is large | Used when the population standard deviation is unknown or the sample size is small |
| Example | Testing whether the average height of male adults is significantly different from a known value | Testing whether a new teaching method improves student test scores compared to the old method |
Case Study: Hypothesis Testing for Coronavirus Using Python
Now let’s implement the Two-Sample z-test for a coronavirus dataset. Let’s put our theoretical knowledge into practice and see how well we can do. You can download the dataset here.
This dataset has been taken from John Hopkin’s repository and you can find the link here for it.
This dataset here the below features:
- Province/State
- Country/Region
- Last Update
- Confirmed
- Deaths
- Recovered
- Latitude
- Longitude
And we have added the feature of Temperature and Humidity for Latitude and Longitude using Python’s Weather API – Pyweatherbit. A common perception about COVID-19 is that Warm Climate is more resistant to the corona outbreak and we need to verify this using Hypothesis Testing. So what will our null and alternate hypothesis be?
- Null Hypothesis: Temperature doesn’t affect COV-19 Outbreak
- Alternate Hypothesis: Temperature does affect COV-19 Outbreak
Note: We are considering Temperature below 24 as Cold Climate and above 24 as Hot Climate in our dataset.
Python Code:
We have used the “stats” module of the “scipy” package to calculate our critical value of the test statistic, as well as the p-value. From these values, we conclude that we do not have evidence to reject our Null Hypothesis that temperature doesn’t affect the COV-19 outbreak. Although we cannot find the temperature’s impact on COV-19, this problem has just been taken for the conceptual understanding of what we have learned in this article. There are certain limitations of the z-test for COVID-19 datasets:
- Sample data may not be well representative of population data
- Sample variance may not be a good estimator of the population variance
- Variability in a state’s capacity to deal with this pandemic
- Socio-Economic Reasons
- Early breakout in certain places
- Some states could be hiding the data for geopolitical reasons
So, we need to be more cautious and research more to identify the pattern of this pandemic.
Conclusion
In this article, we followed a step-by-step procedure to understand the fundamentals of Hypothesis Testing, Type 1 Error, Type 2 Error, Significance Level, Critical Value, p-Value, Non-Directional Hypothesis, Directional Hypothesis, z-Test, and t-Test. Finally, we implemented a Two Sample z-Test for a coronavirus case study.
Key Takeaways
- Z-Test & T-Tests are Parametric Tests, where the Null Hypothesis is less than, greater than or equal to some value.
- A z-test is used if the population variance is known, or if the sample size is larger than 30, for an unknown population variance.
- If the sample size is less than 30 and the population variance is unknown, we must use a t-test.
For more details you can also read these articles:
- Your Guide to Master Hypothesis Testing in Statistics
- Statistics for Data Science: Introduction to t-test and its Different Types (with Implementation in R)
- Introduction to Business Analytics
- Introduction to Data Science
Frequently Asked Questions
A. A z-test is used to test a Null Hypothesis if the population variance is known, or if the sample size is larger than 30, for an unknown population variance. A t-test is used when the sample size is less than 30 and the population variance is unknown.
A. A one-tailed ztest allows for the possibility of rejection of the Null Hypothesis in only one direction, whereas a two-tailed ztest tests the possibility of rejection in both directions (left and right).
A. It is assumed that the z-statistic follows a standard normal distribution, whereas the t-statistic follows the t-distribution with a degree of freedom equal to n-1, where n is the sample size


For the one-sample T-test, shouldn't critical value > t-score (1.833 > 1.64)?
Hi Catherine, Thanks for notifying the typo, we have updated it.
Thank you for the nice article . clearly explained. One clarification please so the type 1error is not in favor of the person when is actually innocent ?
Thank you for the nice article . clearly explained. One clarification please so the type 1error is not in favor of the person when is actually innocent ?
Yes, Type 1 error is a rejection of Null Hypothesis even if it's true (verdict against the Person even if he is innocent) which is also the False Positive.
Hi Subhash, well written article! Thanks
Thanks, Dhruv.
very very true
Hello, You said that "As you can clearly see, there can be two types of error in the judgment – Type 1 error, when the verdict is against the person while he was innocent and Type 2 error, when the verdict is in favor of Person while he was guilty". I think it's the other way around (inverse)...... Thanks, Vlad
Thoughtful... Well explained.... Great content।
Nice Article. Very well explained!
Thanks, Amit.
Nice article. I think two-sample Z-test computations are wrong.
Hi Ashish, Thanks for your feedback. Would you please highlight the compuatations you found wrong?
I try to download the dataset, but the Google Drive link is not working. Could you please repair the link. Since I don't have any expertise in Pyton, I cannot add temperature and humidity to the initial dataset using Python’s Weather API. Does the dataset (Corona_Updated.csv) contain these two parameters? Anyway, I found the article very informative. Thank you!
Hi! For the two sample t-test example, I'm getting t= 1.40 not t = 2.23. In this case we would not reject the null hypothesis. Thanks so much for all your work!
Hi Gerald, Thanks for the feedback, Would you please tell me your computation technique. Are you performing one-tailed (Unidirectional) hypothesis testing?
When sample size > 30, we use Z-test, but why in the example showing sample size of 20 for this?
Hi Fahim, We use the Z test if the sample size is greater than 30 or population variance is known (very unlikely in real-life scenarios).
For 2 Sample t-test/Z-test, will the calculations be any different if n is different for both samples?
For the 2 tailed T-Test, should not the critical value be 1.734 instead of 1.833 that you have mentioned as df is 18??
Hi, I know for the Z critical value, we typically use the table in the back of the book but how do we find the T critical value? Thanks!
Hi, Please let know how critical value is calculated which is mentioned in the examples given in the article.
nice but why more then 30
Hi, In the example to Understand a One Sample Z Test how have we taken null hypothesis to be <= 600 if the claim is that girls score more than 600. After finding z value had I wrongly assumed alternative hypothesis to be null hypothesis all my analysis will gone wrong. How can I prevent that?
Thank you for this beautiful write up, I love it soo much. Regards
[…] https://www.analyticsvidhya.com/blog/2020/06/statistics-analytics-hypothesis-testing-z-test-t-test/ […]
[…] 原文链接:https://www.analyticsvidhya.com/blog/2020/06/statistics-analytics-hypothesis-testing-z-test-t-test/ […]
This article seems desperate to prove girls are more intelligent that boys? Why the blatant sexism?
Who ever wrote this , truly deserves a raise
What a piece this this. About 5 hours of lectures made easy in one reading. Incredibly easy to read so so understandable and light to take in. What a job well done here...fantastic
I found this blog post very helpful. Thank you for writing it!
Thank you, best explanation ever!
Thank you for this helpful article!
One of the few articles that helps in understanding these concepts better. Thank you.