Complete R Tutorial To Build Probabilistic Graphical Models!
This article was published as a part of the Data Science Blogathon.
Introduction:
Probabilistic Graphical Models (PGM) capture the complex relationships between random variables to build an innate structure. This structure consists of nodes and edges, where nodes represent the set of attributes specific to the business case we are solving, and the edges signify the statistical association between them.
But, why can’t we use the conventional ML models, what is so different about PGM? Constructing the network structure of the underlying model is what makes PGM stand apart from the conventional Machine Learning models.
What can we do with this structure?
Ok, so we are emphasizing a lot on this structure, but what is so special about it? Well, the structure carries the belief (embedded in the conditional probability distribution (CPD) tables) about how different variables are related to each other.
We can leverage the independence properties to compactly represent the high dimensional data model via an intuitive diagram, which further helps to carry out the inferences and generate business insights.
As we will primarily build Bayesian Network in this article, it is important to get familiar with the 2 types of Networks:
Bayesian: It is one of the most classical graphical models. Also called as Directed Acyclic Graphs (DAGs), where the direction of the edges represent the direct influence of one variable over another. The flow of the probabilistic influence between the variables in such networks is signaled from the direction of the edge.
Markov: It is an undirected graph where the presence of the edge only represents the association between the two variables, but not the cause and effect relationship.
A 3-step process to create and learn the network
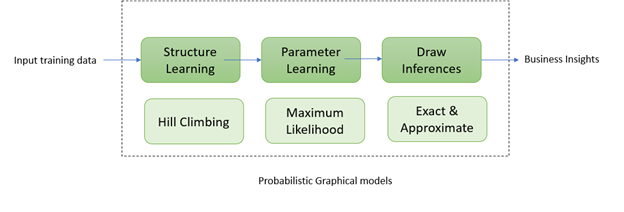
Let’s understand each of the steps briefly before starting to implement them in python:
1) Structure Learning:
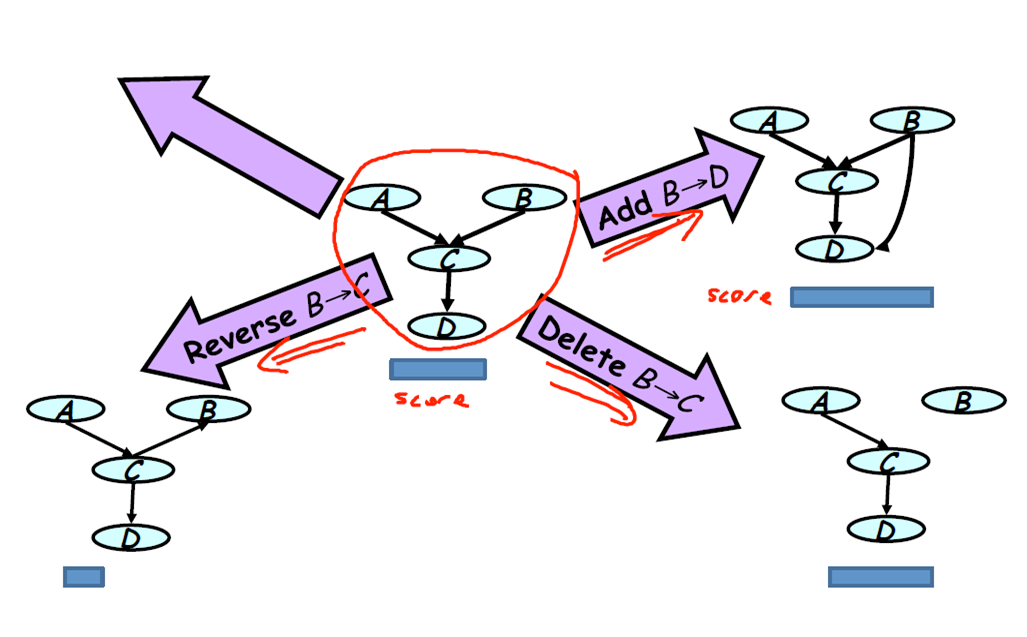
We will use a score-based structure learning algorithm known as Hill-Climbing optimization to construct the network structure. The process typically involves starting with an initial structure.
Now, over the space of all possible candidate network structures, we can perform three possible operations i.e. add, delete or reverse the edge.
Starting from an initial structure, keep performing the three operations in the direction that leads to an increase in score. The algorithm starts to converge and hence stops the search of a better structure when the score does not improve further.
Bayesian Information Criterion is the commonly used score.
2) Parameter Learning:
It is the process of learning the distributions of the network from the underlying data model. The conditional distribution of each node needs to be specified given its parents to build the full Bayesian network. The parameter estimation techniques are adopted to estimate the unknown parameters needed to compute the conditional distributions.
We are using the Maximum Likelihood Estimation method to estimate the parameters of the probability distribution such that the observed data is most probable. And, the point in the parameter space that maximizes the likelihood function is called the maximum likelihood estimate.
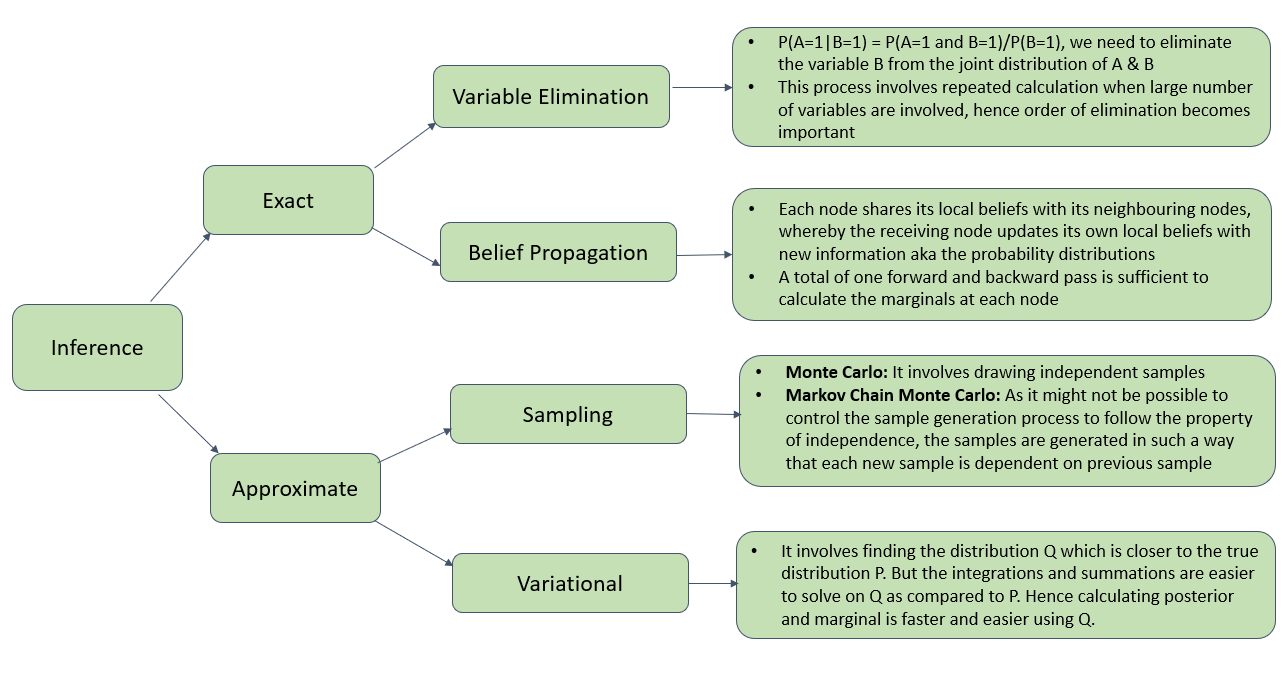
3) Inference:
Applications of Graphical models:
1) Fault Diagnosis: Microsoft built a troubleshooting wizard with the intent to cut down the support staff costs and giving users the flexibility to debug on their own.

2) Medical Diagnosis: Bayesian network for medical diagnosis of lung disease
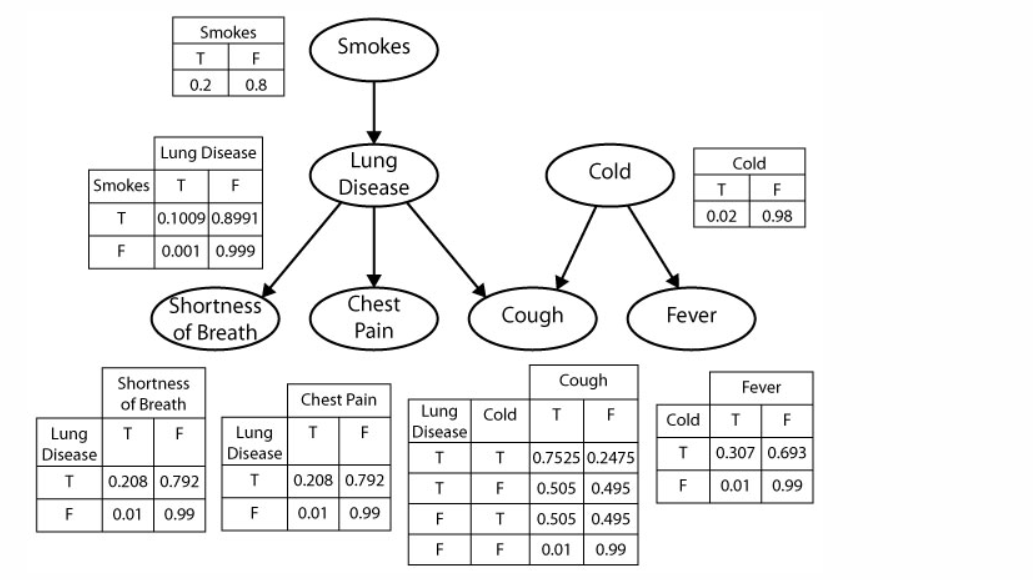
http://probmods.org/chapters/dependence.html
Probabilistic Graphical Models (PGM) capture the complex relationships between random variables to build an innate structure. finds application in information extraction, speech recognition, computer vision, and many more.
Now that we have covered the key aspects of the graphical models, we will quickly check its uniqueness quotient by experimenting with a dataset.
We will work on the Heart Disease dataset with medical conditions sourced from here.
The data consists of 4300 records, 15 features, and looks like below:
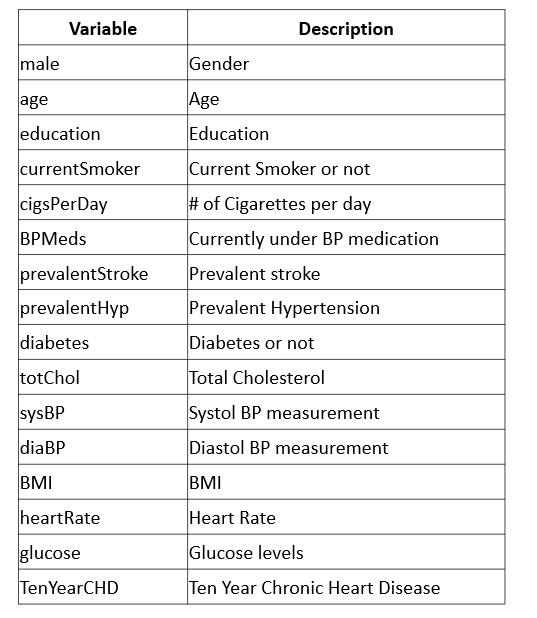
We need to pre-process the data in the form of missing value imputation and factorizing the variables.
We train the network using cross-validation with the objective to minimize the loss and fitted the model. The Bayesian network constructed from the historical data looks like below:
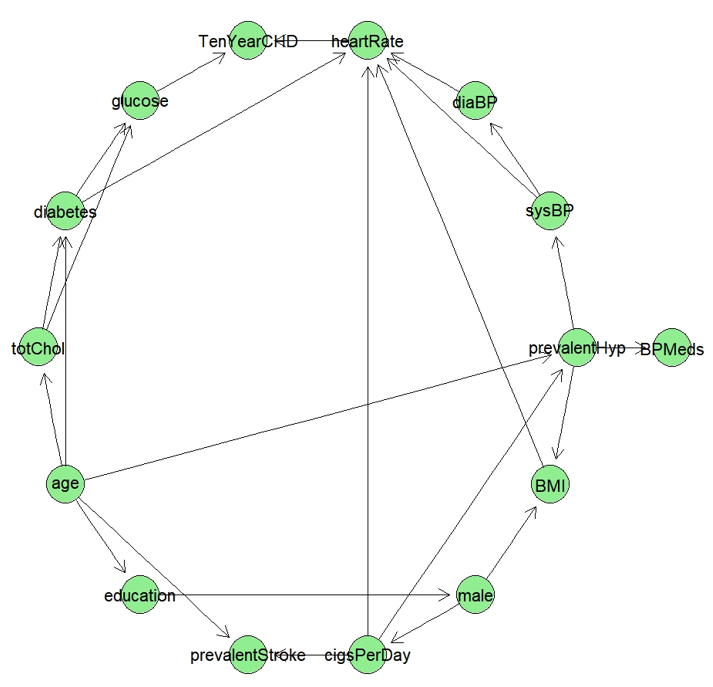
The trained model object is then queried to generate business insights, some of the examples are shown below:
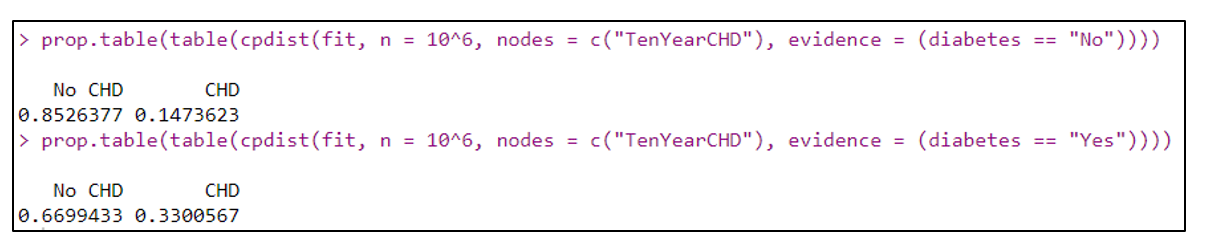
Inference 1: The probability of the diabetic person having Chronic Heart Disease (CHD) is 33% as compared to 15% for a person with no diabetic history.
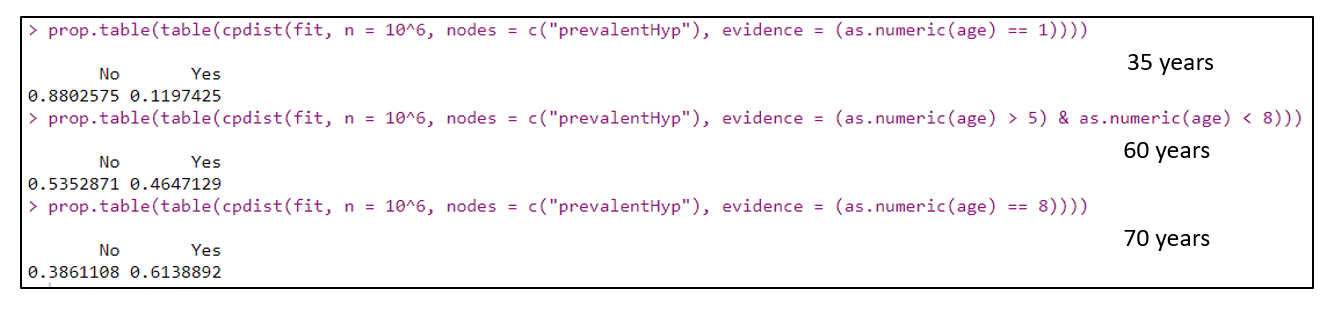
Inference 2: The probability of the person having ‘Prevalent Hypertension’ increases with age.
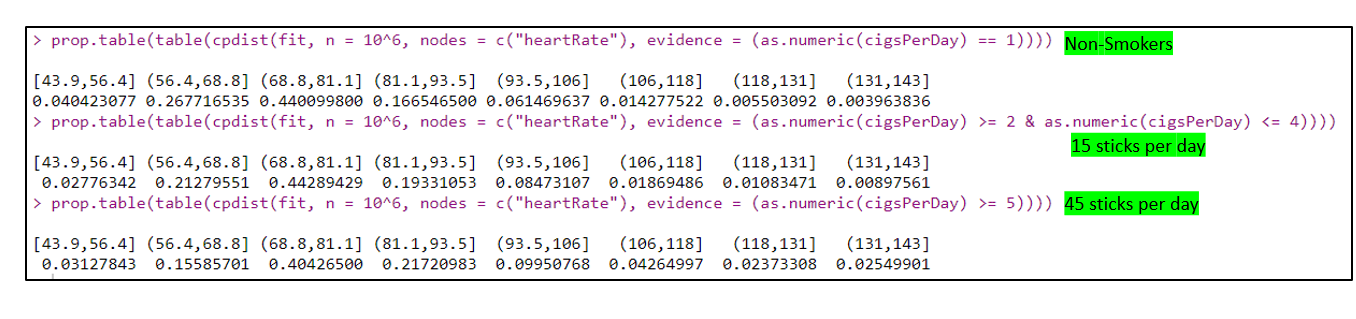
Inference 3: The distribution of the ‘Heart Rate’ changes as follows with the number of cigarettes a person consumes per day.
Hope you enjoyed reading the article. There is much more that can be done with the power of Graphical models. The complete R code is placed here.
Happy Reading!!!
References:
https://en.wikipedia.org/wiki/Maximum_likelihood_estimation


Awesome article Maanvi! Very informative
Very interesting, good job and thanks for sharing such a good article.