How to Improve Your Business With Exploratory Data Analysis!
This article was published as a part of the Data Science Blogathon.
Introduction
Exploratory Data Analysis is an approach to discover the insights in the data. It is one of the best practices in data science today. People generally confused with the key difference between Data analysis and Exploratory Data Analysis. You won’t see any big difference but these two have different purposes.

Exploratory Data Analysis is a complement to inferential statistics where it is mixed with rigid rules and formulas whereas, Data Analysis is the combination of statistics and probability to figure out the trends and patterns of the dataset.
EDA is the first step in the Data Analysis phase where you can manipulate the datasets to achieve the results. It is implemented before the statistical techniques applied to the datasets. Statistical techniques usually applied on the datasets with the histogram or box plots but EDA is not coming with a set of techniques or procedures. It is like a form of art than applying science.
EDA process makes the analyst get a feel about the dataset and used their ideas to judge the important elements in the dataset.
For example, in the multidimensional scaling, it is the visual representation of the distance of similarities between the set of objects. The user can find the exact distance between the objects by looking at the multidimensional representation.
Why EDA is necessary for business?
EDA is a crucial step before getting deep into machine learning or modeling your data to solve your business problems. It allows you to analyze the proper model to interpret the correct results.
The machine learning has more powerful advanced algorithms and so, people almost skip the Exploratory Data Analysis phase. People usually take advantage of algorithms and skip the EDA phase, where it is like feeding the data into the black box and look for better results.
Exploratory Data analysis provides a lot of crucial information where people usually miss and this information helps in the long run. EDA has been in the process long ago and it was developed in 1970 by John Turkey, the scientist who coined the word “Bit”. It is often described as philosophy as it had no hard or fast rules to approach it.
Purpose of EDA
The purpose of EDA is-
- Finding the missing and erroneous data
- Gain deep insights from the dataset
- Identify the important features in your dataset
- Perform hypothesis testing for the specific model
- Estimate the parameters and associated intervals.
Tools and techniques used in Exploratory Data Analysis
S+ and R are the most important statistical programming languages helpful to perform EDA better. It comes with a bundle of tool to perform functions like-
- Classification and Dimension reduction techniques
- Univariate Analysis
- Bivariate Analysis
- Multivariate Analysis
- Predictive Analysis
How EDA does helps your business?
Exploratory Data Analysis provides the most extreme value to the business by helping the Data scientist to interpret the correct results which match with the required business contexts. It also helps the stakeholders to check whether they have posted the right queries. They also come to know some interesting trends even they are not aware of its existence.
There are many data connectors available that help the companies to incorporate the EDA into Business Intelligence software. We can build and run the statistical models in R that use BI data to update the information automatically as flow with the model.
Let’s see some case study of Exploratory Data Analysis on E-Commerce
In the E-commerce world, we often want to know which customers, where they are coming from to place the most orders and spend their money. These insights help to drive the sale of the company.
Let’s explore the dataset which contains transactional data with customers from various countries who make purchases from UK based online retail company that sells occasional gifts.
- Company — UK-based and registered non-store online retail
- Products for selling — All occasion gifts
- Customers — Most of the merchants are wholesalers
- Transactions Period — 1st Dec 2010 to 9th Dec 2011 (One year)
Data Cleaning
In the real world, we all know that data is messy and it is necessary to clean the data before exploring the dataset.
Below is the snapshot of the original dataset.
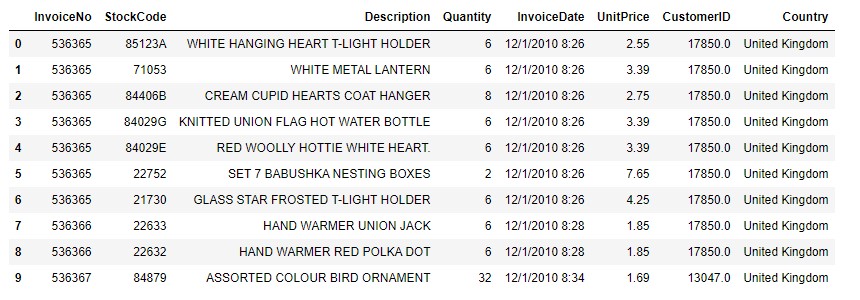
Below are the details about the features-
- InvoiceNo: Transaction number
- StockCode: Product code
- Description: Name of the product
- Quantity: Total number of products purchased for each transaction
- InvoiceDate: Timestamp for each transaction
- UnitPrice: Product price per unit
- CustomerID: Unique identifier for each customer
- Country: Country name
Let’s check any missing values present in the columns-

We can see that, there are some missing values present in the CustomerID and Description. The missing values present in the rows should be removed. The python provides you with the drop() to handle the missing values.
Let’s see some statistical information about the dataset. We can use describe() function. It will show the mean, std, and IQR values of continuous or discrete variables.
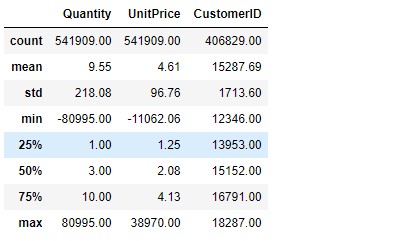
From this analysis, we can check that Quantity has negative values and UnitPrice has zero values. These values will not be possible. So we can remove the negative and zero values of the two variables.
In this dataset, we need to add extra features that help to gain deep insights about the sales.
We need to add the amount_spent variable. To calculate the total amount spent on each purchase, we can simply multiply the Quantity with UnitPrice.
In the E-commerce world, we often desire to know, which customers, where they come from- place the most order and spend the most money on their purchase. It helps to analyze and improve company sales.
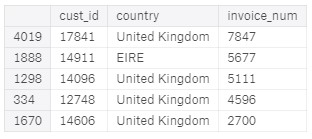
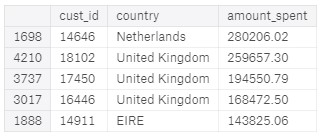
From the table, we can observe that the UK has the most number of orders and the Netherlands spends the highest amount of money on their purchases.
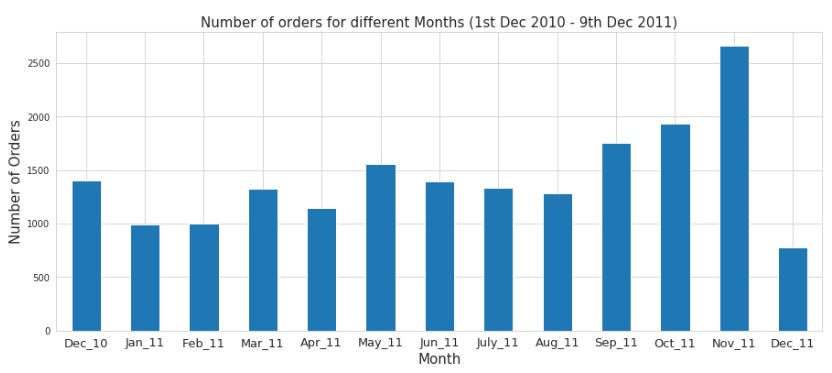
Likewise, with the above chart, we can observe that company receives the highest number of orders in November 2011. Likewise, we can do depth analysis with the help of purchase order datasets. We can use this EDA to validate the business assumptions and interpret the machine learning model to predict the sale next year.
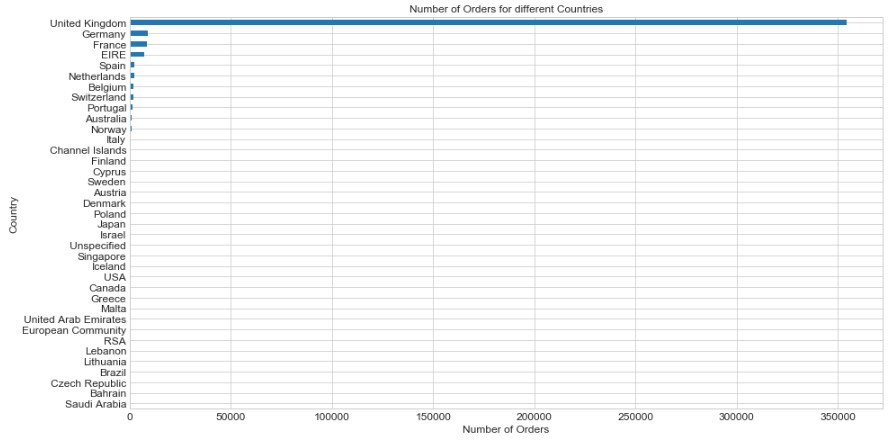
We can discover the transactional patterns for each country. This shows the number of orders in each country (with the UK)
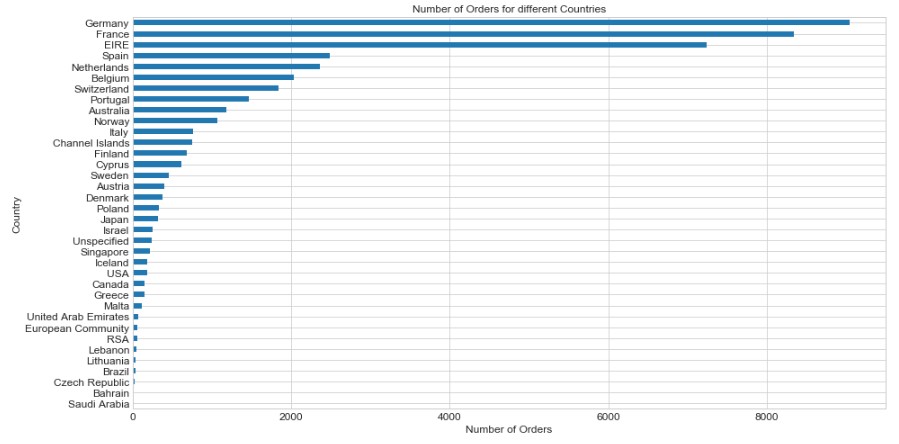
This shows the number of orders in each country (without the UK)
As a result, the company receives a higher number of orders from the UK, since it is a UK based company.
So, the TOP 5 countries (including the UK) that place the highest number of orders are as below:
- United Kingdom
- Germany
- France
- Ireland
- Spain
Let’s explore the top 5 countries with the highest money spent. This shows the number of money spent by each country (with the UK)
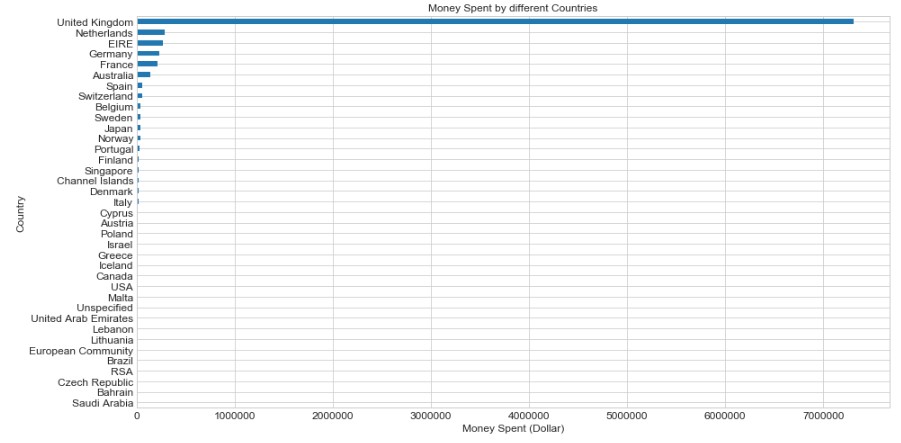
This shows the number of money spent by each country (without the UK)
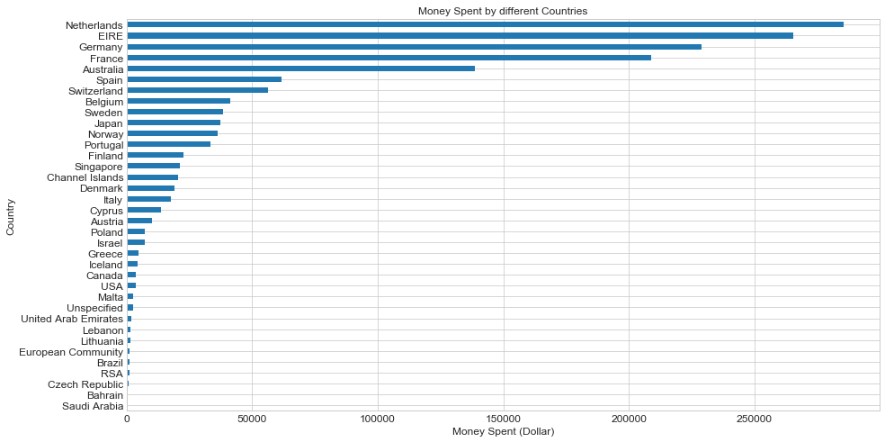
So, the TOP 5 countries (including the UK) that spend the most money on purchase are as below:
- United Kingdom
- Netherlands
- Ireland (EIRE)
- Germany
- France
Observation from EDA
The below-given points are observed from EDA,
- The customer with the highest number of orders comes from the United Kingdom (UK) and the second place by German
- The customer with the highest money spent on purchases comes from the United Kingdom (UK) and the second position goes to the Netherlands
- The TOP 5 countries (including the UK) that place the highest number of orders are as follow → the United Kingdom, Germany, France, Ireland (EIRE), Spain
- The TOP 5 countries (including the UK) that spend the most money on purchases are as follow → the United Kingdom, Netherlands, Ireland (EIRE), Germany, France
· The company receives the highest number of orders in November 2011.
We can identify interesting patterns by simply performing EDA. It is all about understanding your data before making any assumptions and also helps you to avoid using or building inaccurate models on the dataset.
Conclusion
Finally, Predictive analytics and machine learning are the important tools to analyze the dataset properly to interpret the results which are aligned with the business objectives.


