Nervous about your first data science project! Here are 6 easy steps to get started!
This article was published as a part of the Data Science Blogathon.
Introduction
We all have been hearing about the buzz word – “Data Science”. Most of us are intrigued about “what it is? What’s in there stored for me? Can I become a data analyst or data scientist? What skills do I need? I want to start a project in data science but I am not able to get the right start”.
Most of us have undertaken MOOC or online courses to get an idea of this domain and we are comfortable with the assignments and projects defined in the course curriculum. However, when it comes to starting analyzing a dataset that is completely new or unknown, we get lost in the path. To gain confidence in analyzing any dataset that comes our way, we require practice. So everyone needs to start one day. We might get lost in the process if we do not follow a disciplined approach.
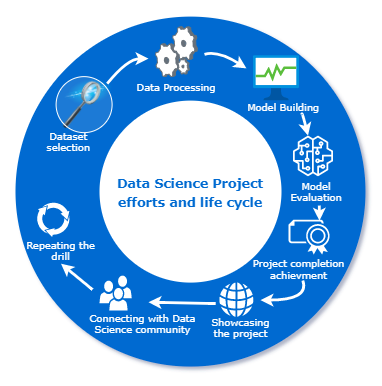
Steps to your First Data Science Project
In this article, let’s see a few tips, that you can use, to get started on your personal data science projects.
1. Choose a dataset
If you are taking up the data science project for the first time, choose a dataset of your interest. It can be related to sports, movies, or music – anything that interests you. The most common websites to get the data are:
- Kaggle Datasets
- UCI Repository
- Data World
- Government websites
- Scrape the data yourself
For those who have already done one project or two, end to end on their own following the above guidelines can target analyzing a complex dataset from a particular domain like retail, finance, or healthcare to get a feel of real-time projects.
For a start, I had selected a health insurance dataset to practice predictive analytics. I pulled the dataset from Kaggle website
! pip install -q kaggle
#from google.colab import files
#files.upload()
! mkdir ~/.kaggle
! cp kaggle.json ~/.kaggle/
! chmod 600 ~/.kaggle/kaggle.json
#! kaggle datasets download -d mirichoi0218/insurance
#! unzip insurance.zip -d health-insurance
! kaggle datasets download -d mirichoi0218/insurance
! unzip insurance.zip -d health-insurance
2. Choose an IDE
Select an IDE that you are most comfortable with. If you are using Python as a language, here are few examples
- Pycharm – It is an IDE designed to write Python codes. It provides various productive features like taking care of the routine, intelligent code completion, error checking and code fixes. It makes it easy to maintain the project by providing integration with version control features, supports web development as well as data science
- Jupyter Notebook – It is an open source web application that allows you to create and share documents that contain live code, equations, and visualization. It helps to streamline the work and make collaborations easier
- Google Colab – It allows users to write and execute Python codes. It is well suited for machine learning and data science projects as it offers computational resources for free. You can run heavy machine learning algorithms here with ease without having to worry about the infrastructure or the costs.
- Simple text file with .py extension – Although the above options are readily available and are easy to use but still if you are most comfortable with notepad to write your code, you can use it and save your file with .py extension. You can then run the same using a command line with syntax as “python <<filename>>.py. This will execute your program but for data science works this might not be the best option as you cannot see the output of the code or visualizations on the fly.
I selected Google Colab as the working environment
3. List down the activities clearly
Make a list of activities that you want to do on the dataset to have a clear path before you start. The common activities that we perform on data science projects are data ingestion, data cleaning, data transformation, exploratory data analysis, model building, model evaluation, and model deployment. Here is a brief about all these steps.
- Data ingestion – It is a process of reading the data into a dataframe
- Data cleaning – It is the process of identifying and removing the anomalies in the dataset
- Data Transformation – It involves changing the data type of the columns, creating derived columns or removing duplicate data to name a few
- Exploratory data analysis – Perform univariate and multi-variate analysis on the datasets to find hidden insights and patterns in them
I took up data cleaning and exploratory data analysis of numerical and categorical variables on separate days to focus on the details
#Visualizing age column with a histogram
fig,axes=plt.subplots(1,2,figsize=(10,5))
sns.histplot( health_ins_df['age'] , color="skyblue",ax=axes[0])
sns.histplot( health_ins_df['bmi'] , color="olive",ax=axes[1])
plt.show()
#Visualizing age column with a boxplot
fig,axes=plt.subplots(1,2,figsize=(10,5))
sns.boxplot(x = 'age', data = health_ins_df, ax=axes[0])
sns.boxplot(x = 'bmi', data = health_ins_df, ax=axes[1])
plt.show()
#Finding the outlier values in the bmi column
outlier_list = boxplot_stats(health_ins_df.bmi).pop(0)['fliers'].tolist()
print(outlier_list)
#Finding the number of rows containing outliers
outlier_bmi_rows = health_ins_df[health_ins_df.bmi.isin(outlier_list)].shape[0]
print("Number of rows contaning outliers in bmi : ", outlier_bmi_rows)
#Percentage of rows which are outliers
percent_bmi_outlier = (outlier_bmi_rows/health_ins_df.shape[0])*100
print("Percentage of outliers in bmi columns : ", percent_bmi_outlier)
#Converting age into age brackets
print("Minimum value for age : ", health_ins_df['age'].min(),"nMaximum value for age : ", health_ins_df['age'].max())
#Age between 18 to 40 years will fall under young
#Age between 41 to 58 years will fall under mid-age
#Age above 58 years will fall under old age
health_ins_df.loc[(health_ins_df['age'] >=18) & (health_ins_df['age'] <= 40), 'age_group'] = 'young'
health_ins_df.loc[(health_ins_df['age'] >= 41) & (health_ins_df['age'] <= 58), 'age_group'] = 'mid-age'
health_ins_df.loc[health_ins_df['age'] > 58, 'age_group'] = 'old'

fig,axes=plt.subplots(1,5,figsize=(20,8))
sns.countplot(x = 'sex', data = health_ins_df_clean, palette = 'magma',ax=axes[0])
sns.countplot(x = 'children', data = health_ins_df_clean, palette = 'magma',ax=axes[1])
sns.countplot(x = 'smoker', data = health_ins_df_clean, palette = 'magma',ax=axes[2])
sns.countplot(x = 'region', data = health_ins_df_clean, palette = 'magma',ax=axes[3])
sns.countplot(x = 'age_group', data = health_ins_df_clean, palette = 'magma',ax=axes[4])
heatmap = sns.heatmap(health_ins_df_clean.corr(), vmin=-1, vmax=1, annot=True)
sns.relplot(x="bmi", y="charges",hue="sex", style = "sex", data=health_ins_df_clean);
sns.boxplot(x="smoker", y="charges", data=health_ins_df_clean)
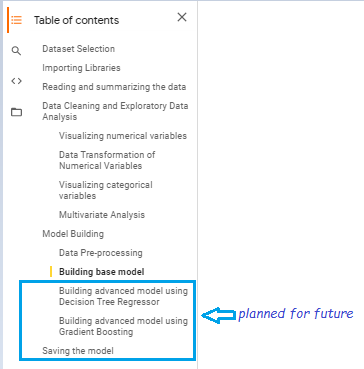
- Model building – Try and test all possible models on the dataset before you choose the right one based on business/technical constraints. During this phase, you can try some bagging or boosting techniques as well
I developed a base model first, before trying any advanced model on the dataset
#Data Pre-processing
#Converting categorical values into dummies using one-hot encoding technique
health_ins_df_processed = pd.get_dummies(health_ins_df_clean, columns=['sex','children','smoker','region','age_group'], prefix=['sex','children','smoker','region','age_group'])
health_ins_df_processed.drop(['age'],axis = 1,inplace=True)
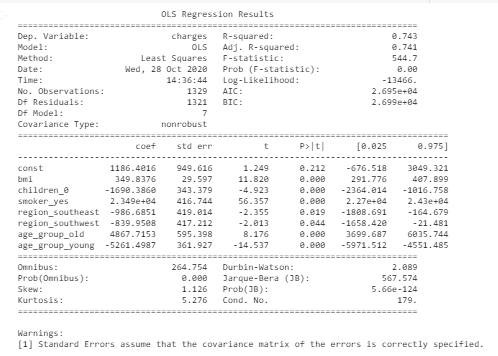
#Building linear regression model
X = health_ins_df_processed.loc[:, health_ins_df_processed.columns != 'charges']
y = health_ins_df_processed['charges']
X_train, X_test, y_train, y_test = train_test_split(X, y, test_size=0.33)
X = sm.add_constant(X) # adding a constant
model = sm.OLS(y, X).fit()
predictions = model.predict(X)
print_model = model.summary()
print(print_model)
#Final model after eliminating variable with least significance and high vif
X = health_ins_df_processed[['bmi','children_0', 'smoker_yes',  'region_southeast', 'region_southwest', 'age_group_old', 'age_group_young']]
y = health_ins_df_processed['charges']
X_train, X_test, y_train, y_test = train_test_split(X, y, test_size=0.33)
X = sm.add_constant(X) # adding a constant
model = sm.OLS(y, X).fit()
predictions = model.predict(X)
print_model = model.summary()
print(print_model)
- Model evaluation – In this phase, we test if our model is good enough to get a predicted result. We measure accuracy, specificity, sensitivity, or adjusted R-square depending on the model that we have used
This is the final evaluation metric of the base model which shows 74% accuracy and 7 significant variables (p-value < significance value)
4. Take up the tasks one by one
By now, you must have got an idea of what activities to perform in your project. You can take these up, one by one. Not necessarily, you have to complete everything in a day. You can take up 1 day of time to decide on which dataset you want to work on and which environment you are comfortable with.
You can dedicate day-2 to understanding the data and taking up the data cleaning activities. Likewise, you can target to complete your project in a span of 7-8 days.
I have done this project in a span of 4 days. I have planned trying out of few more advanced models to increase the predictive performance
5. Prepare a summary
Maintain a document to briefly explain the project and the steps you have undertaken to complete the project. Try to summarize the business problem statement and the data science solution that you designed. You can also mention vivid details about the project for reference in the future.
You can use a simple word document or a powerpoint presentation to prepare a summary. It can have 5 sections. In the first section, briefly explain what is the problem statement. In the 2nd section, mention what is the dataset that you are using for predictive analytics and what is the source of the data. In the 3rd section mention, what are the data cleaning, data transformations, and exploratory data analysis you performed? In the next section mention briefly the proof-of-concepts on different predictive modeling that you tried and tested. In the last section, you can mention the final outcome and solution to the business problem.
Please note that this documentation can serve the purpose of revisiting your work in the future. You can also share it with other data science enthusiasts showcasing the case studies that you have undertaken. It can also help in summarizing your work during the interviews.
I will be preparing a short summary after this project is completed
6. Share it on open source platforms
Choose an open source platform where you want to release the project summary or codes so that you can gain visibility in the data science community and connect with fellow enthusiasts. GitHub is most commonly used these days. There are few websites like Kaggle, Google Colab which offer online kernels for you to write code and execute them without having to worry about infrastructure. You can leverage these platforms as well.
The source code is available on my GitHub account
The advantages of taking up the projects stepwise
I learned that we must follow a disciplined approach to learning and invest our time in doing the projects. All of us learn the most, by doing things practically. Ultimately it is the hard work and persistence that will take you down the road that you have always dreamt of paving!!


