A Measure of Bias and Variance – An Experiment
This article was published as a part of the Data Science Blogathon.
Introduction
One of the most used matrices for measuring model performance is predictive errors. The components of any predictive errors are Noise, Bias, and Variance. This article intends to measure the bias and variance of a given model and observe the behavior of bias and variance w.r.t various models such as Linear Regression, Decision Tree, Bagging, and Random Forest for a given number of sample sizes.
Prerequisite
1. Understanding Bias and Variance
2. Algorithms such as Linear Regression, Decision Tree, Bagging with Decision Tree, Random Forest, and Ridge Regression
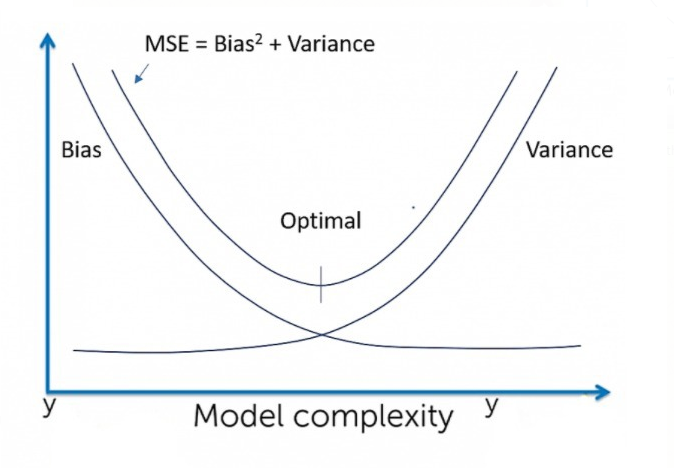
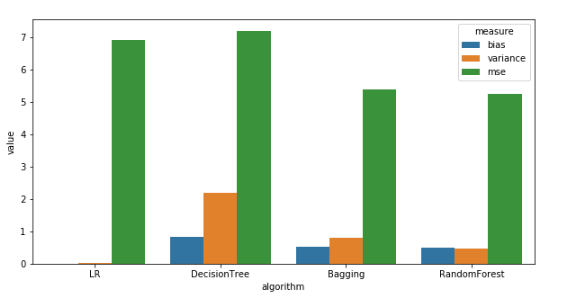
Brief of Bias and Variance
Bias: Difference between the prediction of the true model and the average models (models build on n number of samples obtained from the population).
True Model: Model builds on a population data
Average Model: Average of all the prediction results obtained from the various sample obtained from the population model.
Variance: Difference between the prediction of all the models obtained from the sample with the average model.
Noise: It is the irreducible error that a model cannot predict.
Expected behavior
|
|
|
| Linear Regression | High Bias | Less Variance |
| Decision Tree | Low Bias | High Variance |
| Bagging | Low Bias | High Variance, lesser than Decision tree |
| Random Forest | Low Bias | High Variance, lesser than Decision tree and Bagging |
Experiment
Practically it is very difficult and expensive to obtain population data. Without the knowledge of population data, it is not possible to compute the exact bias and variance of a given model. Although the changes in bias and variance can be realized on the behavior of train and test error of a given model.
So, to perform this experiment, we will consider a large dataset to be population. Based on this assumption we will proceed in calculating the bias and variance of the various model on this dataset.
About Data
For this example, I am considering a random dataset (dataset is not picked by any criteria).
You can download the dataset from here.
This is a data set of Physicochemical Properties of Protein Tertiary Structure. The data set is taken from CASP 5-9. There are 45730 decoys and sizes varying from 0 to 21 Armstrong.
Attribute: RMSD-Size of the residue.
F1 – Total surface area.
F2 – Non-polar exposed area.
F3 – Fractional area of exposed non-polar residue.
F4 – Fractional area of an exposed non-polar part of the residue.
F5 – Molecular mass-weighted exposed area.
F6 – Average deviation from the standard exposed area of residue.
F7 – Euclidian distance.
F8 – Secondary structure penalty.
F9 – Spatial Distribution constraints (N, K Value).
This dataset contains 45730 number of records.
Population_Data :
Superset of all data (Practically it’s not possible, but for the sake of experiment we are considering a large set of data to be our population). In this experiment, we consider a data set with 45730 records as a population.
Test_Data:
1500 records are extracted from the Population_Data as Test data.
Training_Data:
Data from the population other than test data are considered as Training_Data.
Population_Model:
The model built on the Population_Data.
Mean_Model:
Consider the ‘n’ number of samples being extracted from Training_Data. We build models on each of these samples. For a given value of x, the mean prediction of these models is considered as predictions of the Mean_Model for that value of x.
Model_Bias:
Bias for each value of x from test data = (Prediction of Population_Model – Prediction of Mean_Model).
The bias of the model = Mean (abs (Prediction of Population_Model – Prediction of Mean_Model))
Model_Variance :
The variance of the model = Variance (Prediction of Mean_Model, Prediction of Sample_Model)
i.e. Difference between the prediction of each model obtained from various samples and the prediction value of the mean model followed by squared and mean of the obtained value. Gives us the info of how much the models from the sample vary from the mean model.
Steps were undertaken for the experiment (Pseudocode):
1) Considering a data set of 45730 as Population_Data
2) Extracting Test_Data of 1500 records from Population_Data. So, the remaining data is considered to be Training_Data
3) Build Population_Model. Collect predictions from the Population_Model using Test_Data
4) Build Mean_Model.
30 random samples have been extracted from Training_Data. Models are built on each of these samples. The mean predictions using Test_Data of these models are collected.
5) Compute Model_Bias
The bias of the model = Mean (abs(Prediction of Population_Model – Prediction of Mean_Model))
6) Compute Model_Variance:
Model_Variance = Var (Prediction of Mean_Model, Prediction of Sample_Model)
The code for the below-generated results is available in this GitHub link.
The Model_Bias and Model_Variance are being collected for different algorithms such as Linear Regression, Decision Tree, Bagging, Random Forest.
Results of the Experiment:
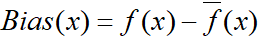
Bias and Variance for a sample size of 8000
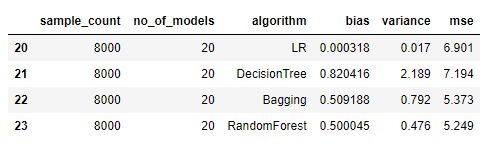
Observations: (For a sample size of 8000)
- Linear Regression has the least Bias which is not as expected. This hints to us that the data is more suited for Linear Regression.
- Variance: Linear Regression < Random Forest < Bagging < Decision Tree, which is as expected.
- Bias: Random Forest < Bagging < Decision Tree, which is also as expected.
Bias and Variance for sample sizes:[100, 500, 1000, 2000, 4000, 8000, 10000]
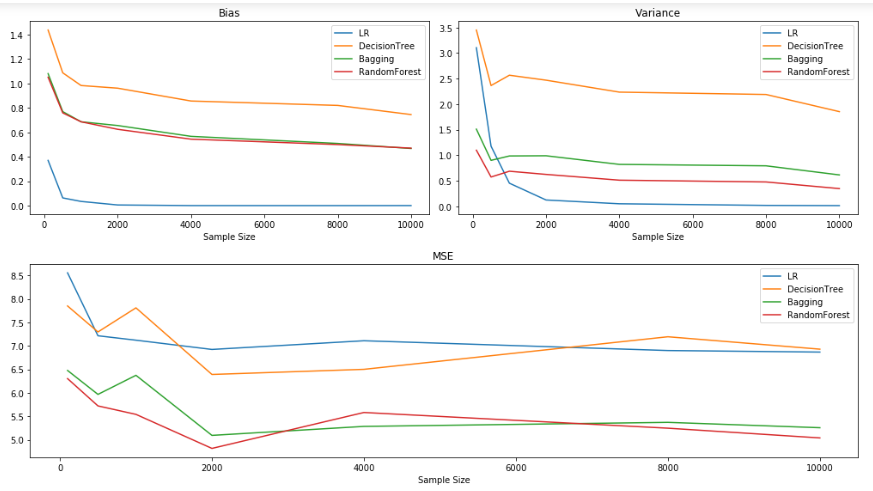
Observations:
It could be observed that the increase in the sample size aids in a decrease in Bias and Variance. But often it is quite expensive to obtain data with a higher sample size. So, increasing the sample size might not be a viable solution for reducing the bias and variance of the model.
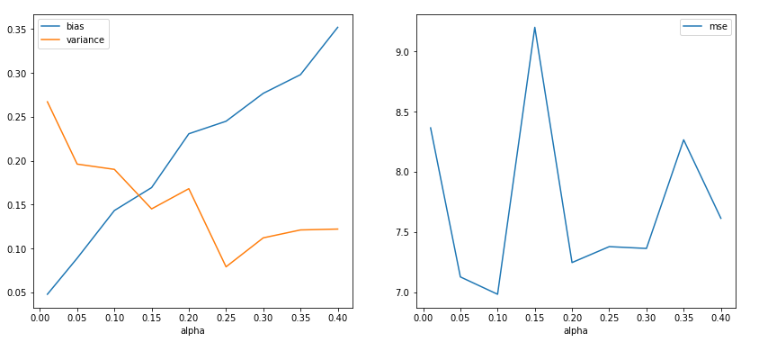
Ridge Regression for a sample of 1000
- Observing changes in Bias and Variance with various values of alpha for a sample of 1000.
- Visually enables us to view the bias and variance trade-off point. In an ideal scenario, the alpha value is a tuning parameter i.e. model is trained with various values of alpha, and cross-validation scores are recorded and the alpha which gives us the best score is selected for the best model.
- As per the figure below, it can be observed that with the increase in the value of alpha, bias value increases and the variance decreases. (This graph is in line with the graph portrayed in the book ISLR, Chapter 6: Linear Model Selection and Regularization, Figure 6.17)
Conclusions & Observations
- The computation of Bias and Variance of a model is not feasible in an ideal scenario.
- By experimenting in a controlled environment helped us realize the model’s (Linear Regression, Decision Tree, Bagging Decision Tree, Random Forest) behavior w.r.t various sample sizes of data.
- High sample sizes and if the same is a good representation of the population will help us obtain the required bias-variance trade-off point. Observation of variation in bias and variance for different values of alpha in Ridge regression.
References
1. James, G.; Witten, D.; Hastie, T. & Tibshirani, R. (2013), An Introduction to Statistical Learning: with Applications in R, Springer.
2. Markgraf, Bert. “How to Calculate Bias” sciencing.com, https://sciencing.com/how-to-calculate-bias-13710241.html. 8 September 2020.
3. Srivastava, P. (2018, September 23). End your bias about bias and variance!! Medium. https://towardsdatascience.com/end-your-bias-about-bias-and-variance-67b16f0eb1e6
4. Bias Variance Trade-off image is taken from https://gadictos.com/bias-variance/


What does the model do? Is it a classifier? Supervised? Unsupervised? Is it picking people with certain diseases or not? How does one make sense of results without any idea of what the model is supposed to tell?
What does the model do? Is it a classifier? Supervised? Unsupervised? Is it picking people with certain diseases or not? How does one make sense of results without any idea of what the model is supposed to tell?