Regression Analysis | Beginners Comprehensive Guide (Updated 2024)
11 minutes
Introduction
Linear Regression is a commonly used supervised Machine Learning algorithm for data science learners that predicts continuous values. Linear Regression assumes that there is a linear relationship present between dependent and independent variables. In simple words, it finds the best fitting line/plane that describes two or more variables.On the other hand, Logistic Regression is another supervised Machine Learning algorithm that helps fundamentally in binary classification (separating discreet values).
Although the usage of Linear Regression vs Logistic Regression algorithm is completely different, mathematically we can observe that with an additional step we can convert Linear Regression into Logistic Regression.
Prerequisite:
This tutorial requires you to have Python 3 and Pip3 installed on your local computer. To install Python and python libraries, In case you are unfamiliar with basics of Python, do have a look at our free python tutorial of Introduction to Python, For other tutorials of data science and machine learning course you can visit https://courses.analyticsvidhya.com/.
Learning Objectives
- This beginners tutorial will give you a brief about linear regression and logistic regression along with similarities and difference.
- You will learn step by step how to calculate linear regression and logistic regression
- Both of the machine learning models are very important for data scientist as well as for those preparing for data science and artificial intelligence. at last you will learn about similarities and diffrences between linear regression and logistic regression .
This article was published as a part of the Data Science Blogathon.
Table of Contents
- Introduction
- Use of Regression Analysis
- What Is Linear Regression?
- Steps of Linear Regression
- What Is Logistic Regression?
- Steps of Logistic Regression
- Comparison of Linear Regression & Logistic Regression
- The Similarities Between Linear Regression and Logistic Regression
- Differences Between Linear Regression and Logistic Regression
- Linear vs Logistic Regression – Use Cases
- Conclusion
- Frequently Asked Questions
Use of Regression Analysis
Before starting lets quickly understand the use of regression analysis .Regression analysis is primarily used for two conceptually distinct purposes.
- Regression analysis is widely used for prediction and forecasting, where its use has substantial overlap with the field of machine learning.
- In some situations regression analysis can be used to infer causal relationships between the independent and dependent variables.
What Is Linear Regression?
Linear Regression is a supervised learning predictive modeling algorithm in machine learning. The model predicte value according to independent variables and helps in finding the relationship between those variables.
Types of Regression:
1.Simple Linear Regression: Simple Linear Regression is the model that estimates relationship between one independent variable and one dependent variable or target variable using a straight line.
2.Multiple Linear Regression: Multiple linear regression is a model that is used to analyze the relationship between two or more independent variables and single dependent variable or target variable.
Steps of Linear Regression
As the name suggested, the idea behind performing Linear Regression(simple linear regression) is that we should come up with a linear equation that describes the relationship between dependent and independent variables .
Step 1
Let’s assume that we have a dataset where x is the independent variable and Y is a function of x (Y=f(x)). Thus, by using Linear Regression we can form the following equation (equation for the best-fitted line):
Y = mx + c
y denotes response variable
x denotes i’th predictor variable
This is an equation of a straight line where m is the slope of the line and c is the intercept.
Step 2
Now, to derive the best-fitted line, first, we assign random values to m and c and calculate the corresponding value of the given training data points Y for a given x. This Y value is the output value.
Step 3
Now, as we have our calculated output value (let’s represent it as ŷ), we can verify whether our prediction is accurate or not. In the case of Linear Regression, we calculate this error (residual) by using the MSE method (mean squared error) and we name it as loss function:
L = 1/n ∑((y – ŷ)2)
Where n is the number of observations.
Step 4
To achieve the best-fitted line, we have to minimize the value of the loss function. To minimize the loss function, we use a technique called gradient descent. Let’s discuss how gradient descent works (although I will not dig into detail as this is not the focus of this article).
Gradient Descent
A Cost Function is a mathematical formula used to calculate the error, difference between predicted value and the actual value. If we look at the formula for the loss function, it’s the ‘mean square error’ means the error is represented in second-order terms. If we plot the loss function for the weight (in our equation weights are m and c), it will be a parabolic curve. Now as our moto is to minimize the loss function, we have to reach the bottom of the curve.
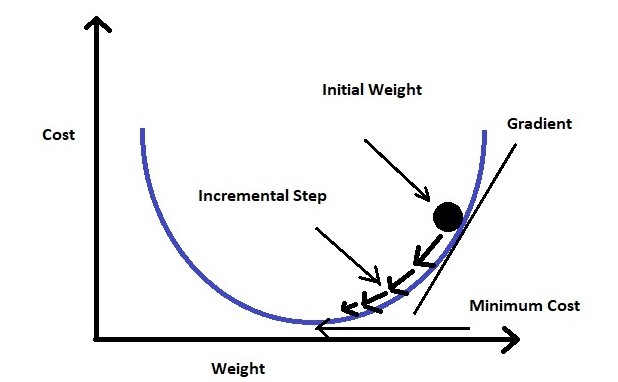
To achieve this we should take the first-order derivative of the loss function for the weights (m and c). Then we will subtract the result of the derivative from the initial weight multiplying with a learning rate (α). We will keep repeating this step until we reach the minimum value (we call it global minima). We fix a threshold of a very small value (example: 0.0001) as global minima. If we don’t set the threshold value then it may take forever to reach the exact zero value.
Step 5
Once the loss function is minimized, we get the final equation for the best-fitted line and we can predict the value of Y for any given X.
This is where Linear Regression ends and we are just one step away from reaching to Logistic Regression.
What Is Logistic Regression?
As I said earlier, fundamentally, Logistic Regression is a classification algorithm, used to classify elements of a set into two groups (binary classification) by calculating the probability of each element of the set Logistic Regression is the appropriate regression analysis to conduct when the dependent variable has a binary solution, we predict the values of categorical variables.
Steps of Logistic Regression
In logistic regression model , we decide a probability threshold. If the probability of a particular element is higher than the probability threshold then we classify that element in one group or vice versa.
Step 1
To calculate the binary separation, first, we determine the best-fitted line by following the Linear Regression steps.
Step 2
The regression line we get from Linear Regression is highly susceptible to outliers. Thus it will not do a good job in classifying two classes.
Thus, the predicted value gets converted into probability by feeding it to the sigmoid function.
The logistic regression hypothesis generalizes from the linear regression hypothesis that it uses the logistic function is also known as sigmoid function(activation function).
The equation of sigmoid:

As we can see in Fig 3, we can feed any real number to the sigmoid function and it will return a value between 0 and 1.
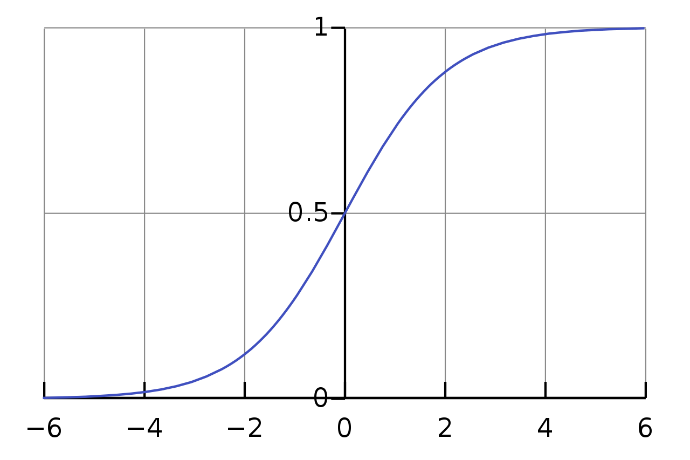
Fig 2: Sigmoid curve (picture taken from Wikipedia)
Thus, if we feed the output ŷ value to the sigmoid function it retunes a probability value between 0 and 1.
Step 3
Finally, the output value of the sigmoid function gets converted into 0 or 1(discreet values) based on the threshold value. We usually set the threshold value as 0.5. In this way, we get the binary classification.
Now as we have the basic idea that how Linear Regression and Logistic Regression are related, let us revisit the process with an example.
Comparison of Linear Regression & Logistic Regression
Let us consider a problem where we are given a dataset containing Height and Weight for a group of people. Our task is to predict the Weight for new entries in the Height column.
So we can figure out that this is a regression problem where we will build a Linear Regression model. We will train the model with provided Height and Weight values. Once the model is trained we can predict Weight for a given unknown Height value.
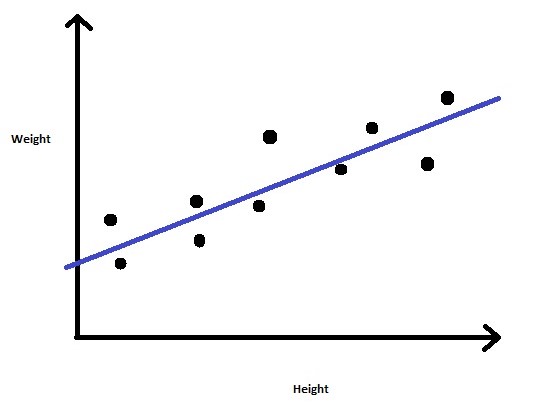
Fig 3: Linear Regression
Now suppose we have an additional field Obesity and we have to classify whether a person is obese or not depending on their provided height and weight. This is clearly a classification problem where we have to segregate the dataset into two classes (Obese and Not-Obese).
So, for the new problem, we can again follow the Linear Regression steps and build a regression line. This time, the line will be based on two parameters Height and Weight and the regression line will fit between two discreet sets of values. As this regression line is highly susceptible to outliers, it will not do a good job in classifying two classes.
To get a better classification, we will feed the output values from the regression line to the sigmoid function. The sigmoid function returns the probability for each output value from the regression line. Now based on a predefined threshold value, we can easily classify the output into two classes Obese or Not-Obese.
Comparing Graphical Patterns: Logistic Regression Vs Linear Regression
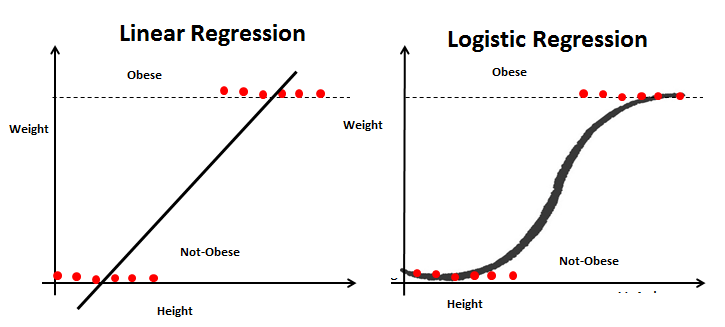
Fig 4: Linear Regression Vs Logistic Regression
Confusion Matrix
A confusion matrix is table that define the performance of classification algorithm.It visualizes and summarizes performance of classification algorithm.The most frequently used performance metrics for classification according to these values are accuracy (ACC), precision (P), sensitivity (Sn), specificity (Sp), and F-score values.
Overfitting
It occurs when our model tries to cover all the data points or more than the required data points present in the given dataset.
Finally, we can summarize the similarities and differences between these two models.
The linear and logistic probability models are given by the following equations:
p = a0 + a1x1 + a2x2 + … + aixi . …..(1) (linear model)
ln[p/(1-p)] = b0 + b1x1 + b2x2 + … + bkxk. …..(2) (logistic model)
Where p = probability.
From eq 1 and 2, probability (p) is considered a linear function of the regressors for the linear model. Whereas, for the logistic model, the log odds p/(1-p) are considered a regressors’ linear function.
The Similarities Between Linear Regression and Logistic Regression
Linear Regression and Logistic Regression both are supervised Machine Learning algorithms.
Linear Regression and Logistic Regression, both the models are parametric regression i.e. both the models use linear equations for predictions
That’s all the similarities we have between these two models.
However, functionality-wise these two are completely different. Following are the differences.
Differences Between Linear Regression and Logistic Regression
- Linear Regression is used to handle regression problems whereas Logistic regression is used to handle the classification problems.
- Linear regression provides a continuous output but Logistic regression provides discreet output.
- The purpose of Linear Regression is to find the best-fitted line while Logistic regression is one step ahead and fitting the line values to the sigmoid curve.
- The method for calculating loss function in linear regression is the mean squared error whereas for logistic regression it is maximum likelihood estimation.
- linear regression, the coefficient interpretation of independent variables are quite straightforward (i.e.while holding all the other variables constant, when a unit increases in this variable, the dependent variable is also expected to increase/decrease).In logistic regression, depends on the family and link you use, the interpretation is different.
- Linear RegressionLogistic RegressionUsed to predict the continuous dependent variable using a given set of independent variables.Used to predict the categorical dependent variable using a given set of independent variables.The outputs produced must be a continuous value, such as price and age.The outputs produced must be Categorical values such as 0 or 1, Yes or No.
Linear vs Logistic Regression – Use Cases
The linear regression algorithm can only be used for solving problems that expect a quantitative response as the output,on the other hand for binary classification, one can still use linear regression provided they interpret the outcomes as crude estimates of probabilities.
Conclusion
Linear Regression and Logistic Regression both are supervised Machine Learning algorithms.Linear Regression and Logistic Regression, both the models are parametric regression i.e. both the models use linear equations for predictions.Logistic regression is considered generalized linear model because the outcome depends on the sum of the inputs and parameters
Key Takeaways
- Basic understading of the linear regression and logistic regression.
- Similiarities and difference between linear and logistic regression and how logistic regression is connected to linear regression.
Frequently Asked Questions
A. They use labeled datasets to make predictions and are supervised Machine Learning algorithms.
A. Linear Regression is used to solve Regression problems where as Logistic Regression is used to solve Classification problems.
A. Logistic regression is considered generalized linear model because the outcome depends on the sum of the inputs and parameters.


Amazing Blog. on demand app solutions
It's discrete, measured solely in whole units, not discreet, having or showing discernment or good judgment in conduct and especially in speech.
The application depends on the field. In the clinical trials we practically never use the logistic regression for any kind of classification, instead we use it for typically as a regression method, for description and inference about the main and interaction effects. Actually, it's one of the core tools to analyse data in longitudinal clinical trials with binary endpoints to model the proportion of successes. The logistic regression is nothing but a special case of the Generalized Linear Model, namely the binomial regression with logit link. It's part of a bigger family: binary LR, ordinal LR (= proportional odds model, a generalization of the Wilcoxon method), multinomial LR and fractional LR. There's also conditional LR and alternate LR.
nice explanation on linear and logistic regression