Introduction to Power Analysis and Statistical Power
How much data is sufficient for statistical significance? What’s the ideal sample size? Often, it is not entirely feasible to perform the statistical experiment multiple times to ensure enough power. At the same time, our machine learning models might not be statistically conclusive if we do not have an adequate sample size. This is where power analysis steps in. It estimates the required sample size to gauge study effects at the desired significance level, effect size, and statistical power. In this article, we will explore the importance and uses of power analysis and sample size.
This article was published as a part of the Data Science Blogathon.
Table of contents
What is Statistical Power?
Let’s first discuss the statistical power in detail.
Statistical power in a hypothesis test signifies the probability of detecting an effect when a true effect exists, providing confidence in study results. It has an inverse relationship with type 2 error whic is the occurrence of a False Negative, where a false null hypothesis isn’t rejected.
Note that type 2 error is False Negative where we fail to reject the false null hypotheses.
What is Null Hypothesis?
At this point, it is important to understand what is the Null Hypothesis?
It is a statistical hypothesis test that assumes an outcome. For example, the null hypothesis in the KS statistic implies that the two populations belong to similar distribution.
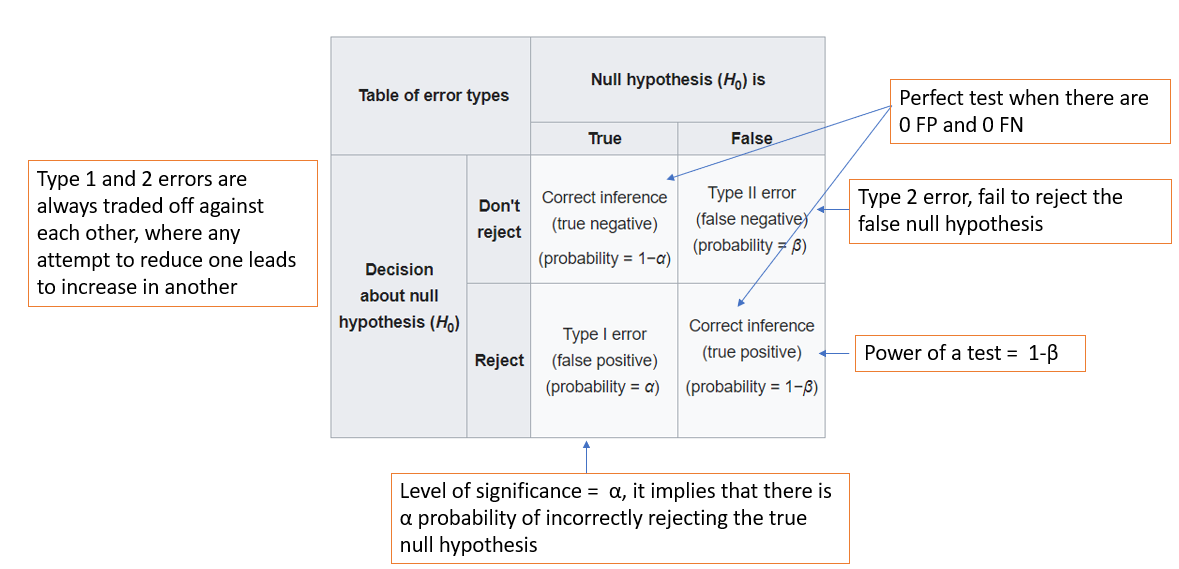
It is important to note from the above illustration that:
- Higher test power corresponds to a lower type 2 error (β).
- Lower statistical power in an experiment can lead to unreliable conclusions, necessitating a minimum power threshold, typically 80% or more.
- A power of 80% indicates an 80% chance of detecting an existing effect, with a 20% chance of a Type 2 error.
What is Power Analysis?
Power analysis, also known as statistical power analysis, is used in statistics to determine the statistical power of a hypothesis test. It involves assessing the likelihood of detecting a relationship between variables, given a specific sample size, significance level, effect size, and statistical test.
Importance of Power Analysis
In hypothesis testing, researchers formulate null (H0) and alternative (H1) hypotheses to investigate relationships or differences between variables within a population. The statistical power of a test quantifies its ability to correctly reject the null hypothesis when the alternative hypothesis is true, essentially measuring a test’s capacity to detect genuine effects.
Power analysis precedes data collection and assists researchers in determining the optimal sample size required to achieve their desired level of statistical power. It helps in:
- Estimating the likelihood of obtaining statistically significant results.
- Taking into account factors such as effect size.
- Significance level (often denoted as α), and the desired power level (usually represented as 1-β, with β indicating the probability of a Type II error).
Why Power Analysis Matters?
- Informs study design: Power analysis guides decisions about study design, including the appropriate sample size and choice of statistical tests.
- Reduces Type II errors: A higher statistical power lowers the risk of failing to detect genuine effects, ensuring more reliable and meaningful results.
- Cross-disciplinary utility: Power analysis is widely applicable in various research fields, from psychology and medicine to social sciences and engineering.
- Resource allocation: Researchers can efficiently allocate resources by optimizing study designs through power analysis.
- Enhanced effect detection: Increasing statistical power boosts the likelihood of uncovering significant relationships or effects within the collected data.
Power analysis, therefore, empowers researchers to conduct more robust studies and increase the chances of obtaining valuable insights.
Three Considerations for Power Analysis
Simple Sampling Population
The assumption used in most general sample size computations is a normal, bell-shaped (Gaussian) population distribution. But changes among subpopulations must be taken into account for more intricate investigations and designs, including stratified random sampling. Inaccurate estimates of demographic characteristics may result from neglecting to take these variabilities into consideration.
Appropriate Sample Size
Depending on the kind of statistical analysis being done, a certain sample size may be needed. While more sophisticated methods like multiple regression, ANOVA, or log-linear analysis frequently require a larger sample, descriptive statistics could be sufficient with a “reasonable” sample size. Additionally, a substantially larger sample size may be necessary to provide statistical power if comparison analysis among sub-groups of the testing groups is needed.
Compensation for error rate
Apart from fulfilling the fundamental prerequisites for sample size, investigators must guarantee that the sample size is adequate to include participants who might need to be excluded from the study. This could be the result of inadequate experiments, outliers, or inaccurate outcome recording. Many researchers take this worry into account when calculating sample sizes by adding a 25 percent buffer to account for possible exclusions.
Variables in Power Analysis
Let’s delve into the broader context of power analysis, which revolves around four interconnected variables:
- Effect Size: The magnitude of the observed effect directly influences the degree of random error in the analysis. Larger effects tend to yield more accurate results.
- Sample Size: Increasing the sample size enhances the ability to detect smaller effects, as it reduces the impact of random variability.
- Level of Significance (α): The chosen significance level determines the threshold for statistical significance, often set at 0.05 or 5%.
- Statistical Power: Statistical power (often denoted as 1-β) represents the likelihood of correctly identifying a true effect when it exists.
These variables are intricately linked, meaning that alterations in one variable can ripple through and affect the others. Understanding their relationships is essential for effective power analysis.
Also Read: Explore our Exclusive Course on Statistics & Exploratory Data Analysis.
Relation Between Variables and Sample Size
Power analysis involves estimating one of the four variables while having values for the other three. It is particularly useful for determining the minimum sample size required for an experiment.
As we increase the sample size, our ability to detect even small effects improves. However, this comes at the cost of conducting more statistical experiments. Eventually, there is a point of diminishing returns, where adding more data ceases to increase statistical power significantly.
It’s important to note that, in some cases, our sample may not capture an existing effect in the population. This discrepancy can often be attributed to sampling error, where the sample is not truly representative of the entire population.
Validating Experiment using Power Analysis
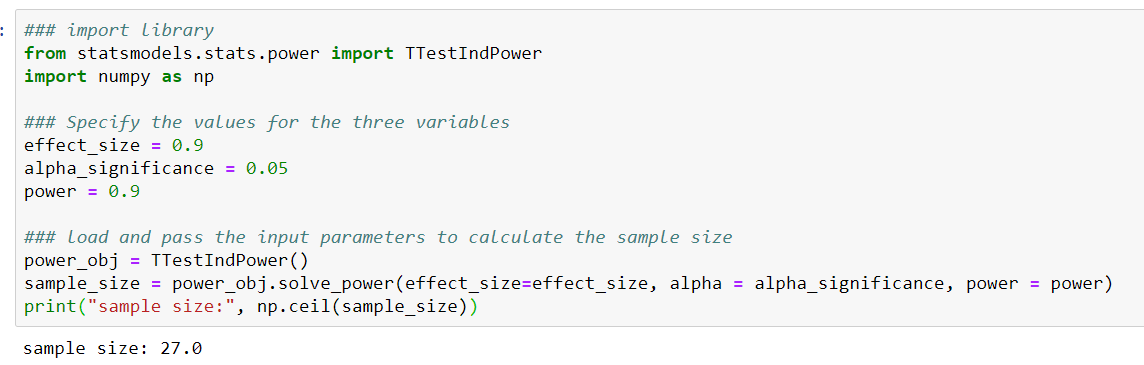
Power Analysis is also used to check and validate the results and findings from the experiment. For example, if we specify the effect size, sample size, and significance level, we can calculate the power of an experiment to check whether type 2 error probability is within an acceptable range.
As per documentation, we can solve any one of the 4 parameters in an independent 2 sample T-test:
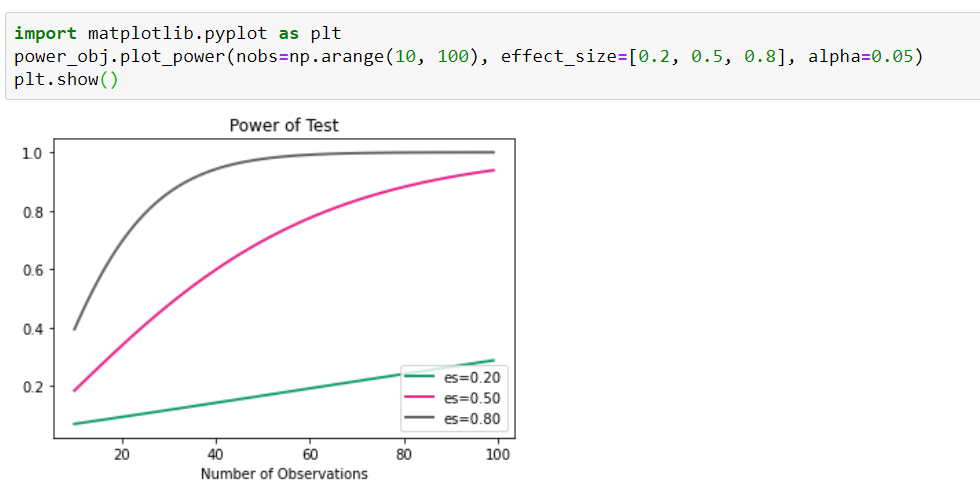
We can also use plot power curves to check how varying the effect size and different sample size changes the power of the experiment at a given significance level.
Conclusion
Understanding power analysis and sample size empowers data professionals to make informed decisions. They help strike a balance between collecting enough data to detect meaningful effects and avoiding unnecessary data collection. By grasping the interplay between variables, effect size, sample size, significance level, and statistical power, we navigate the complexities of data science more effectively.
For those seeking to delve deeper into statistics, here’s our tutorial on valuable resources and hands-on experiences to enhance your statistical expertise:
Frequently Asked Questions
A. Common methods of power analysis include the a priori, post hoc, and sensitivity analysis. A priori power analysis involves determining the sample size needed before conducting a study. Post hoc power analysis assesses the statistical power after data collection. Sensitivity analysis examines how varying assumptions affect the power of a study.
A. The principle of power analysis is to determine the statistical power of a study, which is the probability of detecting a true effect when it exists. It involves assessing factors such as sample size, effect size, and significance level to ensure that a study has a high likelihood of detecting real differences or effects.
A. A power analysis of 80% means that the study has an 80% probability of detecting a true effect if it exists. In other words, there is an 80% chance that the study will correctly identify a significant difference or relationship between variables if one truly exists.
A. In SPSS (Statistical Package for the Social Sciences), power analysis is a feature used to calculate the statistical power of a study. It allows researchers to estimate the required sample size for achieving a desired level of power, given specific parameters such as effect size, significance level, and desired power.


