7 Popular Feature Selection Routines in Machine Learning
Best ways for Feature Selection
The general principle in Data Science is more quality training data results in a better Machine Learning model. It is valid for the number of situations but not for the number of features. A real-world dataset consists of unnecessary features that may impact the performance of the model.

One needs to be selective in terms of features chosen for the modeling. The dataset contains a lot of independent variables where only a few are useful and others not. Selecting the best set of features from the combinations results in a polynomial approach that requires a polynomial time complexity. We will discuss seven ways to choose the best features for training a robust ML model in this post.
Domain Knowledge
A Data Scientist or ML engineer with domain knowledge about the problem would help choose the best features and set of variables for any case study. People with intuition about the data or domain knowledge helps in feature engineering and selection of best features. For example, consider the car price prediction problem, where features such as the manufacture year, model, fancy license number are unique factors for deciding the car price.
Missing Values
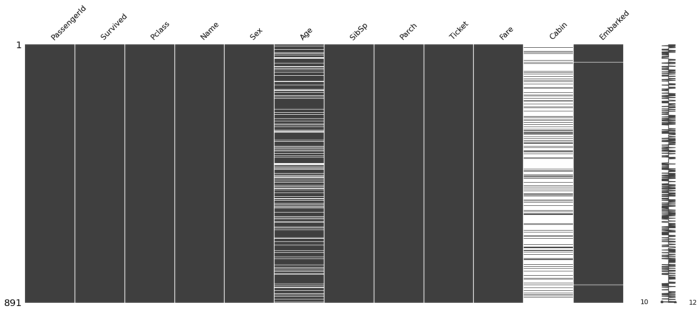
The real-world datasets usually consist of missing values, occurred due to failure to record or data exploitation. We have various techniques for imputation of missing values, but that does not match the real data. Hence, a model trained on features that consist of missing values may not yield better performance.
It is better to drop the columns or variables that contain missing values more than a certain threshold. We can drop the ‘cabin’ feature that has a lot of missing values. One can refer to the below image generated from titanic data.
Source: Author
Correlation with the Target label
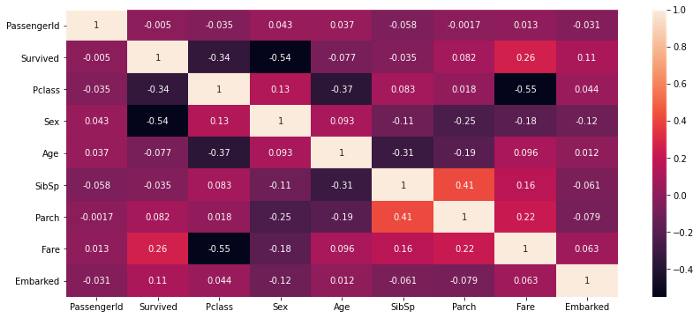
Correlation between the target class label and features determines how correlated each variable with references to the target class. There are many correlation techniques such as Pearson, Spearman, Kendall, etc. used for observing correlations between two features.
df.corr() returns with the person correlation coefficient between the features. Variables such as sex, Pclass, fare are highly correlated with the target class label Survived and hence known as key features, from the below correlation heatmap of titanic data. Now features such as PassengerId, SibSp is not correlated with the target variable and may not impact our model performance. Hence these variables can be excluded.
Source: Author
Correlation between the Features
Correlation between variables results in collinearity, which may affect the model performance. A variable is said to be correlated with others if they have a high correlation. Hence, a change in one feature results in a variation of other correlated variables.
From the above correlation heatmap of Titanic data, the Pearson correlation coefficient between Pclass and Fare is high, so the change in one variable will negatively impact the other variable.
Principle Component Analysis (PCA)
PCA is a dimensionality reduction method used to extract features from the dataset. It reduces the dimensionality of the dataset to a lower dimension by using matrix factorization. It projects the data completely into a lower dimension preserving the variance.
We use this method to reduce the features when the dimensionality of the data is very high, and removing the redundant variables is a tedious task. This method reduces the dataset with various variables into a dataset with the desired number of features.
The below PCA plot is trained on the dataset from Ionosphere Dataset from the UCI machine learning repository
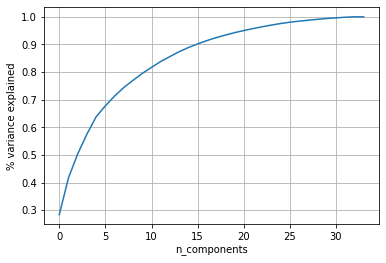
The total number of dimensions: from the above plot, 34 Observations.
90% of the variance is preserved for 15 dimensions.
80% of the variance is preserved for 9 dimensions.
Reducing the dimensions to fifteen preserves 90% of the variance and selects the most useful features.
Forward Feature Selection
Source: Author
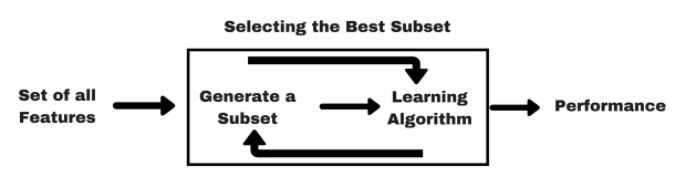
Forward or Backward feature selection helps to find a subset of the best performing features for the ML model. If there are n features for a given dataset, variables are selected based on the previous result inference.
The forward feature selection techniques follow:
- Evaluate the model performance after training by using each of the n features.
- Finalize the variable or set of features with better results for the model.
- Repeat the first two steps until you obtain the desired number of features.
Forward Feature Selection is a wrapper method to choose the best subset of features. The backward Feature Selection technique is just the contrast of forwarding Feature selection, where initially all the variables are chosen and remove the most redundant features in each step.
Feature Importance
Feature Importance is the list of features that the model considers being important. It gives an importance score for each variable, describing the importance of that feature for the prediction. Feature Importance is an inbuilt function in the Sk-Learn implementation of many ML models.
Feature importance scores help to identify the best subset of features and training a robust model by using them.
Conclusion
Feature selection is a valuable process in the model development pipeline, as it removes unnecessary features that may impact the model performance. In this post, we looked at seven techniques to choose the best set of features from data. One can use these hacks in your data science model for better performance.
Apart from the above mentioned, there are various other hacks to remove the redundant features, like remove variables having a low variance, chi-square test.
I hope you have found this article useful and have a great day, Thank you.
The media shown in this article are not owned by Analytics Vidhya and is used at the Author’s discretion.
Myself Pavan Kalyan with 2 years of experience in developing, deploying scalable Machine Learning models and interested to explore data, discover useful insights. I like to participate in the Machine Hack and Kaggle competitions.


