Pandas Functions for Data Analysis and Manipulation
Introduction
Pandas is an open-source python library that is used for data manipulation and analysis. It provides many functions and methods to speed up the data analysis process. Pandas is built on top of the NumPy package, hence it takes a lot of basic inspiration from it. The two primary data structures are Series which is 1 dimensional and DataFrame which is 2 dimensional.
It is one of the most important and useful tools in the arsenal of a Data Scientist and a Data Analyst.
Install Pandas:

First, let’s import the Pandas module. We will make an alias of “pandas” as pd because it makes the code a little easy to read and it also avoids any namespace issue.

Next, we will import the os module which will help us to read the input file.

Then, we will create a function that will get the file name as input and load the particular file from the location. And, then we will call this function in the Pandas function which is “read_csv()“, which will read the file from the provided location.
Table of contents
- Introduction
- 1. Read
- 2. head()
- 3. shape
- 4. info()
- 5. to_datetime()
- 6. isnull()
- 7. drop()
- 8. describe()
- 9. value_counts()
- 10. fillna()
- 11. sample()
- 12. nunique()
- 13. columns
- 14 . nsmallest() & nlargest()
- 15. groupby()
- 16. get_group()
- 17. loc() and iloc()
- 18. Sorting
- 19. Query
- 20. set_index()
- 21. duplicated()
- 22. get_dummies()
- 23. select_dtypes()
- 24. concat()
- 25. apply()
- 26. qcut() and cut()
- 27. to_csv()
1. Read
Note – There are various other methods to read different types of files, such as read_json(), read_html(), read_excel(), etc which can be easily used as per the requirement.
Note – The dataset which is used is this.
2. head()
Then, we will use pandas “head()” function to display the top 5 rows from our data set. Note – We can provide the no. of rows that we want to display by providing the count as a parameter to the “head()” function, i.e. (df.head(10) – this will now display 10 rows from our dataset).
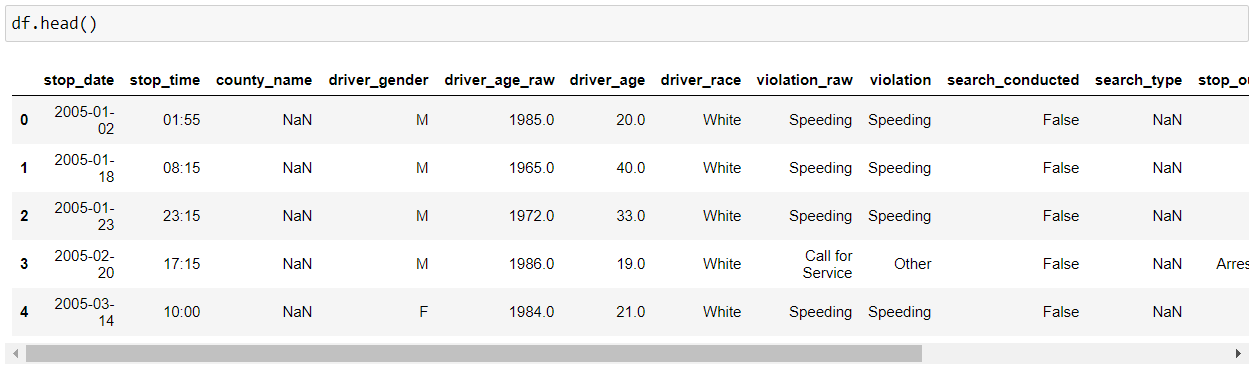
Note – There is a “tail()” method as well which will show the last 5 rows from our data set.
3. shape
Now, if we want to see the dimension of our dataset, we can use “shape”, which will show the dimensions in (No. of rows, No. of columns) format.

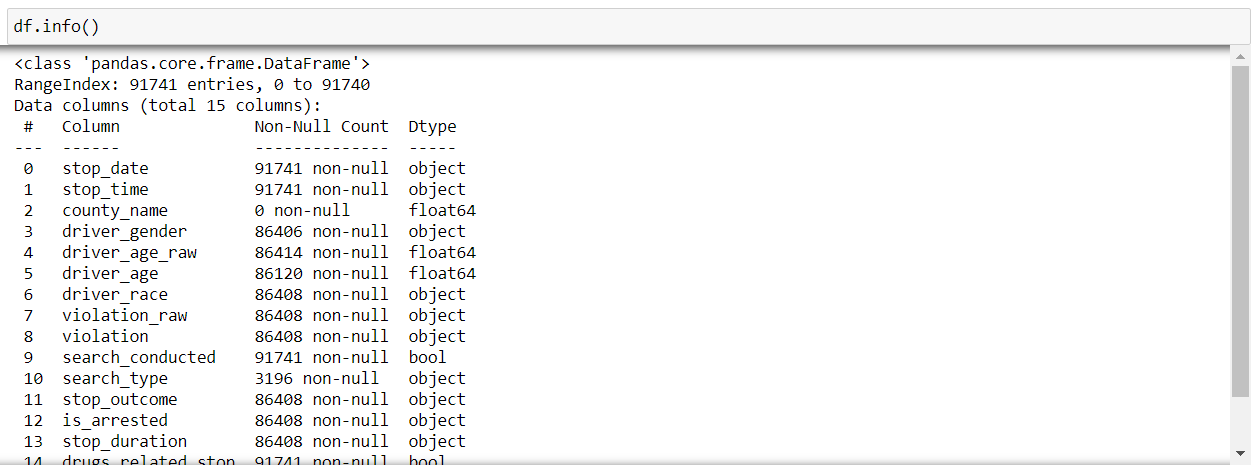
4. info()
Now, if we want to know some more information about our dataset, we can use the “info()” function of pandas. It displays various information about our data such as the column names, no. of non-null values in each column(feature), type of each column, memory usage, etc.
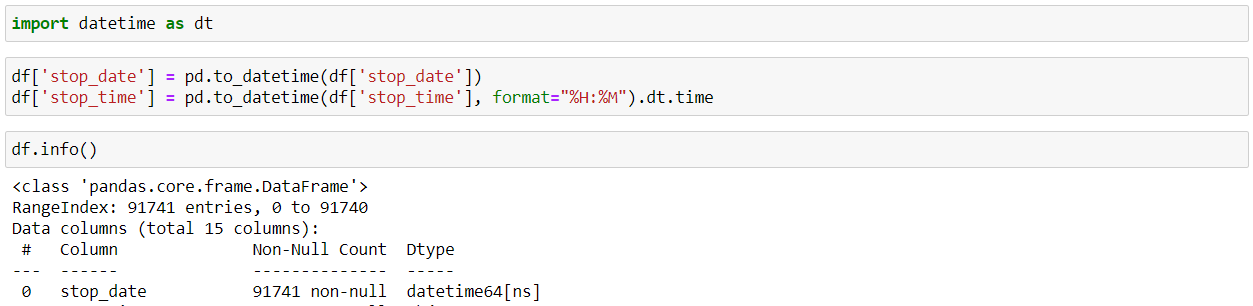
5. to_datetime()
So, while reading a CSV file, the DateTime objects in the file are read as string objects and therefore, it’s a little difficult to perform DateTime operations like time difference on a string. So, this is where the pandas “to_datetime()” method comes into play. You can provide various formats as per your requirement.
6. isnull()
Using “isnull()” and “sum()” functions, we can find that the no. of null values in a DataFrame for every feature.

7. drop()
Now, as we can see that “county_name” column is completely empty, so it will not provide any information which is beneficial to us. Hence, we will drop that particular column using the pandas “drop()” function. Note – We provide “inplace=True’ to modify the current DataFrame.

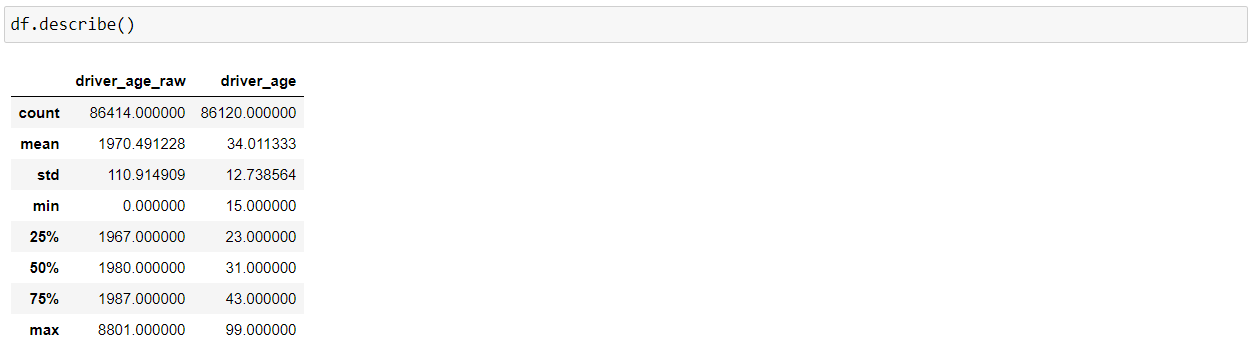
8. describe()
Now, using the “describe()” function, we can get various information about the numerical columns in our DataFrame, such as total count of rows, mean, the minimum value, the maximum value, and the spread of the values in the particular feature.
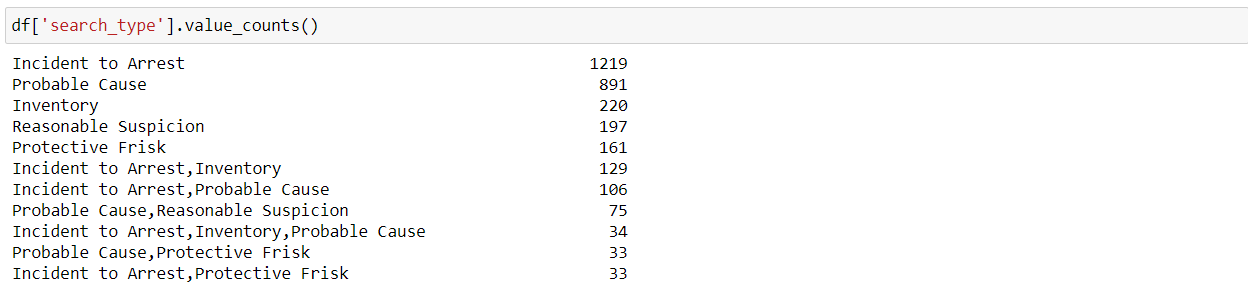
9. value_counts()
“value_counts()” function is used to identify the different categories in a feature as well as the count of values per category.
10. fillna()
Now, as we know that, by using the “isnull()” and “sum()” functions, we can check if our data has any missing values or not. So, now we can see that this “driver_gender” feature has 5335 nan or missing values. So, we will fill up the missing values using the mode(a value that appears most frequently in a data set) of this particular feature using the “fillna()” function.
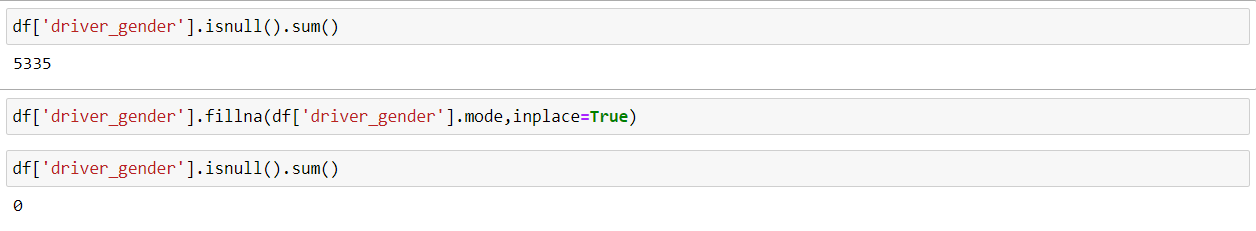
Note – This way of filling the missing or nan values is not the most effective way and there are other much more efficient ways for imputation. There is a lot of thought which goes behind when we are working with missing values but, this is just for explaining the functionality of the fillna() function.
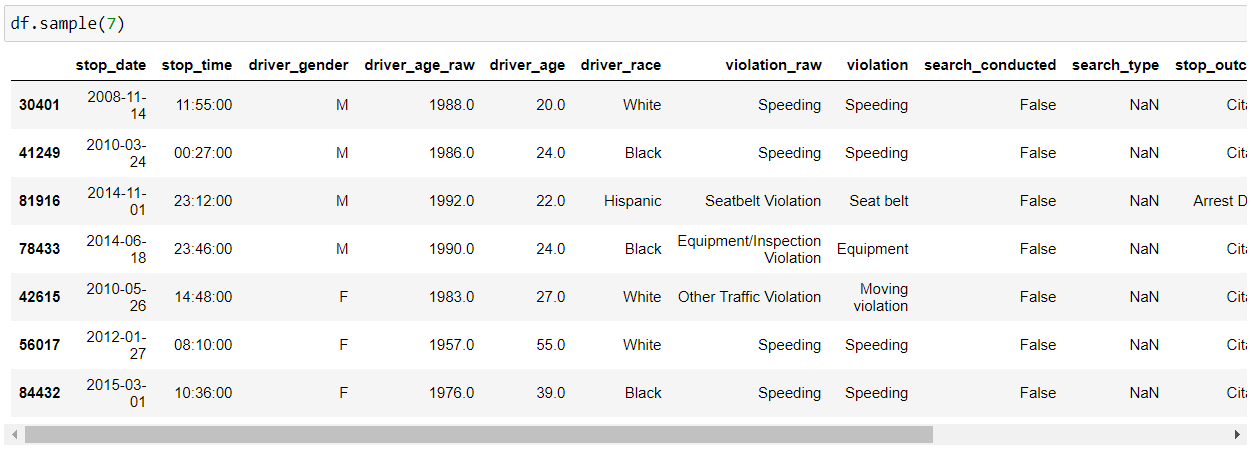
11. sample()
We can use the “sample()” function which allows us to choose random values from our data frame. We can pass it the no. of rows that we want to fetch as a parameter.
12. nunique()
We can use the “nunique()” function to find the no. of unique values in our series or data frame. Generally, it is used in the case of categorical features to identify the no. of categories in a particular feature.

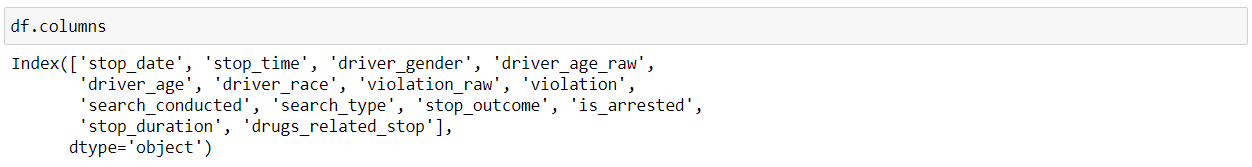
13. columns
As the name suggests, “columns” get the name of all the features/columns in our data frame.
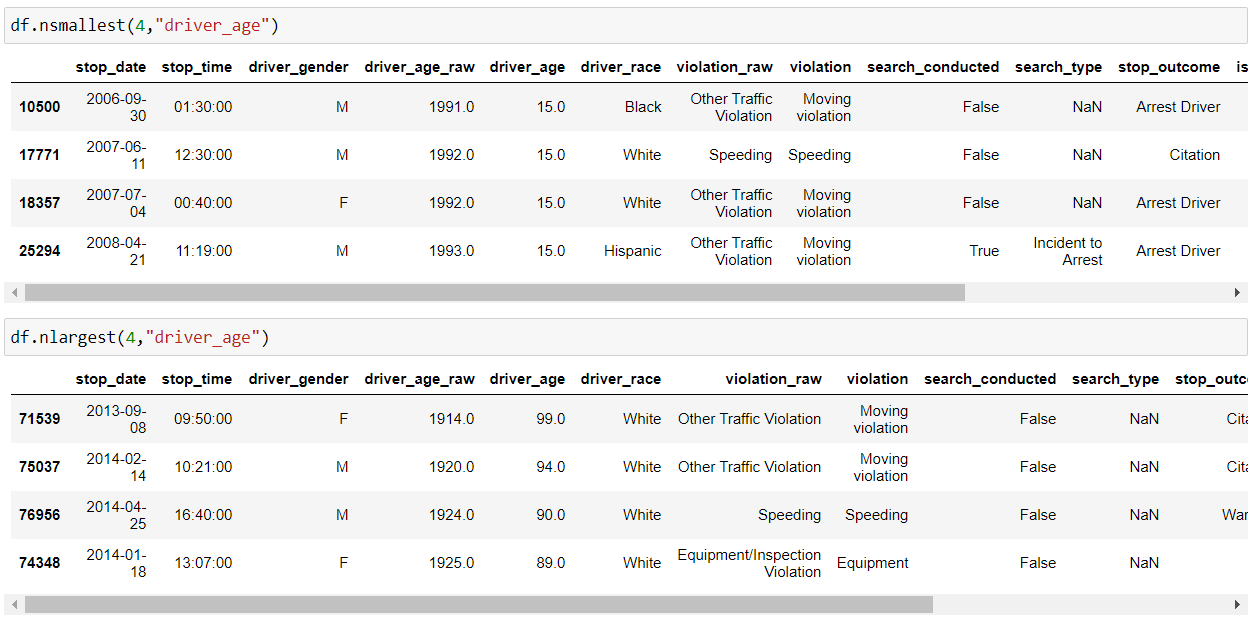
14 . nsmallest() & nlargest()
So, as the name suggests, “nsmallest() & nlargest()” functions are used to obtain “n” no. of rows from our dataset which are lowest or highest respectively.
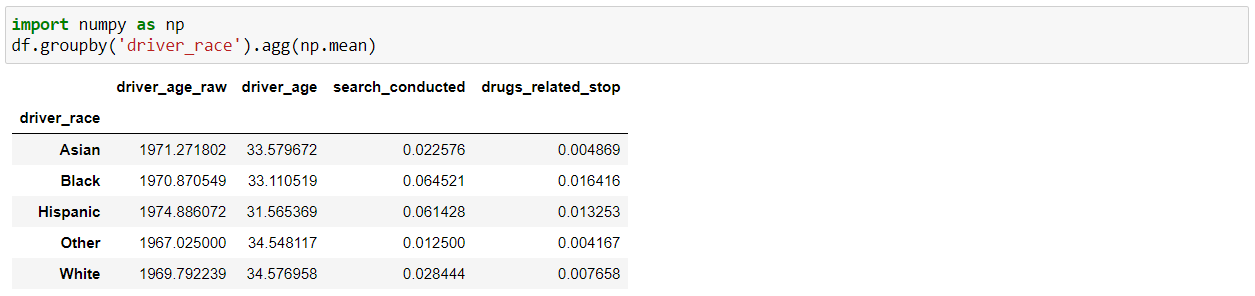
15. groupby()
The “groupby()” function is very useful in data analysis as it allows us to unveil the underlying relationships among different variables. And then we can apply Aggregations as well on the groups with the “agg()” function and pass it with various aggregation operations such as mean, size, sum, std etc.
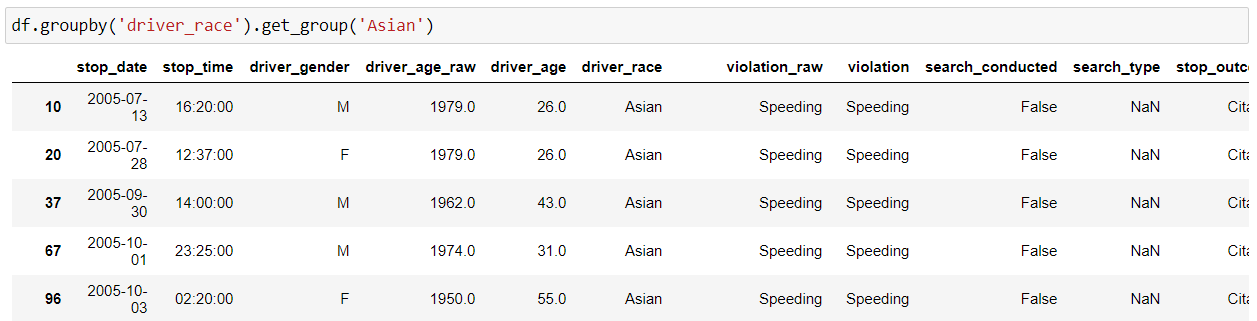
16. get_group()
We can use the “get_group()” function to select a specific group.
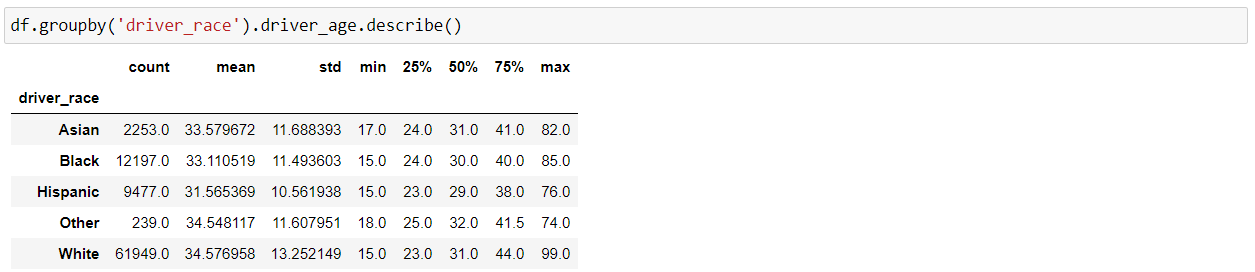
Note – We can combine various methods of pandas as per our requirement for a better understanding of data as shown below:
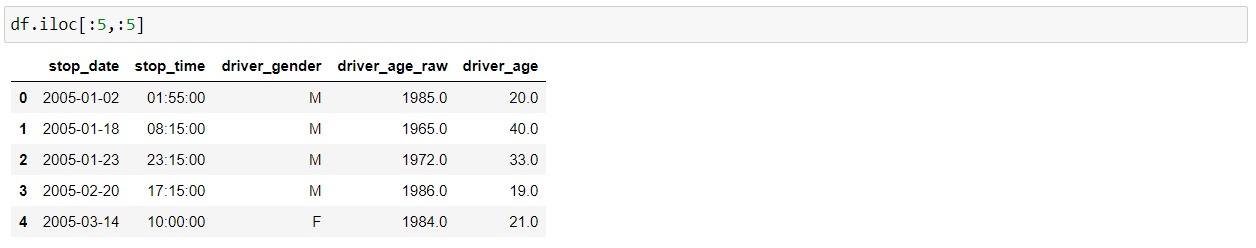
17. loc() and iloc()
loc() and iloc() methods are used in slicing data from the pandas DataFrame which helps in filtering the data according to some given condition.
loc – select by labels
iloc – select by positions
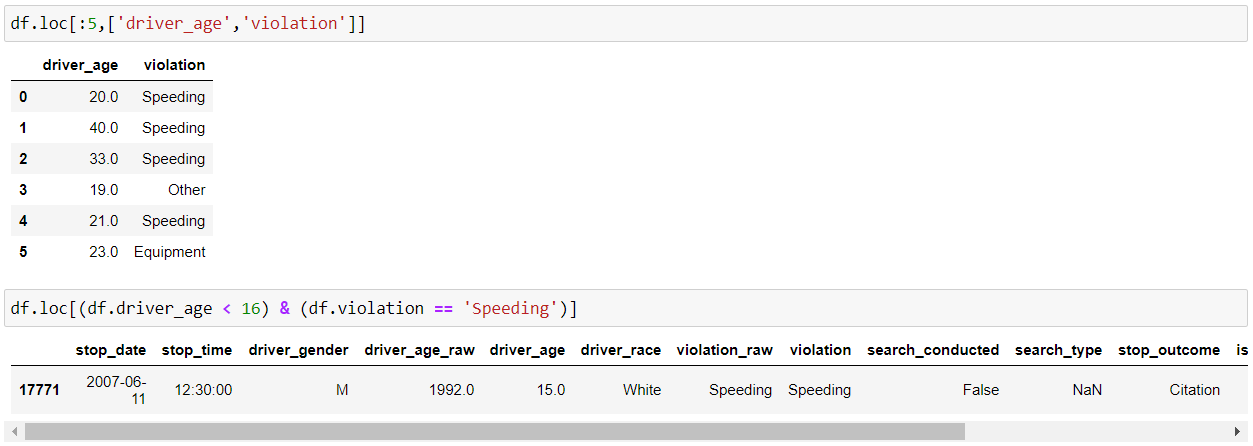
iloc() slices the data frame in the specified rows and column range.
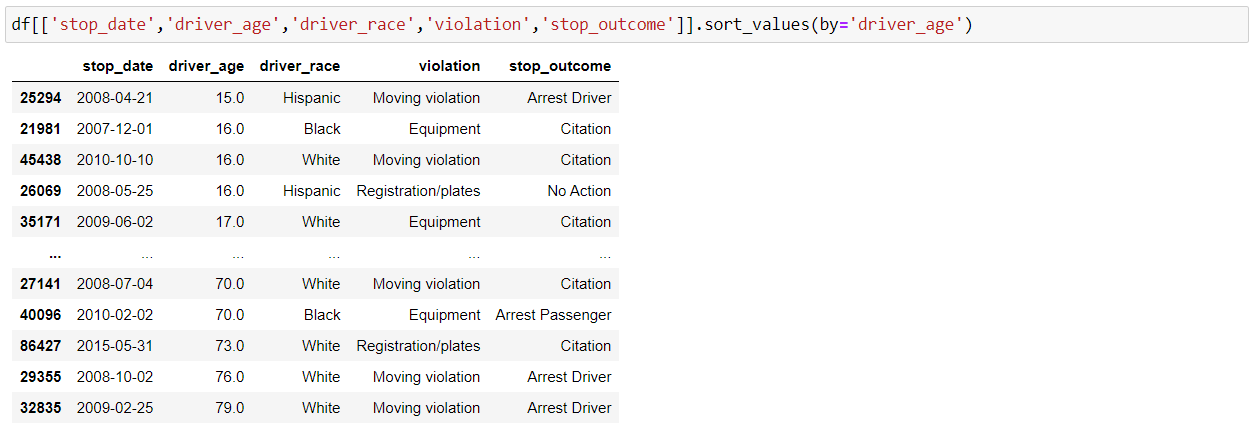
18. Sorting
We can sort our DataFrame by index or values with Pandas “sort_index()” and “sort_values()” functions. Below is the implementation for sort by values:
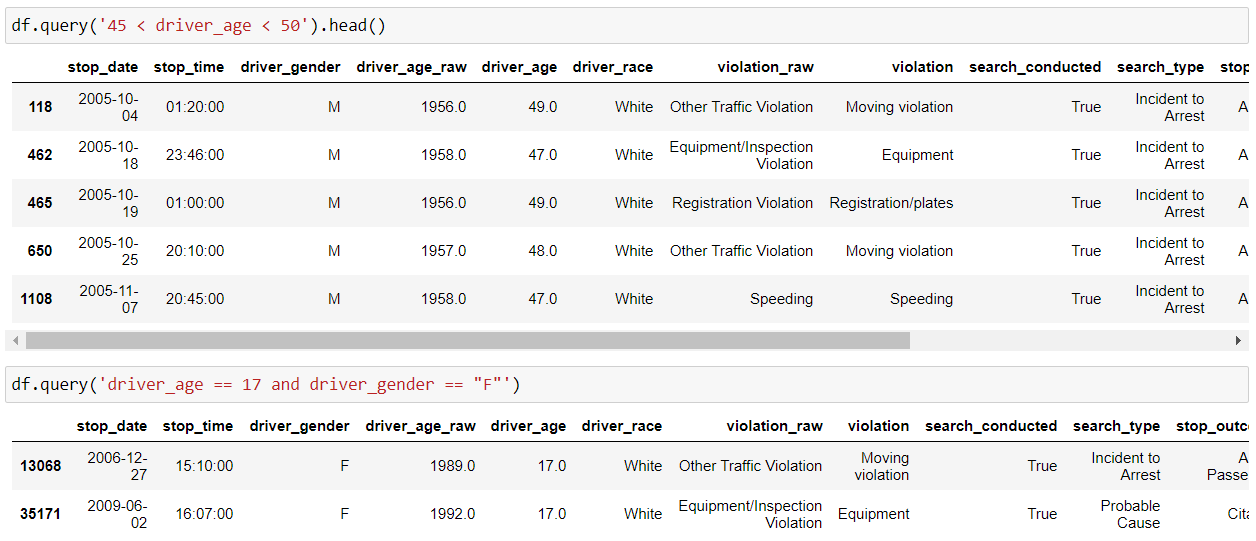
19. Query
We can use the Pandas query() function to filter our data frame as per our conditions or requirements as shown below:
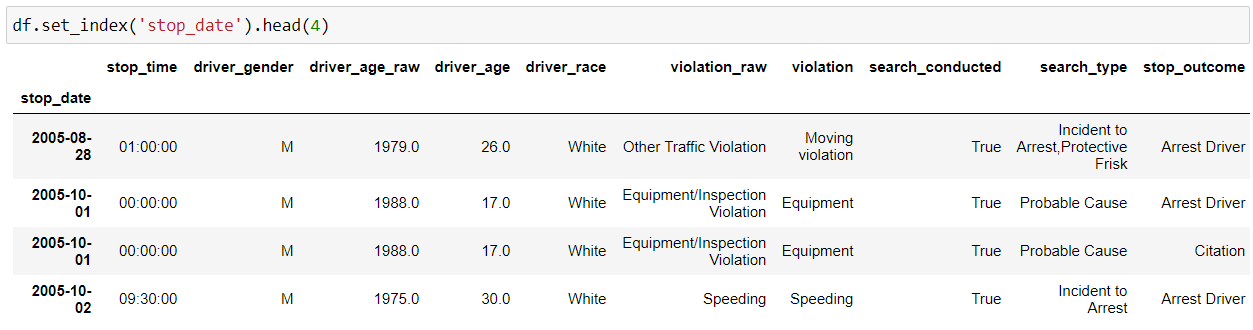
20. set_index()
So, we can use Pandas “set_index()” function to set any of your columns as the index.
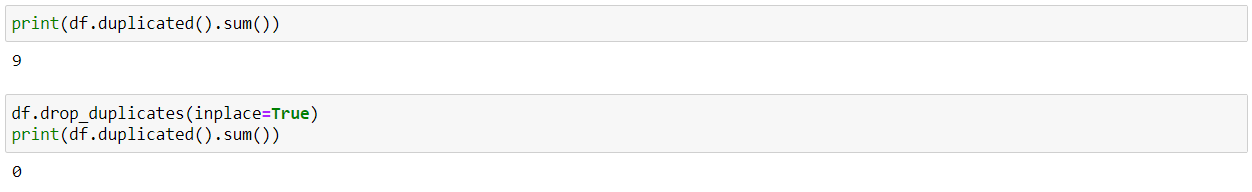
21. duplicated()
We can use the “duplicated()” function to find all the duplicate rows in our dataset. And, then we can remove duplicate values using the drop_duplicates() function, as having too many duplicate values will affect the accuracy of our model at the later stage.
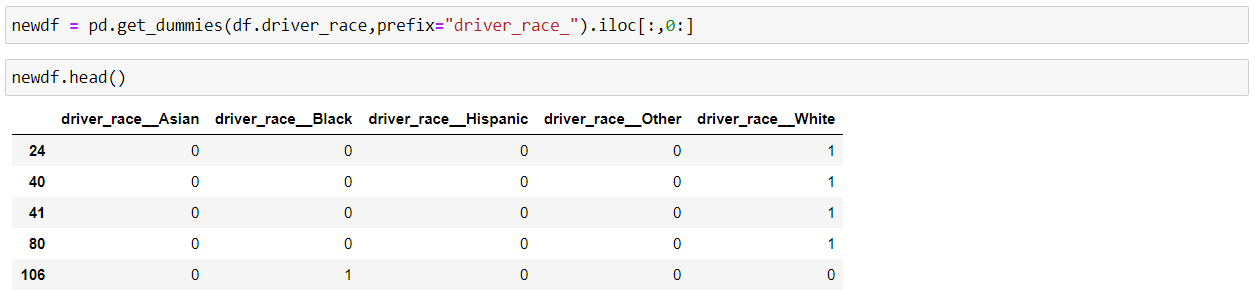
22. get_dummies()
Pandas “get_dummies()” method is used to convert the categorical features of the data into dummy variables or indicator variables.
We usually do this conversion because some machine learning models don’t work well with categorical values such as Random Forrest, but we shouldn’t be using this if we have too many categories in our feature as it will create that many new features in our data frame, which will have an effect on the performance of our model.
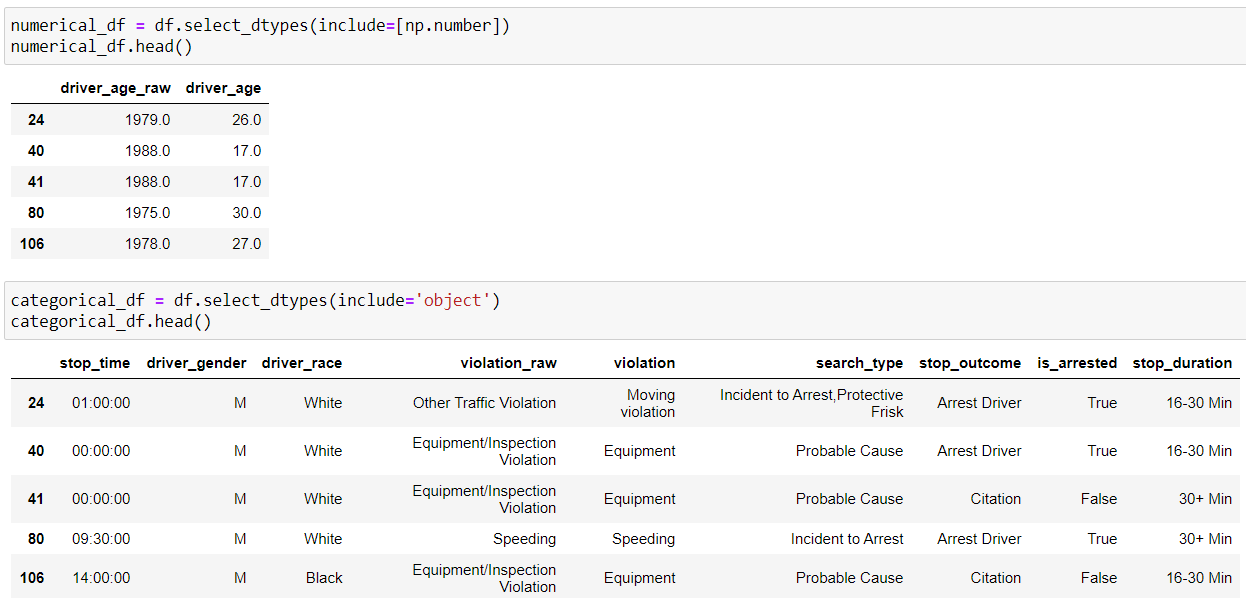
23. select_dtypes()
We can separate the numerical and categorical features from our data frame and create new ones by using the “select_dtypes()” function and include “np.number” to select numerical columns whereas include “objects” for categorical columns.
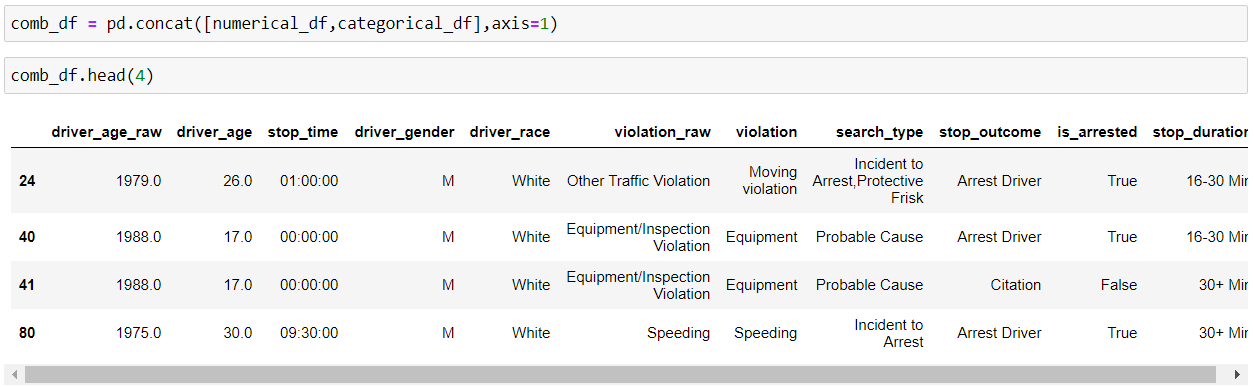
24. concat()
We can perform concatenation of pandas object into a DataFrame output along a particular axis with optional set logic such as union and intersection using concat() method.
By default, axis=0, i.e. row-wise concatenation, so if we set axis=1, column-wise concatenation will be performed.
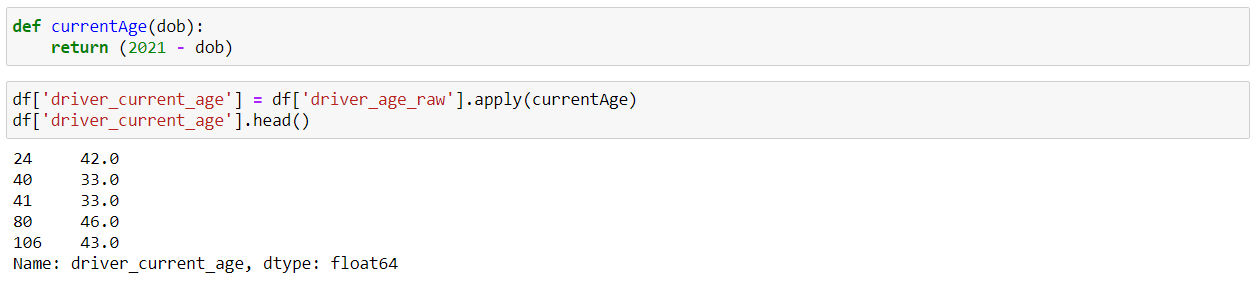
25. apply()
Suppose we create our own custom function and we want to use that function in our data frame. This is where the Pandas “apply()” function comes into play. It allows us to apply a custom function to every element of a particular Series.
So, here we have created our own custom function currentAge() which returns the current age of the person by subtracting their date of birth from the current year(2021). And, after that we can use this function inside the “apply()” function.
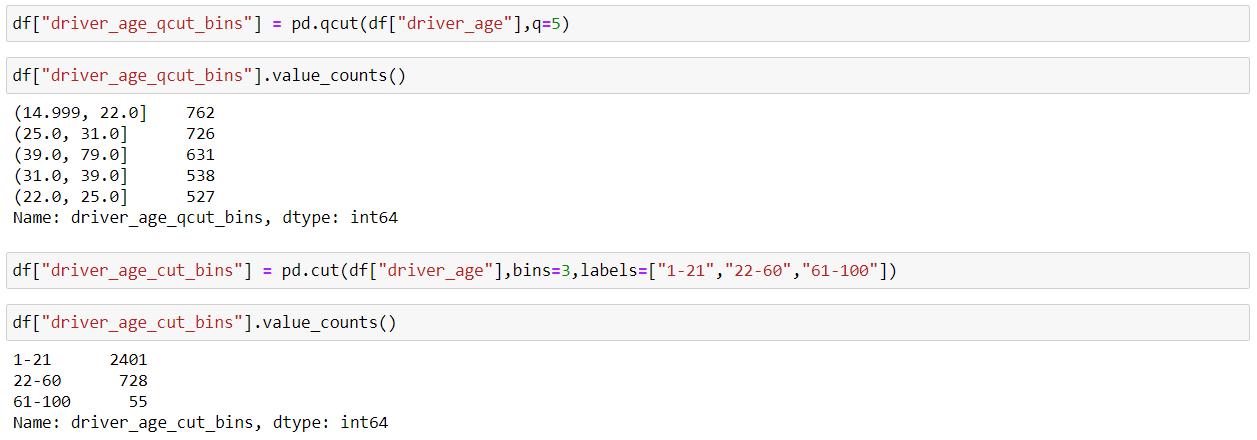
26. qcut() and cut()
So, when we have to deal with continuous numeric data, it is often helpful to bin them into multiple buckets and then carry on with the further analysis of the data. Pandas provide two methods which are qcut() and cut(), which helps us to convert continuous data to a set of discrete buckets.
qcut() method ensures a more even distribution of the values inside each bin, so we can say it’s a better sampling. We just pass the no. of bins and then Pandas does the behind the scene job to decide how wide to make each bin.
cut() method is used to specifically define the bin edges and hence the distribution of values is not even across all the bins. There might be a situation when there is no item inside a particular bin, so we should be careful about that.
27. to_csv()
Now, we can save our DataFrame in a CSV file using the pandas “to_csv()” function. As we don’t want to store the preceding indices of each row, hence, we will set index=False.

So we have covered various functions of Pandas, which helps in data exploration and data manipulation which eventually speeds up the data analysis process and provides valuable insights.
Thanks for Reading, and Keep Learning.
And if you found this article helpful, then please follow me on LinkedIn.
THE END
The media shown in this article are not owned by Analytics Vidhya and is used at the Author’s discretion.


For fillna() in paragraph 10, you referred to mode function, but you didn't actually invoke it. Correct line: df['driver_gender'].fillna(df['driver_gender'].mode(), inplace=True). Otherwise, you end up with 6 categories for gender feature instead of 5. Besides, nice and concise article.