Mean, Mode and Median – Measures of Central Tendency
In statistics, central tendency measures provide valuable insights into a dataset’s typical or central values. They help us understand the overall distribution and characteristics of a set of observations by identifying the central or representative value around which the data tend to cluster. This article will explore the concept of central tendency measures – mean, median, and mode in detail,
This article was published as a part of the Data Science Blogathon.
Table of contents
What are Data Types?
Data is largely divided into two major categories, quantitative and qualitative. They are further divided into other parts. Refer to the graph given below for reference –

Types of Data
- Quantitative data: This type of data consists of numerical values that can be measured or counted. Examples include time, speed, temperature, and the number of items.
- Qualitative data: This type includes non-numerical values representing qualities or attributes. Examples include colors, yes or no responses, and opinions.
Types of Quantitative Data
- Discrete data: This refers to separate and distinct values, typically counting numbers. For instance, the numbers on a dice or the number of students in a class are discrete data points.
- Continuous data: This type of data can take on any value within a range and be measured with high precision. Examples include height, weight, and temperature.
Data Types Based on Level of Measurement
Data can be further classified into four types based on the level of measurement: nominal, ordinal, interval, and ratio.
- Nominal data: This represents categorical information without any inherent order or ranking. Examples include gender, religion, or marital status.
- Ordinal data: This type has a defined order or ranking among the values. Examples include exam grades (A, B, C) or positions in a competition (1st place, 2nd place, 3rd place).
- Interval data: Interval data has a defined order and equal intervals between the values. An example is the Celsius temperature scale, where the difference between 30°C and 20°C is the same as the difference between 20°C and 10°C.
- Ratio data: Ratio data possesses all the characteristics of interval data but has a meaningful zero point. In addition to setting up inequalities, ratios can also be formed with this data type. Examples include height, weight, or income.
What is Measure of Central Tendency?
We should first understand the term Central Tendency. Data tend to accumulate around the average value of the total data under consideration. Measures of central tendency will help us to find the middle, or the average, of a data set. If most of the data is centrally located and there is a very small spread it will form an asymmetric bell curve. In such conditions values of mean, median and mode are equal.
Mean, Median, Mode
Let’s understand the definition and role of mean, median and mode with the help of examples –
Mean
It is the average of values. Consider 3 temperature values 30 oC, 40 oC and 50 oC, then the mean is (30+40+50)/3=40 oC.
Median
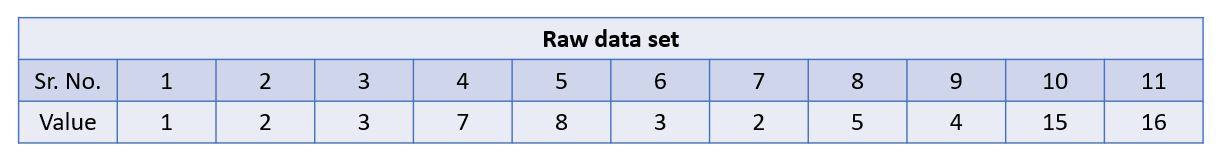
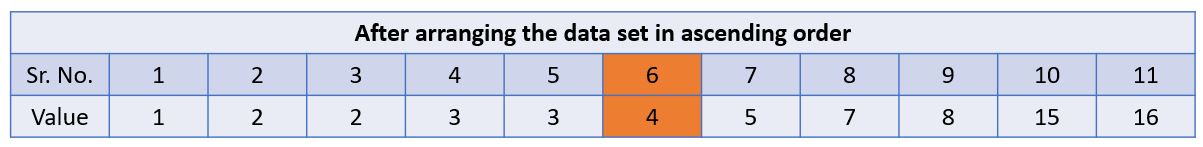
It is the centrally located value of the data set sorted in ascending order. Consider 11 (ODD) values 1,2,3,7,8,3,2,5,4,15,16. We first sort the values in ascending order 1,2,2,3,3,4,5,7,8,15,16 then the median is 4 which is located at the 6th number and will have 5 numbers on either side.
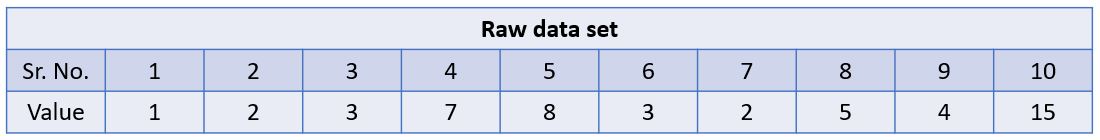
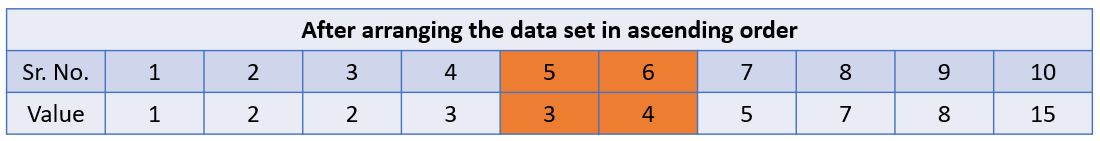
If the data set is having an even number of values then the median can be found by taking the average of the two middle values. Consider 10 (EVEN) values 1,2,3,7,8,3,2,5,4,15. We first sort the values in ascending order 1,2,2,3,3,4,5,7,8,15 then the median is (3+4)/2=3.5 which is the average of the two middle values i.e. the values which are located at the 5th and 6th number in the sequence and will have 4 numbers on either side.
Mode
It is the most frequent value in the data set. We can easily get the mode by counting the frequency of occurrence. Consider a data set with the values 1,5,5,6,8,2,6,6. In this data set, we can observe the following,
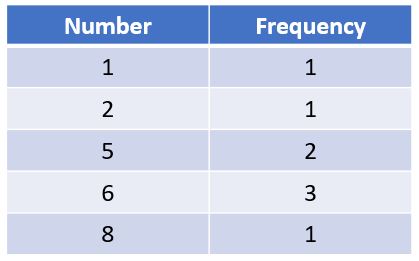
The value 6 occurs the most hence the mode of the data set is 6.
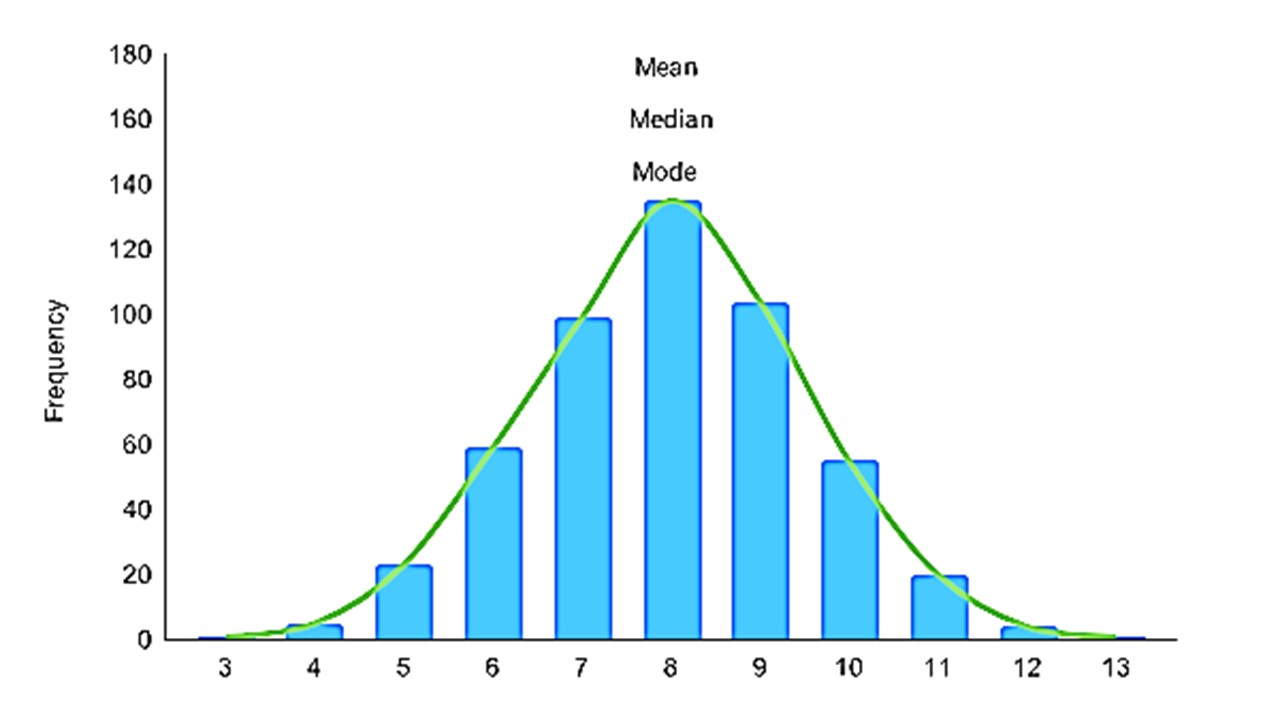
We often test our data by plotting the distribution curve, if most of the values are centrally located and very few values are off from the center then we say that the data is having a normal distribution. At that time the values of mean, median, and mode are almost equal.
However, when our data is skewed, for example, as with the right-skewed data set below:
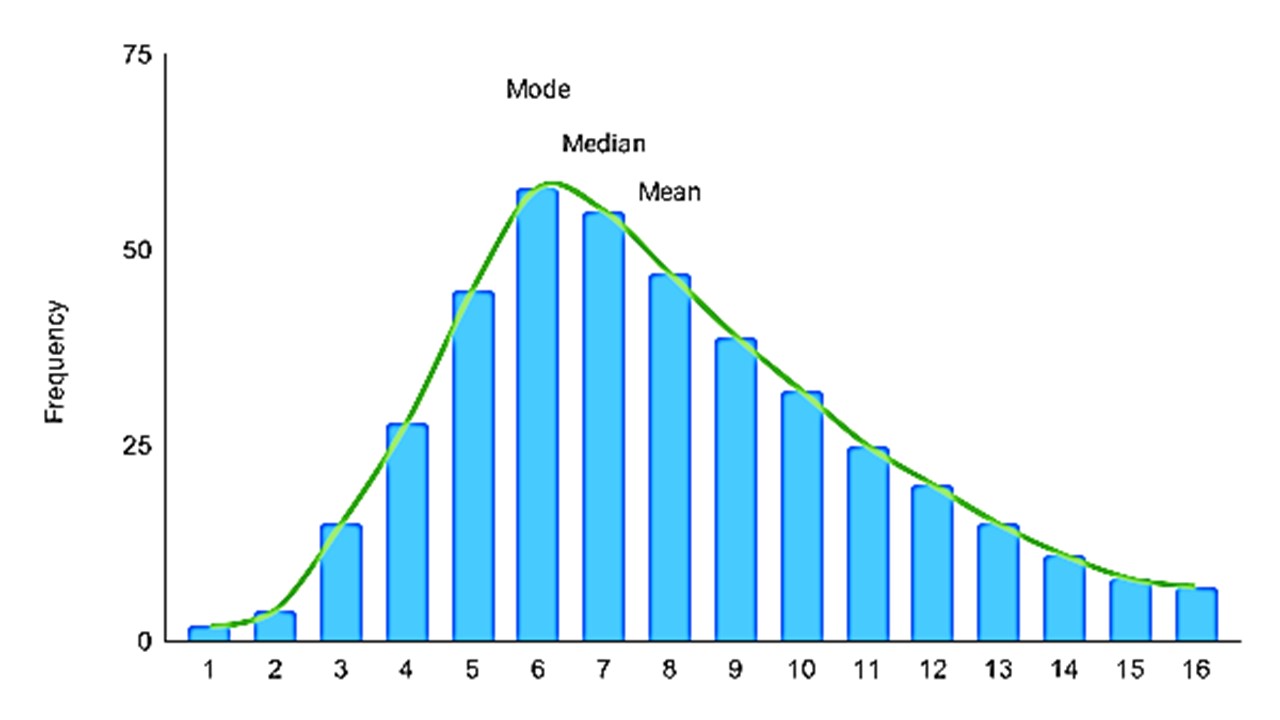
We can say that the mean is being dragged in the direction of the skew. In this skewed distribution, mode < median < mean. The more skewed the distribution, the greater the difference between the median and mean, here we consider median for the conclusion. The best example of the right-skewed distribution is salaries of employees, where higher-earners provide a false representation of the typical income if expressed as mean salaries and not the median salaries.
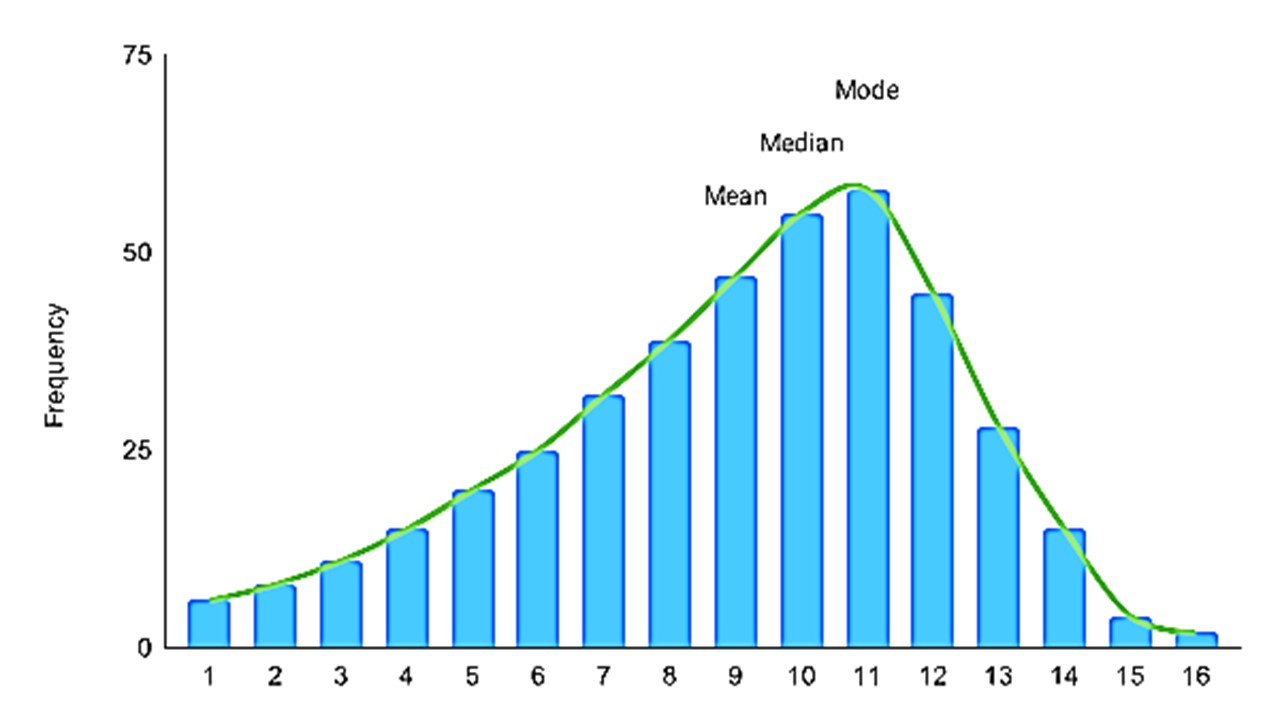
For left-skewed distribution mean < median < mode. In such a case also, we emphasize the median value of the distribution.
Mean, Median & Mode Example
To understand this let us consider an example. An OTT platform company has conducted a survey in a particular region based on the watch time, language of streaming, and age of the viewer. For our understanding, we have taken a sample of 10 people.
 df=pd.read_csv("viewer.csv")
 df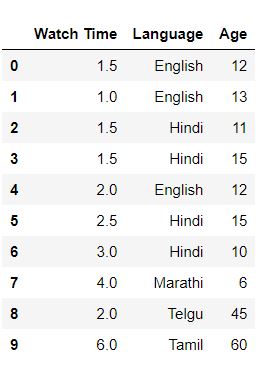
df["Watch Time"].mean()
2.5

df["Watch Time"].mode()
0    1.5
dtype: float64

df["Watch Time"].median()
2.0
If we observe the values then we can conclude the value of Mean Watch Time is 2.5 hours and which appears reasonably correct. For Age of viewer following results can be obtained,
df["Age"].median()
12.5

df["Age"].mean()
19.9

df["Age"].mode()
0    12
1    15
dtype: int64
The value of mean Age is looked somewhat away from the actual data. Most of the viewers are in the range of 10 to 15 while the value of mean comes 19.9. This is because the outliers present in the data set. We can easily find the outliers using a boxplot.
sns.boxplot(df['Age'], orient='vertical')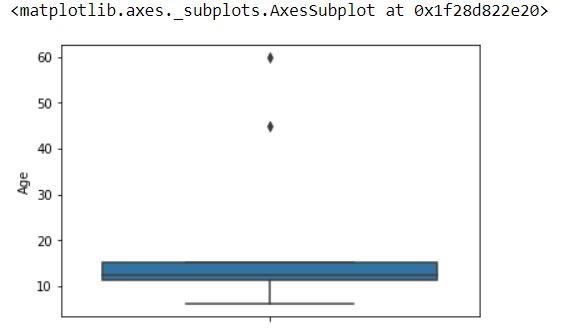
If we observe the value of Median Age then the result looks correct. The value of mean is very sensitive to outliers.
Now for the most popular language, we can not calculate the mean and median since this is nominal data.
sns.barplot(x="Language",y="Age",data=df)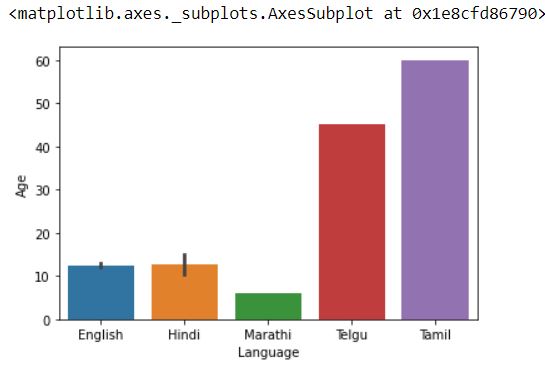
sns.barplot(x="Language",y="Watch Time",data=df)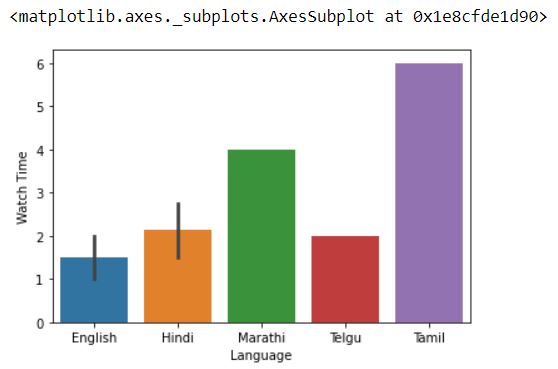
If we observe the graph then it is seen that the Tamil bar is largest for Language vs Age and Language vs Watch Time graph. But this will mislead the result because there is only one person who watches the shows in Tamil.
df["Language"].value_counts()
Hindi      4
English    3
Tamil      1
Telgu      1
Marathi    1
Name: Language, dtype: int64

df["Language"].mode()
0    Hindi
dtype: object
Result
From the above result, it is concluded that the most popular language is Hindi. This is observed when we find the mode of the data set.
Hence from the above observation, it is concluded that in the sample survey average age of viewers is 12.5 years who watch for 2.5 hours daily a show in the Hindi language.
We can say there is no best central tendency measure method because the result is always based on the types of data. For ordinal, interval, and ratio data (if it is skewed) we can prefer median. For Nominal data, the model is preferred and for interval and ratio data (if it is not skewed) mean is preferred.
Measures of Central Tendency and Dispersion
Dispersion measures indicate how data values are spread out. The range, which is the difference between the highest and lowest values, is a simple measure of dispersion. The standard deviation measures the expected difference between a data value and the mean.
Frequently Asked Questions
A. The four measures of central tendency are mean, median, mode, and midrange. Central tendency examples include finding the average age in a group, determining the middle value of test scores, or identifying the most frequently occurring color in a survey.
A. To find central tendency, calculate the mean by summing all values and dividing by the total number, find the median by locating the middle value, or determine the mode as the most commonly occurring value.
A. The best measure of central tendency depends on the type of data and the specific context of the analysis. The mean is commonly used, but other measures may be more appropriate in certain situations.
The media shown in this article are not owned by Analytics Vidhya and is used at the Author’s discretion.


Informative! Must read article for the beginers in data science. Thank you for simplifying things to understand.