How to use CatBoost For Mental Fatigue Score Prediction

According to a global survey, about 450 million people live with mental disorders, including anxiety, depression, which can be one of the primary causes of poor health, stress, and disability worldwide. And this problem is becoming more crucial with work from home. So if we have appropriate data we can predict if someone is having a high mental fatigue score and then the organization can take appropriate corrective steps to help that employee.
Mental fatigue score can be modeled as no between 0-1 and as these are continuous values we will be using machine learning regressors for predicting value. Depending on the dataset and need, this problem can be solved using various techniques such as linear regression, Lasso, and Ridge. I won’t go into detail about these strategies as we will talk about how to use CatBoost Regressor for this problem and its implementation in detail.
Why CatBoost?
- Highly accurate model building with great GPU or CPU training speed.
- The remarkable result with default parameters.
- It Works well with categorical variables (as the name itself suggests) and no need to preprocess them (like one-hot encoding).
- Cool Visualizations like Feature importance, training process visualization.
- Simple to use with Python package.
We will use the approach outlined below to solve this regression problem using CatBoost Regressor.
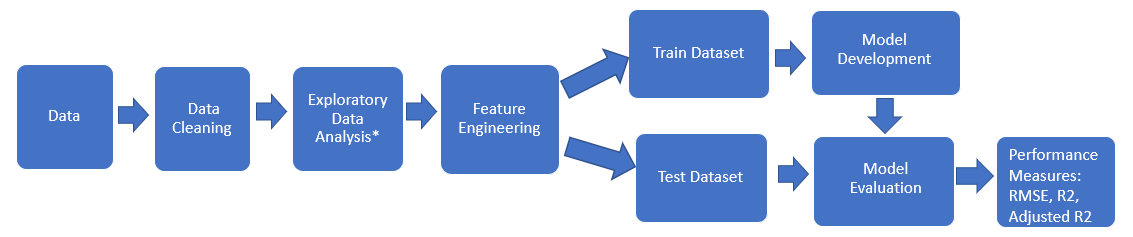
Let’s take a closer look at the details of each step in the implementation of CatBoost in Python for linear regression problems.
Installing catboost
We can install CatBoost using the following command:
pip install catboost
Since CatBoost has some cool visualization capabilities, we’ll need to install visualization software and then enable the extension using the commands below:
#Install Package
pip install ipywidgets
#Turn on extension
jupyter nbextension enable --py widgetsnbextension
Now that we have installed packages, we’ll start by importing the required libraries.
#Importing libraries
import numpy as np
import pandas as pd
import matplotlib.pyplot as plt
import seaborn as sns
from sklearn.model_selection import  train_test_split
from sklearn.metrics import mean_squared_error, r2_score
from catboost import CatBoostRegressor
import math
Load Dataset
Let’s get the dataset for this problem loaded. After loading it, we’ll look at the first five rows and try to figure out what the dataset is about. We can do this with the code below.
# Loading dataset from CSV file
df = pd.read_csv("train.csv",sep = ",")
#Let's look at shape and first 5 rows of dataset
print("shape of dataframe is : ", df.shape)
df.head()
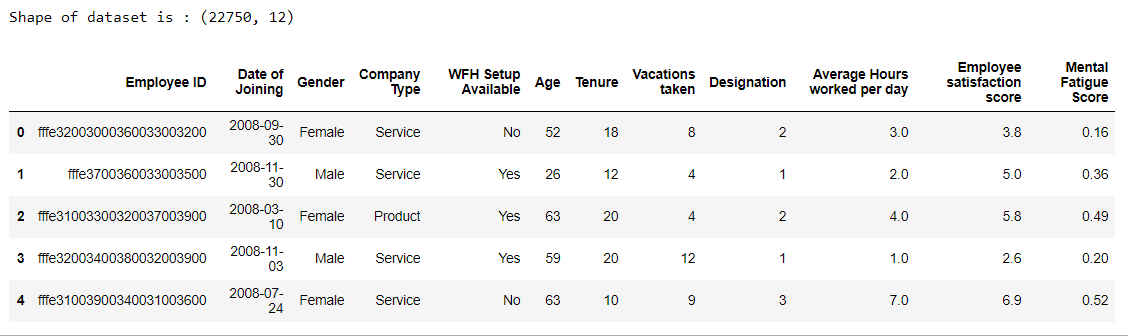
Dataset contains both numerical and categorical columns. There are a total of 22750 data points and 12 features.
Data Cleaning
Now that we’ve gotten a handle on the dataset, let’s see if there are any null values in it, as well as the percentage of null values in each column.
#Checking null value percentage column wise
df.isnull().mean()*100
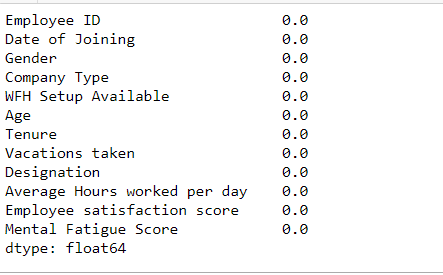
We can see that there are no null values. As a result, we can proceed to the next step.
However, if we have any null values, doing some research to explain the null value patterns is a crucial step. Then we can use mean, median, or mode to impute null values, or construct a new category called “missing,” or simply delete them if the percentage is very small. But that all depends on the dataset we’re working with.
Exploratory Data Analysis is a crucial stage after doing data cleaning. I am not demonstrating it here as we are focusing on how to implement CatBoost.
Feature Engineering
Following data cleaning and EDA, Feature Engineering is an important step. We can remove features that aren’t essential for model building, create new features from existing features, and create dummy variables for categorical features in feature engineering. All these steps depend on the problem statement. For our problem we will do the following steps :
- We will not create dummy variables for categorical columns since we’re using CatBoost, which doesn’t need categorical variables to be preprocessed like one hot encoding.
- Create a new column called “days_count” that counts how many days have passed since the date of entering.
- Drop the “employee ID” and “Date of Joining” columns because employee ID is just a special identifier, and we’ll use a newly generated column instead of Date of Joining
#function to find out total days
def create_days_count(data):
    return (current_date - data["Date of Joining"])
#Converting date of joining column to pandas datetime format
df["Date of Joining"] = pd.to_datetime(df["Date of Joining"])
#get todays date time
current_date = pd.to_datetime('today')
#Creating new column days_count
df["days_count"] = df.apply(create_days_count, axis=1).dt.days
#We will drop employeeid and date of joining columns.
df.drop(["Employee ID","Date of Joining"],axis=1,inplace=True)
Train-Test Split
Next, we will split data into dependent variables(X) and independent variables (y) that we would predict.
#creating independent variables as X and target/dependent variable as y
y= df.pop("Mental Fatigue Score")
X= df
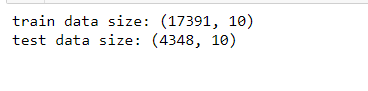
Following that, we’ll divide X and y into train and test sets. Let’s use 80% of the dataset for model training and 20% as a test dataset to validate the model on unseen data, as this test data set would include ground truth values.
#Let’s split X and y using Train test split
X_train,X_test,y_train,y_test = train_test_split(X,y,train_size=0.8,random_state= 42)
#get shape of train and test data
print("train data size:",X_train.shape)
print("test data size:",X_test.shape)
List Of Categorical Features
We must define what features are categorical. If no categorical features are defined, CatBoost will consider them as numerical.
#List of categorical columns
categoricalcolumns = X.select_dtypes(include=["object"]).columns.tolist()
print("Names of categorical columns : ", categoricalcolumns)
#Get location of categorical columns
cat_features = [X.columns.get_loc(col) for col in categoricalcolumns]
print("Location of categorical columns : ",cat_features)

Pool Object
- The Pool function in CatBoost combines independent and dependent variables (X and y), as well as categorical features.
- We pass Pool Object as a training data to fit() method
- We don’t need to define the “cat features” parameter separately when constructing the model since the pool object already has these details.
We will create a pool object using the below code.
# importing Pool
from catboost import Pool
#Creating pool object for train dataset. we give information of categorical fetures to parameter cat_fetaures
train_data = Pool(data=X_train,
                  label=y_train,
                  cat_features=cat_features
                 )
#Creating pool object for test dataset
test_data = Pool(data=X_test,
                  label=y_test,
                  cat_features=cat_features
                 )
Model Building And Training
- We’ll build a CatBoost model with default parameters.
- Since this is a regression task, we’ll use the RMSE measure as our loss function.
- Instead of giving (X_train, y_train) we are passing Pool Object created in earlier steps.
- This Pool object already has information about categorical features.
- Eval set is our 20%test data set.
- plot= True is for visualization of the training process.
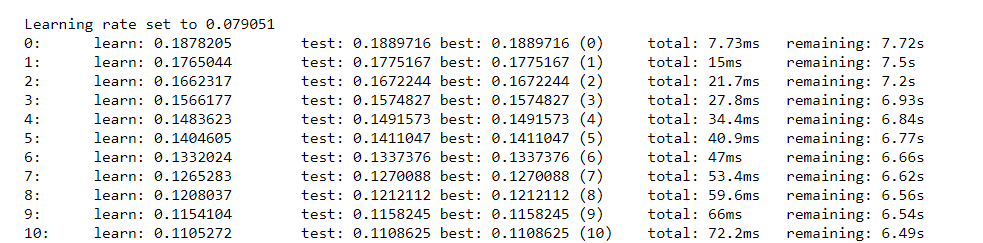
Let’s build and train the model using below code :
#build model
cat_model = CatBoostRegressor(loss_function='RMSE’)
# Fit model
cat_model.fit( X_train, y_train,
               eval_set=(X_test, y_test),
               plot=True
              )
Visualizing Training Process
Using plot=True and passing the test set in the eval_set parameter while fitting the CatBoost model, we can see a cool plot of how the model learns and if it starts overfitting also we can see at which iteration we got the best result for metrics we have used.
The plot also shows test and train data set accuracy at each iteration.
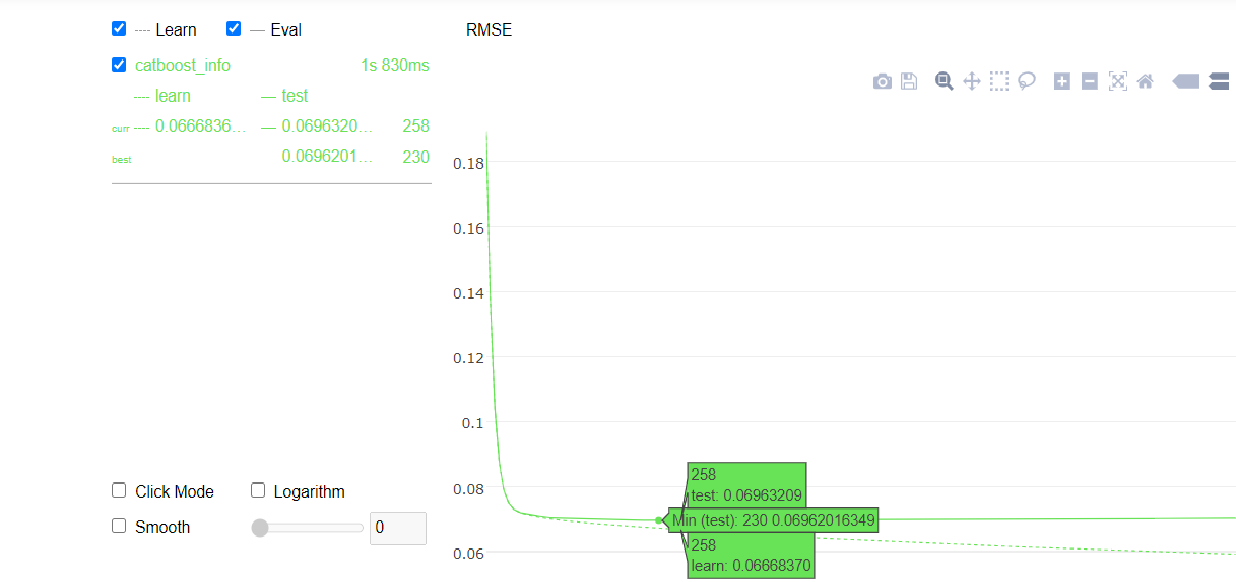
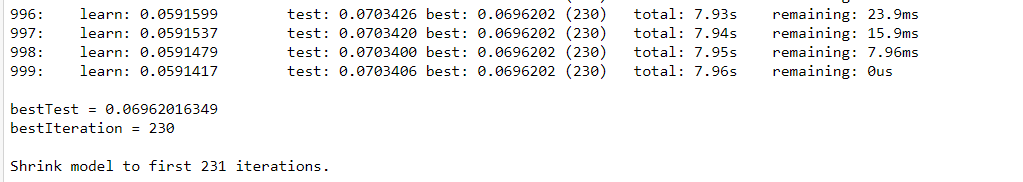
From the above graph we can infer that:
- We got the best value for RMSE at iteration 230.
- We can know the accuracy value for the train and test set at each iteration.
- After 230 iterations our rmse on train data set is decreasing but not much on the test data set.
Visualizing Feature Importance
Now, before we evaluate our model’s results, we’ll look at the importance of features. We’re showing features in order of priority and plotting them in a horizontal bar plot using the seaborn library, with the least important features at the bottom and the most important features at the top. We can use the below code for extracting feature importance from the model.
# Create a dataframe of feature importance
df_feature_importance = pd.DataFrame(cat_model.get_feature_importance(prettified=True))
#plotting feature importance
plt.figure(figsize=(12, 6));
feature_plot= sns.barplot(x="Importances", y="Feature Id", data=df_feature_importance,palette="cool");
plt.title('features importance');
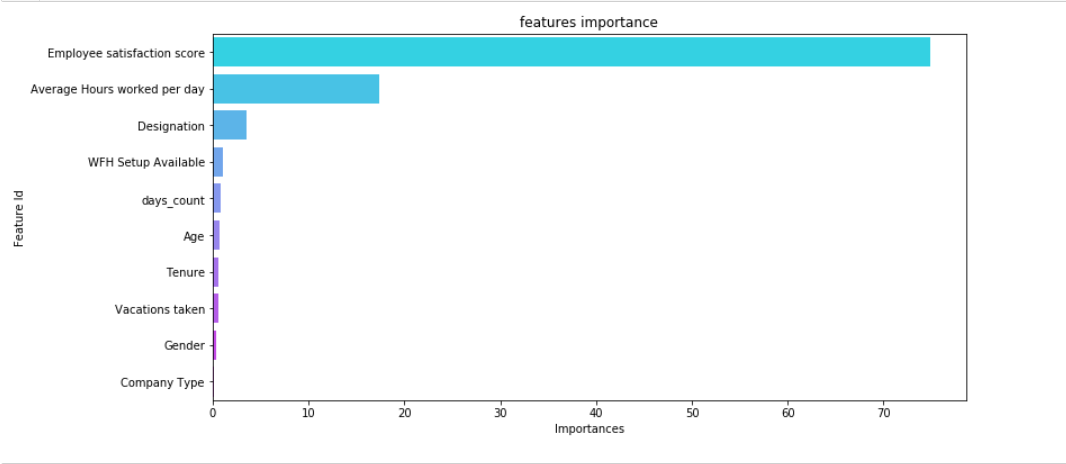
From the above plot we can see that :
- Employee satisfaction score has a major impact on mental fatigue score followed by Average Hours worked per day
- Age, company Type, gender, Tenure are not much significant in the prediction of mental fatigue scores.
Performance Evaluation On Test Data
We will use the below code to find the root mean square, r2 score, and adjusted r2 score for the test data set using the model trained above.
y_predict= cat_model.predict(X_test)
#RMSE
Rmse_test = math.sqrt(mean_squared_error(y_test,y_predict))
#R2 Score
r2_test = r2_score(y_test,y_predict)
# Adjusted R2 Score
n= X.train.shape[0] # total no of datapoints
p= X.train.shape[1] # total no of independent features
adj_r2_test = 1-(1-r2_test)*(n-1)/(n-p-1)
#print results
print("Evaluation on test data")
print("RMSE: {:.2f}".format(Rmse_test))
print("R2: {:.2f}".format(r2_test))
print("Adjusted R2: {:.2f}".format(adj_r2_test))
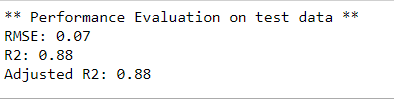
Using CatBoost with default parameters, we were able to achieve an accuracy of 88%. Techniques like hyperparameter tuning, cross-validations, and more feature engineering will help us increase accuracy even more. Let’s call it a day in our studies.
Conclusion
We learned how to used CatBoost Regressor for predicting mental fatigue scores. Using it with only default parameters gave us pretty good accuracy, also training of the model was much quicker. It performed well without preprocessing categorical variables so we saved the time required for preprocessing. Our model is not overfitted and can generalize to a test data set.
I hope you found this useful and will give it a try. Please feel free to drop any suggestions or questions in the comments below. I’ll be happy to get them.
Connect with me on LinkedIn.
The media shown in this article are not owned by Analytics Vidhya and is used at the Author’s discretion.


Good article, thank you.
very good ...