20 Questions to Test Your Skills on Feature Engineering and EDA
This article was published as a part of the Data Science Blogathon
Introduction
Feature Engineering and EDA (Exploratory Data analytics) are the techniques that play a very crucial role in any Data Science Project. These techniques allow our simple models to perform in a better way when used in projects.
Therefore it becomes necessary for every aspiring Data Scientist and Machine Learning Engineer to have a good knowledge of these techniques.
In this article, we will discuss the most important questions on the Feature Engineering and Exploratory Data Analysis (EDA) which is helpful to get you a clear understanding of the techniques, and also for Data Science Interviews, which covers its very fundamental level to complex concepts.
Let’s get started,
1. Why Feature Engineering is important in model building and lists out some of the techniques used for Feature Engineering?
Machine learning Algorithms require features having some specific characteristics so that they work appropriately. The data is initially in a raw format. So, at first, we need to extract the features from this data and then substitute them in the algorithms. This process is called Feature Engineering.
The complexity of the algorithms reduces when we have relevant features in hand. As a result, results come out to be accurate, even if a non-ideal algorithm is used to solve the problem.
The two primary goals of Feature Engineering are as follows:
- Prepare the input data suitable so that it can be compatible with the machine learning algorithm constraints.
- It enhances the performance of the machine learning models.
Some of the techniques used for Feature Engineering include Imputation, Binning, Outliers Handling, Log transform, Grouping Operations, One-Hot encoding, Feature split, Feature Scaling, Extracting data, etc.
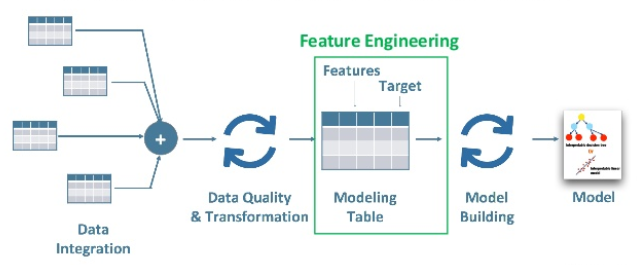
Image Source: Google Images
2. What is the importance of Data Cleaning?
Data Cleaning is a process of removing or updating information that is incorrect, incomplete, duplicated, irrelevant, or formatted improperly. It is very crucial to improve the data quality before doing any kind of analysis on them and as a result, the accuracy and productivity of the processes increase.
Real-world data is often captured in formats that have hygiene issues. Sometimes there arise errors due to various reasons which lead to data being inconsistent and due to certain features of the data.
Hence, the objective of the data cleaning is to filter the usable data from the raw data, otherwise many systems consuming the data will produce erroneous results.
3. What are the important steps of Data Cleaning?
- Data Quality
- Removing Duplicate Data (also irrelevant data)
- Structural errors
- Outliers or noisy data
- Treatment for Missing Data
Data Cleaning is an important step that involves about 80% of the time before analyzing data, it helps to increase the accuracy of the model. This helps organizations to make informed decisions.
4. What are the missing values? How do you handle missing values?
1. Delete the missing records: Ignoring such rows or dropping such records.
2. Central Tendency: Fill values with mean, mode, and median.
3. Different mean for different classes: Fill values using mean but for different classes, different means can be used.
4. Model Building: You can also fill the most probable value using regression, Bayesian formula, or decision tree, KNN, and Prebuilt imputing libraries.
5. Use constant Value: Fill with a constant value.
6. To fill the values manually.
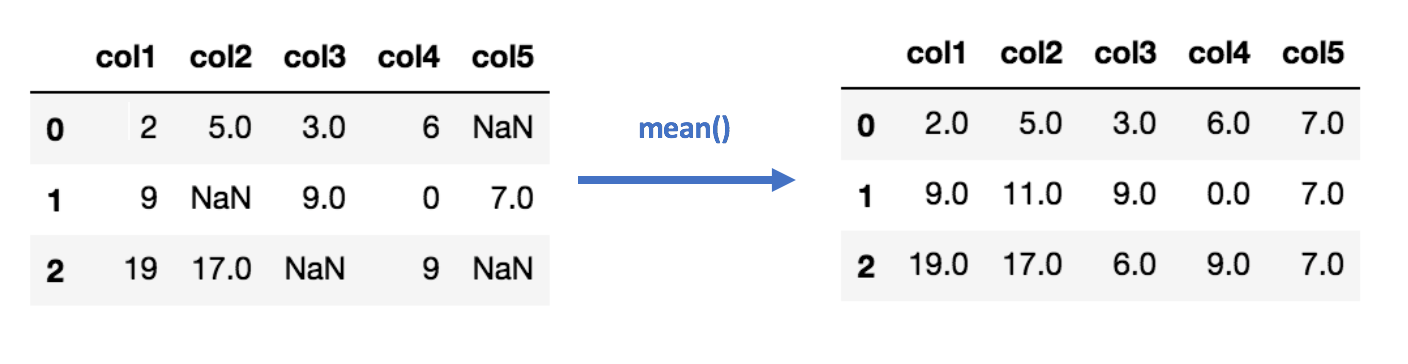
Image Source: Google Images
5. Name two useful methods of pandas that are useful to handle the missing values.
- isnull( )
- dropna( )
These help to find the columns of data with missing or corrupted data and drop those values. In cases where we want to fill the invalid values with a placeholder value such as 0, we can use the fillna() method.
6. When should you use classification over regression?
The classification produces discrete values and datasets to strict the categories, while regression gives continuous results that allow to better distinguish differences between individual points.
In order to represent the belonging of the data points to certain categories, we use classification over regression.
For example, If you wanted to know whether a name was male or female rather than just how correlated they were with male and female names.
7. Explain the phrase “Curse of Dimensionality”.
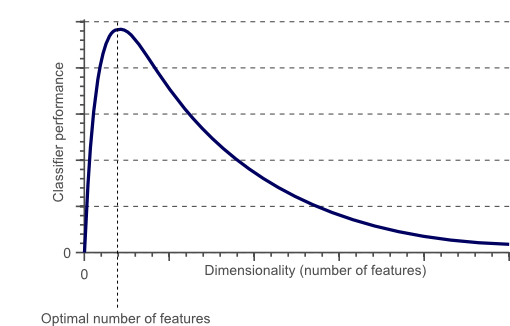
Image Source: Google Images
The phrase is used to describe the difficulty of using the brute force approach or grid search to optimize a function having too many inputs. Due to the increase in dimensionality, the following issues have come up:
- Overfitting: If we have more features than observations, we have a risk of overfitting the model.
- Sparsity: When we have too many features, observations become harder to cluster. Due to too many dimensions in our data, every data point in the dataset appears equidistant from all others and as a result, no meaningful clusters can be formed.
As a result, dimensionality reduction techniques like PCA have come into the picture to solve the problem of increased dimensionality.
8. What do you mean by Feature Splitting?
For Example, splitting names of objects into two parts- first and last names.
9. You have to train a 10GB dataset using a neural network and Support Vector Machines with a machine that has only 4GB RAM. How would you go about it?
Steps:
- Load the whole data into a Numpy array since the Numpy array creates a mapping of the complete data set. So, there is no need to load the dataset completely in the memory.
- To get the required data, you can pass an index to a Numpy array.
- Use this data and pass it to the Neural network as an input.
- Have a small batch size.
For Support Vector Machines (SVMs): Partial fit will work
Steps:
- Divide one big data set into small-size data sets.
- By using a partial fit method of SVM, and then gives the subset of the complete data set as input.
- Repeat step 2 for all the remaining subsets.
10. How can we use an unlabelled dataset(without having a target column) in Supervised Learning Algorithms?
Now, the dataset has both independent and dependent variables i.e, target column present.
So, this completes our objective to apply the supervised learning algorithms to the unlabeled data.
11. Is it possible to test the probability of improving the model accuracy without using cross-validation? If yes, please explain.
Yes, we can test for the probability of improving the accuracy of the model without using cross-validation techniques.
For doing this, We have to run our ML model for say K number of iterations, and then recording the accuracy. After that try to plot all the accuracies and remove the 5% of low probability values. Then, measure the left [low]and right [high] threshold, decided by the problem statement itself.
Now, with the remaining 95% confidence, we can say that the model can go as low or as high i.e, determine the range.
12. Explain One-hot encoding and Label Encoding. Does the dimensionality of the dataset increase or decrease after applying these techniques?
One-hot encoding is the representation of categorical variables as binary vectors while Label Encoding converts labels or words into numeric form.
One-hot encoding increases the dimensionality of the data set while Label encoding doesn’t affect the dimensionality of the data set since One-hot encoding creates a new variable for each level in the variable whereas, in Label encoding, the levels of a variable get encoded as 1 and 0 in replacement of the same column.
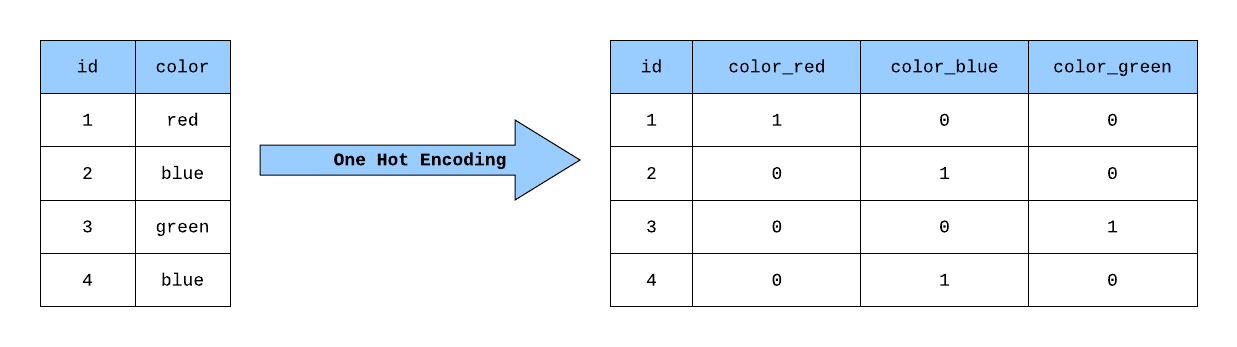
Fig. One Hot Encoding

Fig. Label Encoding
Image Source: Google Images
13. How do you select the important features while working on a dataset?
1. Multicollinearity: Identify and discard correlated variables before finalizing important variables.
2. Using the Linear Regression model: More explanatory variables could be selected based on the p-values obtained from the Linear Regression.
3. Wrapper Methods: Forward, Backward, and Stepwise selection
4. Regularization: Lasso Regression
5. Ensemble Technique: Apply Random Forest and then plot the variable chart
6. Information Gain: Top features can be selected based on information gain for the available set of features.
14. For a classification problem, how will you know which Machine Learning Algorithm to Choose?
- If accuracy is our major focus: Test different algorithms and cross-validate them.
- WhatIf we have a small training dataset: Use models that have low variance and high bias.
- If we have a large training dataset: Use models that have high variance and little bias.
15. List out some important methods of reducing dimensionality.
1. Use Feature Engineering and try to Combine the features and make a new set of features.
2. Use some form of algorithmic dimensionality reduction like Independent Component Analysis(ICA), Principal component analysis(PCA), or Linear Discriminant Analysis(LDA), etc.
16. Is it good to perform scaling before the split or after the split by keeping train and test split criteria in mind?
17. When can a categorical value be treated as a continuous variable and what effect does it have when done so?
So, if the independent variable is having ordinal data then it can be treated as continuous and its inclusion in the model increases the performance of the model.
18. If we have a date column in our dataset, then how will you perform Feature Engineering?
Moreover, we can extract the date, month, and year from that column also. All these features can impact your prediction and make our model robust.
For Example, Sales of the business can be impacted by month or day of the week.
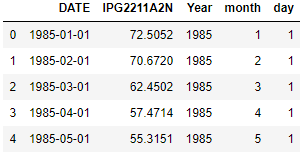
Image Source: Google Images
19. How would you handle an imbalanced dataset?
Here are a few suggestions to get rid of these problems:
- To collect more dataset that helps to even the imbalances in the dataset.
- Resample the dataset to correct for imbalances.
- Try a different algorithm altogether on your dataset.
So, it’s important that you have a keen sense of what damage an unbalanced dataset can cause, and how to balance that.
20. Which technique would you use in cases where the number of variables is greater than the number of observations in the dataset. Explain?
So, it is not possible to calculate a unique least-square coefficient estimate, and therefore we used the penalized regression methods like Least Angle regression(LARS), LASSO, or Ridge which seems to work well under these circumstances as they tend to shrink the coefficients in order to reduce the variance.
Moreover, in situations of higher variance of least square estimates Ridge Regression works better.
End Notes
Thanks for reading!
I hope you enjoyed the questions and were able to test your knowledge about Feature Engineering and Exploratory Data Analysis(EDA).
If you liked this and want to know more, go visit my other articles on Data Science and Machine Learning by clicking on the Link
Please feel free to contact me on Linkedin, Email.
Something not mentioned or want to share your thoughts? Feel free to comment below And I’ll get back to you.
About the author
Chirag Goyal
Currently, I pursuing my Bachelor of Technology (B.Tech) in Computer Science and Engineering from the Indian Institute of Technology Jodhpur(IITJ). I am very enthusiastic about Machine learning, Deep Learning, and Artificial Intelligence.
The media shown in this article are not owned by Analytics Vidhya and is used at the Author’s discretion.
I am currently pursuing my Bachelor of Technology (B.Tech) in Computer Science and Engineering from the Indian Institute of Technology Jodhpur(IITJ). I am very enthusiastic about Machine learning, Deep Learning, and Artificial Intelligence. Feel free to connect with me on Linkedin.


