Bagging- 25 Questions to Test Your Skills on Random Forest Algorithm
This article was published as a part of the Data Science Blogathon
Introduction
Random Forest (Ensemble technique) is a Supervised Machine Learning Algorithm that is constructed with the help of decision trees. This algorithm is heavily used in various industries such as Banking and e-commerce to predict behavior and outcomes.
Therefore it becomes necessary for every aspiring Data Scientist and Machine Learning Engineer to have a good knowledge of the Random Forest Algorithm.
In this article, we will discuss the most important questions on the Random Forest Algorithm which is helpful to get you a clear understanding of the Algorithm, and also for Data Science Interviews, which covers its very fundamental level to complex concepts.
Let’s get started,
1. What do you mean by Random Forest Algorithm?
Random forest is an ensemble machine learning technique that averages several decision trees on different parts of the same training set, with the objective of overcoming the overfitting problem of the individual decision trees.
In other words, a random forest algorithm is used for both classification and regression problem statements that operate by constructing a lot of decision trees at training time.
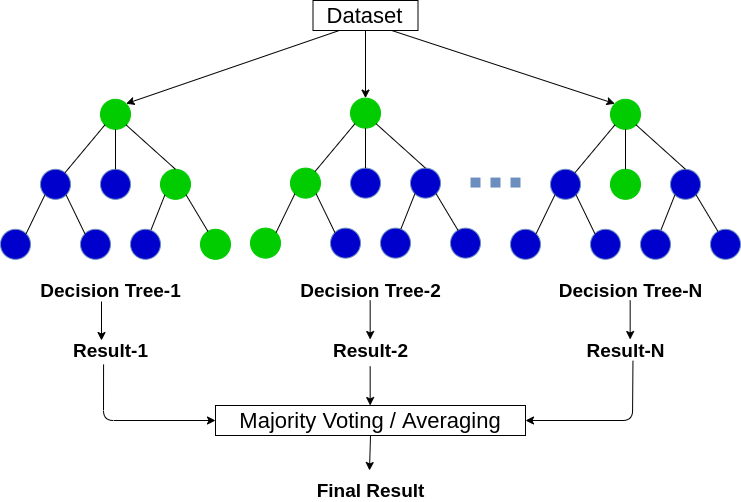
Image Source: Google Images
2. Why is Random Forest Algorithm popular?
Random Forest is one of the most popular and widely used machine learning algorithms for classification problems. It can also be used for the regression problem statements but it mainly performs well on the classification model.
It has become a lethal weapon for modern data scientists to refine the predictive model. The best part of the algorithm is that there are very few assumptions attached to it so data preparation is less challenging which results in time-saving. It’s listed as a top algorithm (with ensembling) that is popular among the Kaggle Competitions.
3. Can Random Forest Algorithm be used both for Continuous and Categorical Target Variables?
Yes, Random Forest can be used for both continuous and categorical target (dependent) variables.
In a random forest i.e, the combination of decision trees, the classification model refers to the categorical dependent variable, and the regression model refers to the numeric or continuous dependent variable.
4. What do you mean by Bagging?
By sampling with replacement, means some of the data points may be repeated in each new training data set. The K models are fitted using the K bootstrap samples formed and then for predictions we combined the result of all trees by averaging the output (for regression) or voting (for classification).

Image Source: Google Images
5. Explain the working of the Random Forest Algorithm.
Step-1: Pick K random records from the dataset having a total of N records.
Step-2: Build and train a decision tree model on these K records.
Step-3: Choose the number of trees you want in your algorithm and repeat steps 1 and 2.
Step-4: In the case of a regression problem, for an unseen data point, each tree in the forest predicts a value for output. The final value can be calculated by taking the mean or average of all the values predicted by all the trees in the forest.
and, in the case of a classification problem, each tree in the forest predicts the class to which the new data point belongs. Finally, the new data point is assigned to the class that has the maximum votes among them i.e, wins the majority vote.
6. Why do we prefer a Forest (collection of Trees) rather than a single Tree?
The problem of overfitting takes place when we have a flexible model. A flexible model is having high variance because the learned parameters like the structure of the decision tree, etc will vary with the training data. On the contrary, an inflexible model is said to have a high bias as it makes assumptions about the training data and an inflexible model may not have the capacity to fit even the training data and in both situations, the model has high variance, and high bias implies the model is not able to generalize new and unseen data points properly.
So, we have to build a model carefully by keeping the bias-variance tradeoff in mind.
The main reason for the overfitting of the decision tree due to not put the limit on the maximum depth of the tree is because it has unlimited flexibility, which means it keeps growing unless, for every single observation, there is one leaf node present.
Moreover, instead of limiting the depth of the tree which results in reduced variance and an increase in bias, we can combine many decision trees that eventually convert into a forest, known as a single ensemble model (known as the random forest).
7. What do you mean by Bootstrap Sample?
For Example, Suppose we have a box of lottery tickets in which there are 100 unique numbers from 0 to 99. We want to select a random sample of tickets from the box. If we put the ticket back in the box, it may be selected more than once. Therefore, in this process, we are picking the samples randomly from the box with replacement.

Image Source: Google Images
8. What is Out-of-Bag Error?
As the forest is built on training data, each tree is tested on 1/3rd of the samples (36.8%) that are not used in building that tree (similar to the validation data set).
This is known as the out-of-bag error estimate which in short is an internal error estimate of a random forest as it is being constructed.
9. What does random refer to in ‘Random Forest’?
- Random observations to grow each tree.
- Random variables selected for splitting at each node.
Random Record Selection: Each tree in the forest is trained on roughly 2/3rd of the total training data (exactly 63.2%) and here the data points are drawn at random with replacement from the original training dataset. This sample will act as the training set for growing the tree.
Random Variable Selection: Some independent variables(predictors) say, m are selected at random out of all the predictor variables, and the best split on this m is used to split the node.
NOTE:
- By default, m is taken as the square root of the total number of predictors for classification whereas m is the total number of all predictors divided by 3 for regression problems.
- The value of m remains constant during the algorithm run i.e, forest growing.
10. Why does the Random Forest algorithm not require split sampling methods?
This is because it performs internal testing on 2/3rd of the available training data that is used to grow each tree and the remaining one-third portion of training data is always used to calculate out-of-bag error to compute the model performance.
11. List down the features of Bagged Trees.
The main features of Bagged Trees are as follows:
1. Reduces variance by averaging the ensemble’s results.
2. The resulting model uses the entire feature space when considering node splits.
3. It allows the trees to grow without pruning, reducing the tree-depth sizes which result in high variance but lower bias, which can help improve the prediction power.
12. What are the Limitations of Bagging Trees?
Suppose from all the variables within the feature space, some are indicating certain predictions, so there is a risk of having a forest of correlated trees, which actually increases bias and reduces variance. So, our objective is not achieved due to these issues.
13. List down the factors on which the forest error rate depends upon.
1. How correlated the two trees in the forest are i.e,
The correlation between any two different trees in the forest. Increasing the correlation increases the forest error rate.
2. How strong each individual tree in the forest is i.e,
The strength of each individual tree in the forest. In a forest, a tree having a low error rate is considered a strong classifier. Increasing the strength of the individual trees eventually leads to a decrement in the forest error rate.
Moreover, reducing the value of mtry i.e, the number of random variables used in each tree reduces both the correlation and the strength. Increasing it increases both. So, in between, there exists an “optimal” range of mtry which is usually quite a wide range.
Using the OOB error rate, a value of mtry can quickly be found in the range. This parameter is only adjustable from which random forests are somewhat sensitive.
14. How does a Random Forest Algorithm give predictions on an unseen dataset?
For a binary dependent variable, the vote will be either YES or NO, and finally, it will count up the YES votes. This is the Random Forest (RF) score and the percent YES votes received is the predicted probability. In the regression case, it is the average of the dependent variable.
For example, suppose we fit 500 trees in a forest, and a case is out-of-bag in 200 of them:
- 160 trees vote class 1
- 40 trees vote class 2
In this case, the RF score is class1 since the probability for that case would be 0.8 which is 160/200. Similarly, it would be an average of the target variable for the regression problem.
15. Prove that in the Bagging method only about 63% of the total original examples (total training set) appear in any of sampled bootstrap datasets. Provide proper justification.
The detailed explanation of the proof is as follows:
Input: n labelled training examples S = {(xi, yi)},i = 1,..,n
Suppose we select n samples out of n with replacement to get a training set Si still different from working with the entire training set.
Pr(Si = S) = n!/nn (very small number, exponentially small in n)
Pr( (xi,yi) not in Si ) = (1-1/n)n = e-1 ~ 0.37
Hence for large data sets, about 37% of the data set is left out!
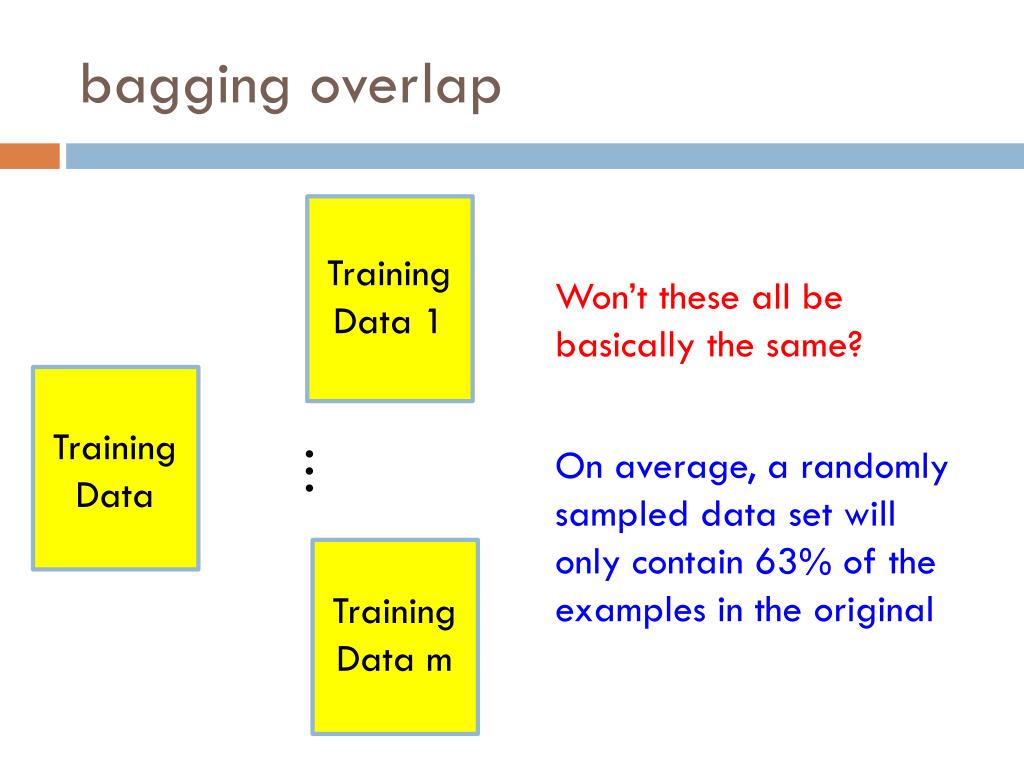
Image Source: Google Images
16. How to determine the overall OOB score for the classification problem statements in a Random Forest Algorithm?
For Example, If we grow 300 trees then on average a record will be OOB for about 37*3 =111 trees.
17. How does random forest define the Proximity (Similarity) between observations?
- Initialize proximities to zeroes.
- For any given tree, apply all the cases to the tree.
- If case i and case j both end up in the same node, then proximity prox(ij) between i and j increases by one.
- Accumulate over all trees in Random Forest and normalize by twice the number of trees in Random forest.
Finally, it creates a proximity matrix i.e, a square matrix with entry as 1 on the diagonal and values between 0 and 1 in the off-diagonal positions. Proximities are close to 1 when the observations are “alike” and conversely the closer proximity to 0, implies the more dissimilar cases are.
18. What is the use of proximity matrix in the random forest algorithm?
- Missing value imputation
- Detection of outliers
19. List down the parameters used to fine-tune the Random Forest.
- Number of trees used in the forest (n_tree)
- Number of random variables used in each of the trees in the forest (mtry)
20. How to find an optimal value of the hyperparameter “ n_tree”?
To find the value of n_tree (number of trees) that corresponds to a stable classifier, we train random forest models with different values of n_tree such as (100, 200, 300….,1,000).
As a result, we have 10 Random Forest classifiers in our hand for each value of n_tree, record the OOB error rate and see that value of n_tree where the out-of-bag error rate stabilizes and reaches its minimum value.
21. How to find an optimal value of the hyperparameter “mtry”?
1. Apply a similar procedure as in finding the optimal n_tree such that random forest is run 10 times. The optimal number of predictors selected for split is selected for which the out-of-bag error rate stabilizes and reaches the minimum.
2. In this method, we are doing the experiment by including the values such as the square root of the total number of all predictors, half of this square root value, and twice of the square root value, etc and at the same time check which value of mtry gives the maximum area under the curve.
For Example, Suppose we have 1000 predictors, then the number of predictors to select for each node would be 16, 32, and 64.
22. How do Random Forests select the Important Features?
The factors that are used to find the rank of the variables are as follows:
- Mean Decrease Accuracy: If we drop that variable, how much the model accuracy decreases.
- Mean Decrease Gini: This measure of variable importance is used for the calculation of splits in trees based on the Gini impurity index.
Conclusion: The higher the value of mean decrease accuracy or mean decrease Gini score, the higher the importance of the variable in the model.
23. Explain the steps of calculating Variable Importance in Random Forest.
The steps for calculating variable importance in Random Forest Algorithm are as follows:
1. For each tree grown in a random forest, find the number of votes for the correct class in out-of-bag data.
2. Now perform random permutation of a predictor’s values (let’s say variable-k) in the OOB data and then check the number of votes for the correct class. By “random permutation of a predictor’s values”, it means changing the order of values (shuffling).
3. At this step, we subtract the number of votes for the correct class in the variable-k-permuted data from the number of votes for the correct class in the original OOB data.
4. Now, the raw importance score for variable k is the average of this number over all trees in the forest. Then, we normalized the score by taking the standard deviation.
5. Variables having large values for this score are ranked as more important as building a current model without original values of a variable gives a worse prediction, which means the variable is important.
24. List down some of the shortcomings of the Random Forest Algorithm.
The shortcomings of the Random Forest algorithm are as follows:
1. Random Forests aren’t good at generalizing cases with completely new data.
For Example, If we know that the cost of one ice cream is $1, 2 ice-creams cost $2, and 3 ice-creams cost $3, then how much do 10 ice-creams cost? In such cases, Linear regression models can easily figure this out, while a Random Forest has no way of finding the answer.
2. Random forests are biased towards the categorical variable having multiple levels or categories. It is because the feature selection technique is based on the reduction in impurity and is biased towards preferring variables with more categories so the variable selection is not accurate for this type of data.
25. List down the advantages and disadvantages of the Random Forest Algorithm.
Advantages:
- Random Forest is unbiased as we train multiple decision trees and each tree is trained on a subset of the same training data.
- It is very stable since if we introduce the new data points in the dataset, then it does not affect much as the new data point impacts one tree, and is pretty hard to impact all the trees.
- Also, it works well when you have both categorical and numerical features in the problem statement.
- It performs very well, with missing values in the dataset.
Disadvantages:
- Complexity is the major disadvantage of this algorithm. More computational resources are required and also results in a large number of decision trees combined together.
- Due to their complexity, training time is more compared to other algorithms.
End Notes
Thanks for reading!
I hope you enjoyed the questions and were able to test your knowledge about Random Forest Algorithm.
If you liked this and want to know more, go visit my other articles on Data Science and Machine Learning by clicking on the Link
Please feel free to contact me on Linkedin, Email.
Something not mentioned or want to share your thoughts? Feel free to comment below And I’ll get back to you.
About the author
Chirag Goyal
Currently, I am pursuing my Bachelor of Technology (B.Tech) in Computer Science and Engineering from the Indian Institute of Technology Jodhpur(IITJ). I am very enthusiastic about Machine learning, Deep Learning, and Artificial Intelligence.
The media shown in this article are not owned by Analytics Vidhya and are used at the Author’s discretion.
I am currently pursuing my Bachelor of Technology (B.Tech) in Computer Science and Engineering from the Indian Institute of Technology Jodhpur(IITJ). I am very enthusiastic about Machine learning, Deep Learning, and Artificial Intelligence. Feel free to connect with me on Linkedin.


Thanku very much for all important questions. Helpful articles.