Detecting and Treating Outliers | Treating the odd one out!
Introduction
One of the most important steps as part of data preprocessing is detecting and treating the outliers as they can negatively affect the statistical analysis and the training process of a machine learning algorithm resulting in lower accuracy. In this article, we will be discussing how to handle outliers!

This article was published as a part of the Data Science Blogathon.
Table of contents
What are Outliers? 🤔
We all have heard of the idiom ‘odd one out which means something unusual in comparison to the others in a group. Similarly, an Outlier is an observation in a given dataset that lies far from the rest of the observations. That means an outlier is vastly larger or smaller than the remaining values in the set.
Why Do they Occur?
An outlier may occur due to the variability in the data, or due to experimental error/human error.
Quiz Time
Sharpen your knowledge of Detecting and Treating Outliers!
They may indicate an experimental error or heavy skewness in the data(heavy-tailed distribution).
What Do They Affect?
In statistics, we have three measures of central tendency namely Mean, Median, and Mode. They help us describe the data.
- Mean is the accurate measure to describe the data when we do not have any outliers present.
- Median is used if there is an outlier in the dataset.
- Mode is used if there is an outlier AND about ½ or more of the data is the same.
Mean’ is the only measure of central tendency that is affected by the outliers which in turn impacts Standard deviation.
Example
Consider a small dataset, sample= [15, 101, 18, 7, 13, 16, 11, 21, 5, 15, 10, 9]. By looking at it, one can quickly say ‘101’ is an outlier that is much larger than the other values.
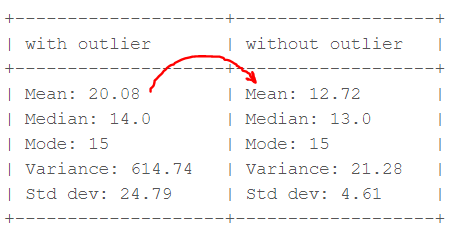
From the above calculations, we can clearly say the Mean is more affected than the Median.
Detecting Outliers
If our dataset is small, we can detect the outlier by just looking at the dataset. But what if we have a huge dataset, how do we identify the outliers then? We need to use visualization and mathematical techniques.
Below are some of the techniques of detecting outliers
- Boxplots
- Z-score
- Inter Quantile Range(IQR)
Detecting Outliers Using Boxplot
Python code for boxplot is:
Detecting Outliers using the Z-scores
Criteria: any data point whose Z-score falls out of 3rd standard deviation is an outlier.

Steps
- loop through all the data points and compute the Z-score using the formula (Xi-mean)/std.
- define a threshold value of 3 and mark the datapoints whose absolute value of Z-score is greater than the threshold as outliers.
import numpy as np
outliers = []
def detect_outliers_zscore(data):
    thres = 3
    mean = np.mean(data)
    std = np.std(data)
    # print(mean, std)
    for i in data:
        z_score = (i-mean)/std
        if (np.abs(z_score) > thres):
            outliers.append(i)
    return outliers# Driver code
sample_outliers = detect_outliers_zscore(sample)
print("Outliers from Z-scores method: ", sample_outliers)
The above code outputs: Outliers from Z-scores method: [101]
Detecting Outliers using the Inter Quantile Range(IQR)
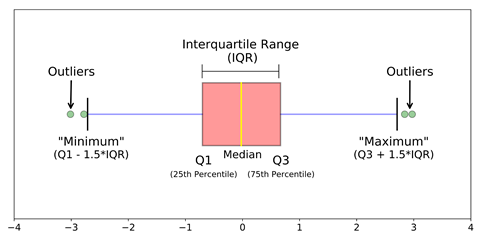
Criteria: data points that lie 1.5 times of IQR above Q3 and below Q1 are outliers. This shows in detail about outlier treatment in Python.
Steps
- Sort the dataset in ascending order
- calculate the 1st and 3rd quartiles(Q1, Q3)
- compute IQR=Q3-Q1
- compute lower bound = (Q1–1.5*IQR), upper bound = (Q3+1.5*IQR)
- loop through the values of the dataset and check for those who fall below the lower bound and above the upper bound and mark them as outliers
Python Code
outliers = []
def detect_outliers_iqr(data):
    data = sorted(data)
    q1 = np.percentile(data, 25)
    q3 = np.percentile(data, 75)
    # print(q1, q3)
    IQR = q3-q1
    lwr_bound = q1-(1.5*IQR)
    upr_bound = q3+(1.5*IQR)
    # print(lwr_bound, upr_bound)
    for i in data:
        if (i<lwr_bound or i>upr_bound):
            outliers.append(i)
    return outliers# Driver code
sample_outliers = detect_outliers_iqr(sample)
print("Outliers from IQR method: ", sample_outliers)
The above code outputs: Outliers from IQR method: [101]
How to Handle Outliers?
Till now we learned about detecting the outliers handling. The main question is how to deal with outliers?
Below are some of the methods of treating the outliers:
Step 1: Trimming/Remove the outliers
In this technique, we remove the outliers from the dataset. Although it is not a good practice to follow.
Python code to delete the outlier and copy the rest of the elements to another array.
# Trimming
for i in sample_outliers:
     a = np.delete(sample, np.where(sample==i))
print(a)
# print(len(sample), len(a))
The outlier ‘101’ is deleted and the rest of the data points are copied to another array ‘a’.
Step 2: Quantile Based Flooring and Capping
In this technique, the outlier is capped at a certain value above the 90th percentile value or floored at a factor below the 10th percentile value. Python code to delete the outlier and copy the rest of the elements to another array.
# Computing 10th, 90th percentiles and replacing the outliers
tenth_percentile = np.percentile(sample, 10)
ninetieth_percentile = np.percentile(sample, 90)
# print(tenth_percentile, ninetieth_percentile)b =
np.where(sample<tenth_percentile, tenth_percentile, sample)
b = np.where(b>ninetieth_percentile, ninetieth_percentile, b)
# print("Sample:", sample)
print("New array:",b)
The above code outputs: New array: [15, 20.7, 18, 7.2, 13, 16, 11, 20.7, 7.2, 15, 10, 9]
The data points that are lesser than the 10th percentile are replaced with the 10th percentile value and the data points that are greater than the 90th percentile are replaced with 90th percentile value.
Step 3: Mean/Median Imputation
As the mean value is highly influenced by the outliers, it is advised to replace the outliers with the median value.
Python Code:
median = np.median(sample)# Replace with median
for i in sample_outliers:
     c = np.where(sample==i, 14, sample)
print("Sample: ", sample)
print("New array: ",c)
# print(x.dtype)
Step 5: Visualizing the Data after Treating the Outlier
plt.boxplot(c, vert=False)
plt.title("Boxplot of the sample after treating the outliers")
plt.xlabel("Sample")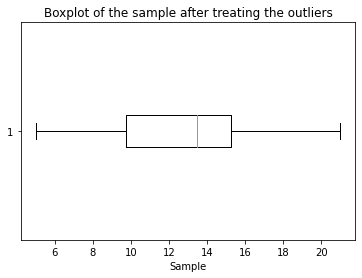
Conclusion
In conclusion, identifying and addressing outliers handling is paramount in data analysis. These data anomalies can skew results, leading to inaccurate insights and decisions. By employing robust detection techniques and thoughtful treatment strategies, we can enhance the integrity of our analyses and unlock hidden patterns within our data. How to Handle Outliers, in this article once understood and managed, become valuable sources of information, ultimately contributing to more informed and reliable decision-making processes.
References
- Z-score for Outlier detection
- IQR for outlier detection
- Python numpy.where() Method
- GitHub repo to check out the Jupyter notebook
I hope this blog helps understand the outliers concept. Please do upvote if you like it. Happy learning !! 😊
Frequently Asked Questions
A. To handle outliers effectively, analysts should identify them through visualization or statistical methods, evaluate their impact on analysis, and apply appropriate techniques like trimming, transformation, or exclusion to mitigate their influence.
A. Researchers address outliers by first detecting them using various statistical or data visualization tools. Subsequently, they evaluate the necessity of outlier treatment based on the research objectives. This can be done by employing techniques such as winsorization, transformation, or data stratification when required.
Dealing with outliers in prediction:
Identify outliers: Use Z-score analysis or visualization techniques.
Data preprocessing: Apply winsorization or data normalization.
Trimming: Remove extreme data points.
Robust models: Use models like robust regression or decision trees.
Ensemble methods: Combine predictions from multiple models.
Transformations: Apply logarithmic or power transformations to the data.
One common technique for handling outliers is trimming, where you remove the extreme values from your dataset. This can involve discarding values beyond a certain percentile or standard deviation from the mean. Trimming helps to reduce the impact of outliers on statistical analysis without completely removing them from the dataset.
The media shown in this article are not owned by Analytics Vidhya and is used at the Author’s discretion.


When I use the mentioned in 4.3, python gives an error ```ValueError: The truth value of an array with more than one element is ambiguous. Use a.any() or a.all()```. The error is on the line data=sorted(data). When comment that line, it gives the same error on the if condition line (if (iupr_bound):). Can you please me solve it? Thanks in Advance.
What a fantastic article. Thanks a lot Harika !
Hi. Nice explanation .Thank You While detecting outliers using Z score and IQR u have used all the data points. Isnt to be done for each feature separately.?