Geospatial Analysis | Getting Started With Folium In Python!
Often we come across some situations, where the data is best to be shown on a map for better understanding. The data we deal with in our day-to-day lives is usually confined to rows and columns, bar charts, pie charts, and histograms. But, today with more data-gathering resources and more computational power, it is possible for companies to use location and map data as well, in order to meet their data and analytics needs.
Table of contents
Importance of Maps and Location-based Data
Maps and location data make it easier to visualize data and hidden patterns, which might have been earlier unrecognizable in spreadsheets/excel.
For example, a dataset contains food delivery locations in a city, along with the order costs, items ordered, and other parameters. This data when visualized on a map will help identify factors like distance, proximity, clusters, etc.
Location-based data plotted on maps gives you the option of portraying a lot more information, and with easier visibility.
What is Geospatial Analysis?
Geospatial Analysis is a technique of building and analyzing map-based visualizations made from GPS data, sensors, mobile devices, satellite imagery, and other sources. Visuals can be maps, cartograms, graphs, etc.
The recognizable maps make it easy to understand and act upon. Location-based events are easily understandable using geospatial analysis. Location aspects often dictate various trends.
For example, a residential area in a city having more expensive properties will likely have people with higher incomes, and they will spend higher amounts of money.
Applications and Uses of Geospatial Analysis
There are various uses of Geospatial analysis.
- Geospatial analysis can be used to map natural resources, track weather phenomena like rainfall, snow, humidity, air pressure, etc.
- For telecommunication data, geospatial analysis can help understand connection strength, subscriber spread, and other parameters.
- Commercial data such as sales can be plotted on maps to analyze the most profitable locations and make better decisions.
- Urban planning and city planning can take the help of map-based analysis techniques to understand the growing population’s electricity and water needs.
- With the data plotted on a map, one can determine which regions need an urgent upgrade and more supply, and all aspects of urban planning can be done easily with proper geospatial analysis.
Introduction to Folium for Geospatial Analysis
Folium is a python library that can be used to visualize geospatial data. The simple commands in Folium make it the best choice to make plots on maps. Folium has a number of built-in tilesets from Mapbox, OpenStreetMap, and Stamen and also supports custom tilesets.
Installation of Folium :
pip install folium
Now, after Folium is installed, we now get started.
import numpy as np
import pandas as pd
We import NumPy and pandas.
# Create a map
kol = folium.Map(location=[22.57, 88.36], tiles='openstreetmap', zoom_start=12)
kol
We created a basic map of Kolkata in python.
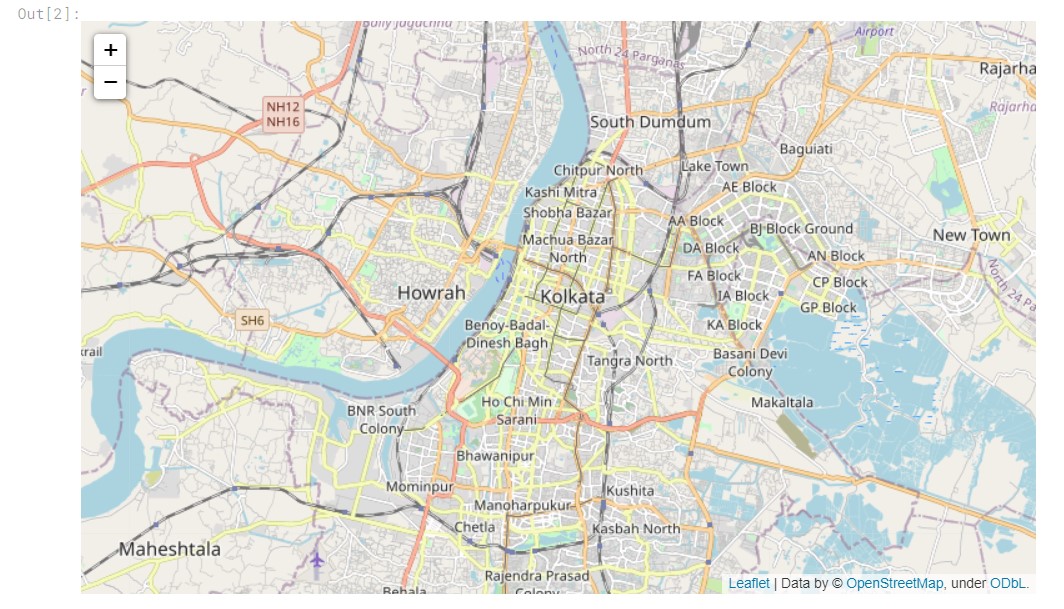
It can be zoomed in and out and moved around, I will share the Kaggle live notebook link at the end of the article. Let us now plot some interesting locations. In folium, to plot locations if you know the map coordinates is very easy.
#add marker for a place
#victoria memorial
tooltip_1 = "This is Victoria Memorial"
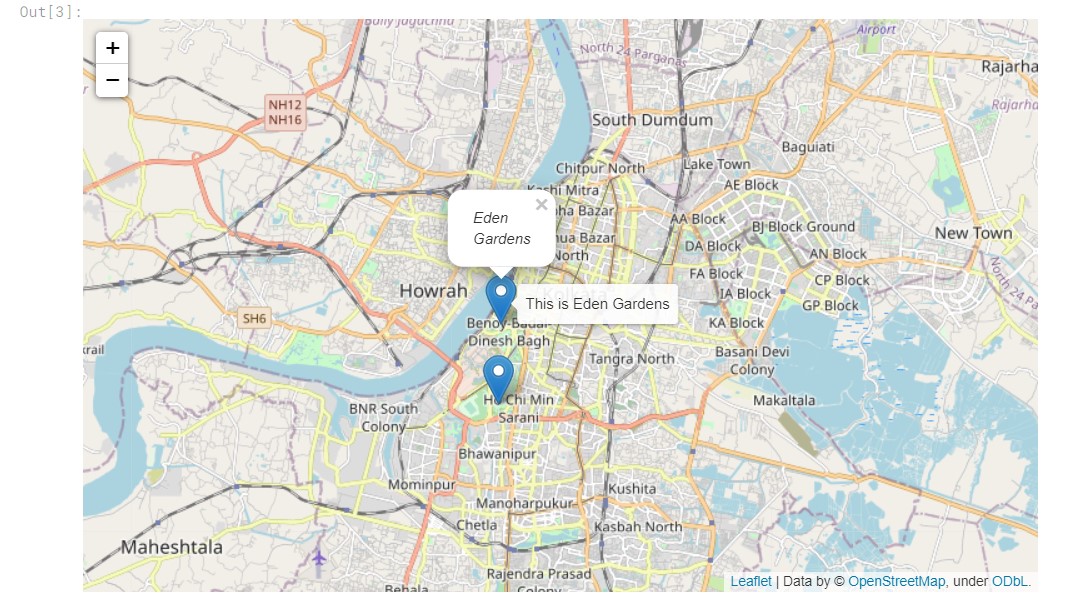
tooltip_2 ="This is Eden Gardens"
folium.Marker(
[22.54472, 88.34273], popup="Victoria Memorial", tooltip=tooltip_1).add_to(kol)
folium.Marker(
[22.56487826917627, 88.34336378854425], popup="Eden Gardens", tooltip=tooltip_2).add_to(kol)
kol
Let us look at the plot.
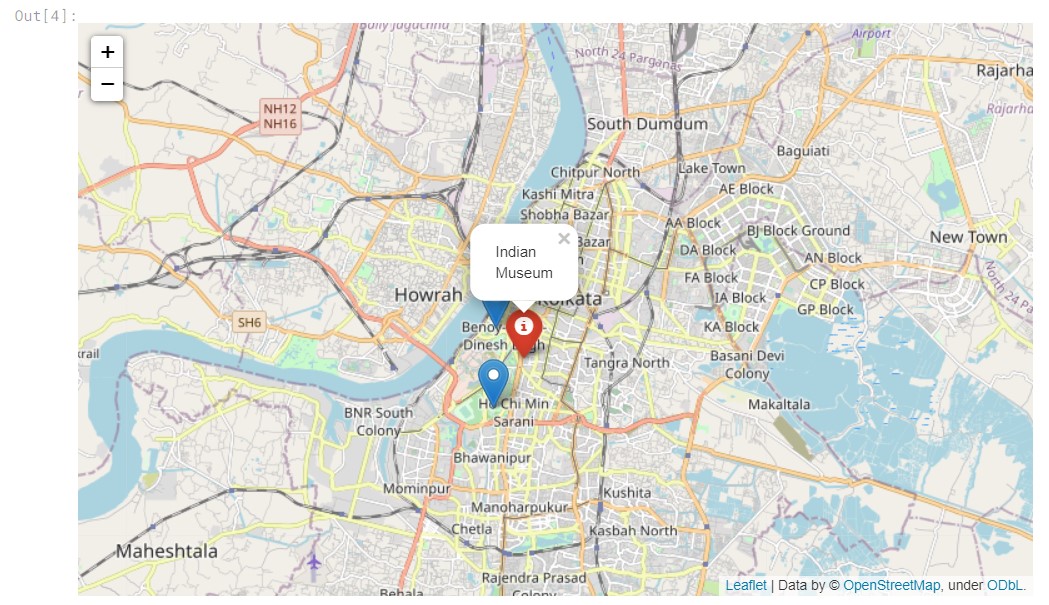
Now, let us add a different type of marker to our map.
folium.Marker(
    location=[22.55790780507432, 88.35087264462007],
    popup="Indian Museum",
    icon=folium.Icon(color="red", icon="info-sign"),
).add_to(kol)

kol
Here are the results of the above code. To know about the types of markers, you can check the documentation.
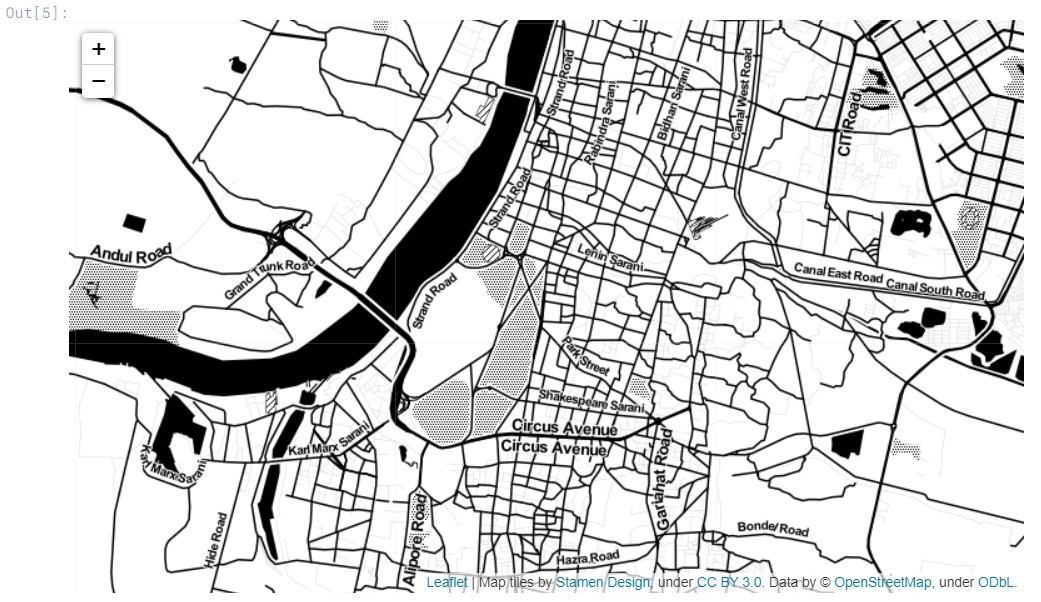
Let us now look at a different type of map, Stamen Toner.
kol2 = folium.Map(location=[22.55790780507432, 88.35087264462007], tiles="Stamen Toner", zoom_start=13)
kol2
Now, let us look at the output generated.
Adding markers to the map serves the purpose of labelling and identifying something. With labelling, one can mark any particular point of interest on the map.
Let us now add circles to our map.
#adding circle

folium.Circle(
    location=[22.585728381244373, 88.41462932675563],
    radius=1500,
    popup="Salt Lake",
    color="blue",
    fill=True,
).add_to(kol2)

folium.Circle(
    location=[22.56602918189088, 88.36508424354102],
    radius=2000,
    popup="Old Kolkata",
    color="red",
    fill=True,
).add_to(kol2)


kol2
Let us have a look at the output.
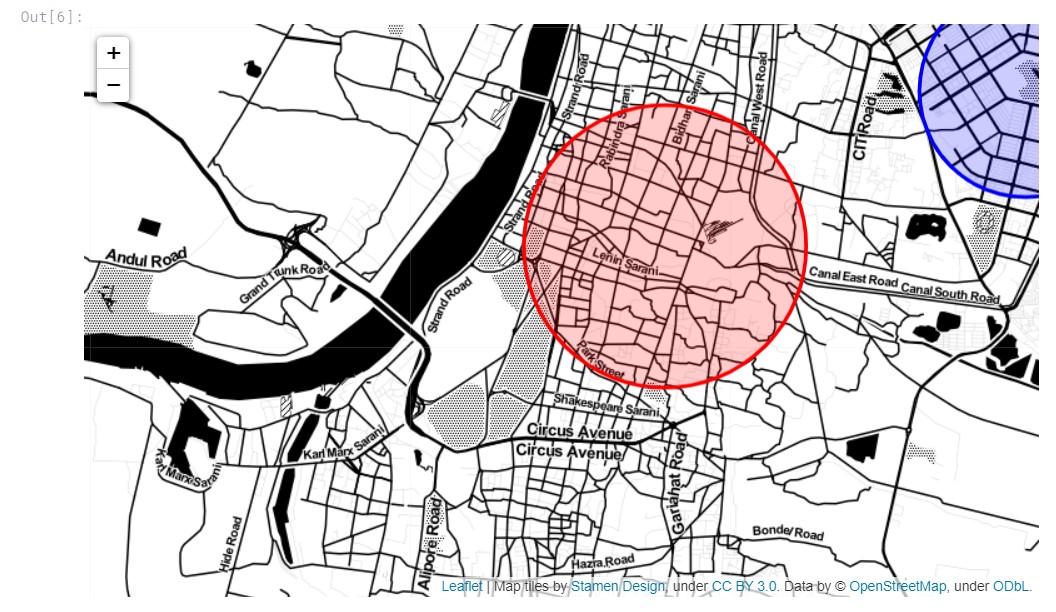
The map is movable and interactable. Usage of circles can be used for zoning and zone marking purposes in the case of real-life data.
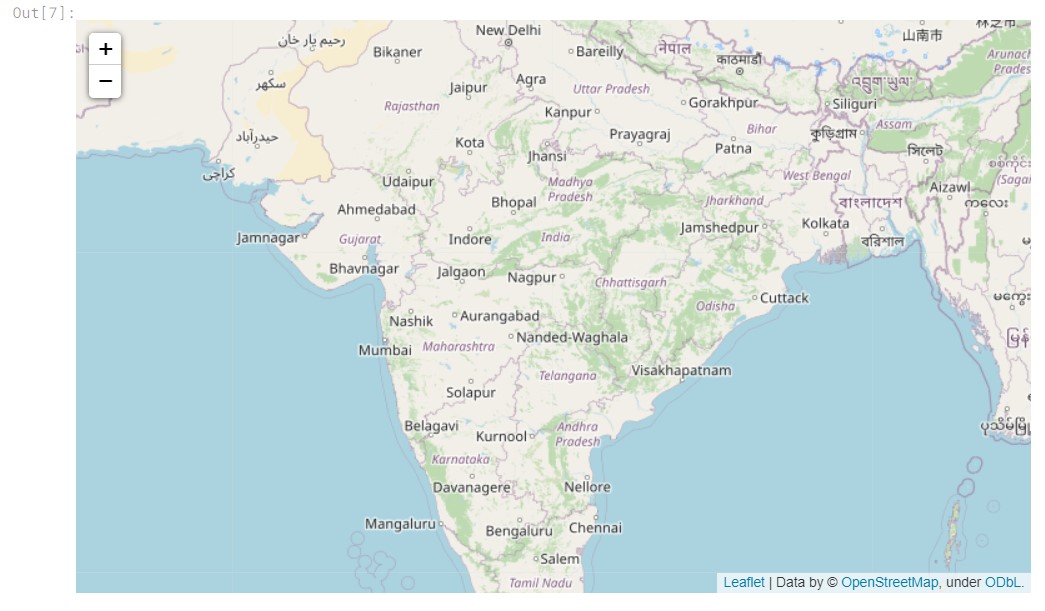
Let us now work on the map of India.
# Create a map
india = folium.Map(location=[20.180862078886562, 78.77642751195584], tiles='openstreetmap', zoom_start=5)
india
To, choose any specific place on the map, we can change the coordinates and edit the zoom_start parameter.
#adding 3 locations, Mumbai, Delhi and Kolkata
loc= [(19.035698150834815, 72.84981409864244),(28.61271068361265, 77.22359851696532) ,
      (22.564213404457185, 88.35872006950966)]
We will take three cities in India, and plot a line between them.
folium.PolyLine(locations = loc,
                line_opacity = 0.5).add_to(india)

india
Let us take a look at the output.
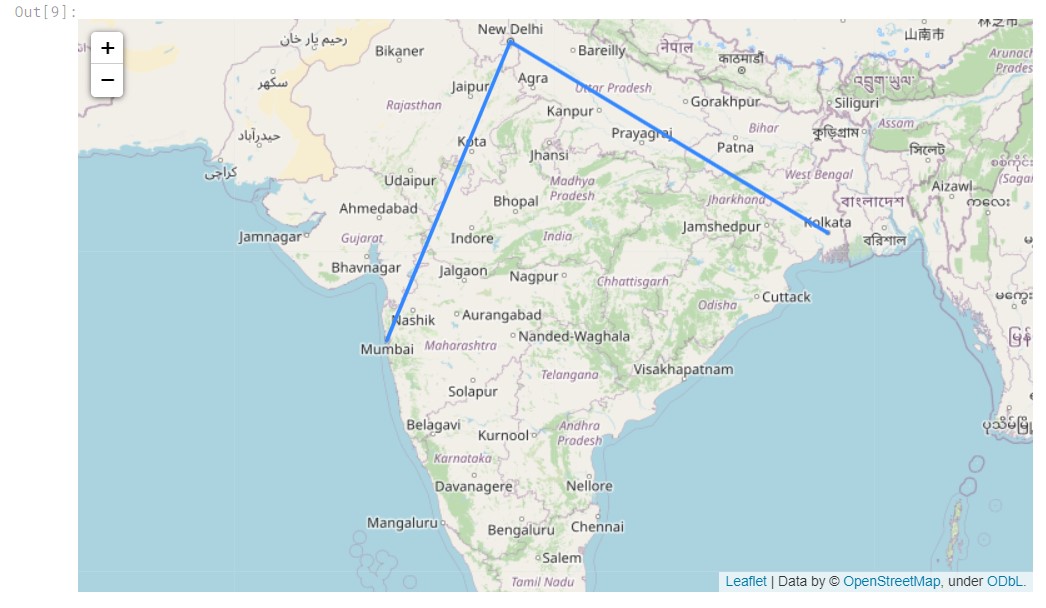
In this way, we can plot some basic data based on coordinates.
Now, let us work with a Kaggle dataset, having Indian states’ population centres as per 2011 census data. Let us proceed.
df_state=pd.read_csv("/kaggle/input/indian-census-data-with-geospatial-indexing/state wise centroids_2011.csv")
df_state.head()
The data looks like this :
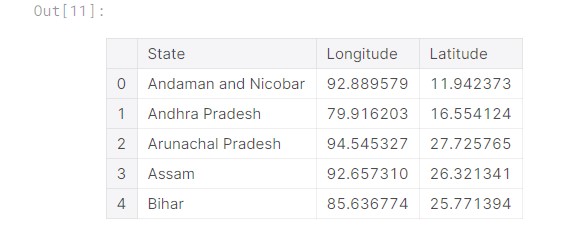
The data has 35 entries, now let us plot the data.
#creating a new map for India, for all states population centres to be plotted
# Create a map
india2 = folium.Map(location=[20.180862078886562, 78.77642751195584], tiles='openstreetmap', zoom_start=4.5)
#adding the markers

for i in range (0,35):
    state=df_state["State"][i]
    lat=df_state["Latitude"][i]
    long=df_state["Longitude"][i]
    folium.Marker(
    [lat, long], popup=state, tooltip=state).add_to(india2)
india2
Now, let us look at the plot.
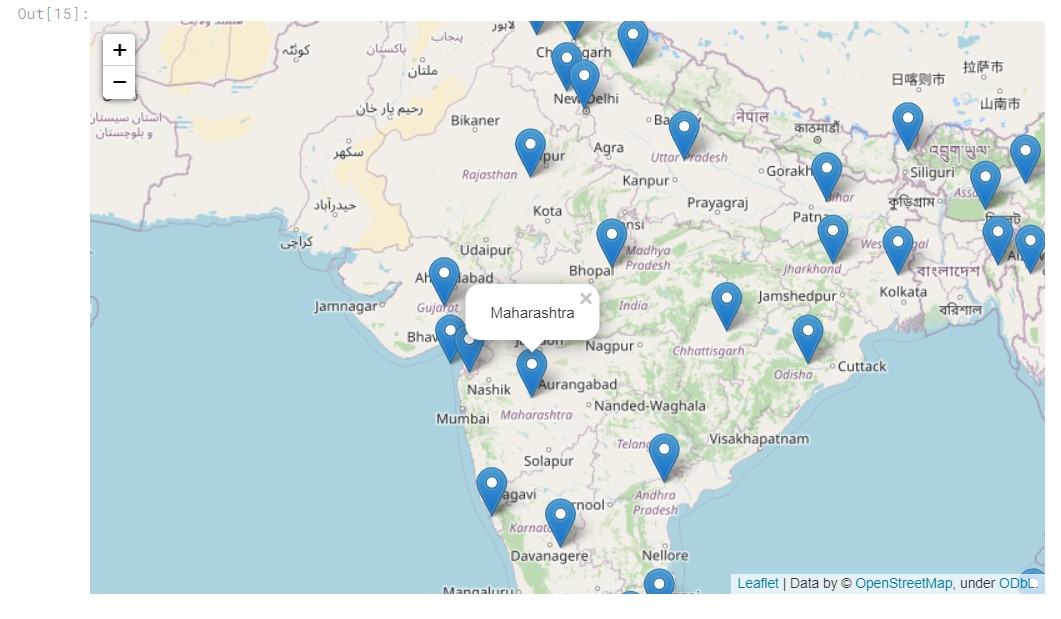
The plot is generated, and the location of each of the markers is the population centre for the respective state/UT.
Conclusion
Using maps we can understand and analyse data more easily and efficiently. With Folium, we get an easy way to plot points on the map and make sense of our data. Geospatial analysis is an important field that can help us understand spatial patterns, trends, and relationships in various domains. From mapping natural resources and tracking weather phenomena to commercial data analysis and urban planning, geospatial analysis applications are vast and diverse. Our BlackBelt program can be an excellent resource for those interested in diving deeper into this field, with a focus on practical applications and hands-on learning. By mastering the techniques and tools of geospatial analysis, professionals can gain a competitive edge in their careers and make significant contributions to their organizations.
Frequently Asked Questions
A. Analyzing the crime patterns in a city and overlaying the data on a map to identify high-crime zones is an example of geospatial analysis.
A. The best geospatial analysis methods are geographic information systems (GIS), remote sensing, spatial statistics, and network analysis. These methods involve processing and analyzing spatial data to gain insights and understand patterns.
A. No, geospatial analysis is not the same as GIS. GIS is a tool that helps to capture, store, manipulate, analyze, and visualize geospatial data. In contrast, geospatial analysis refers to analyzing spatial data to gain insights and make decisions.
You can start by learning the basics of GIS and spatial data to learn geospatial analysis. Many online courses, books, and tutorials cover data acquisition, data management, spatial analysis, and visualization. You can also gain practical experience by working on geospatial data analysis projects.
Prateek is a final year engineering student from Institute of Engineering and Management, Kolkata. He likes to code, study about analytics and Data Science and watch Science Fiction movies. His favourite Sci-Fi franchise is Star Wars. He is also an active Kaggler and part of many student communities in College.


