The Game of Increasing R-squared in a Regression Model
This article was published as a part of the Data Science Blogathon.
Introduction
After building a Machine Learning model, the next and very crucial step is to evaluate the model performance on the unseen or test data and see how good our model is against a benchmark model.
The evaluation metric to be used would depend upon the type of problem you are trying to solve —whether it is a supervised, unsupervised problem, or a mix of these (like semi-supervised), and if it is a classification or a regression task.
In this article, we will discuss two important evaluation metrics used for regression problem statements and we will try to find the key difference between them and learn why these metrics are preferred over Mean Squared Error (MSE) and Root Mean Squared Error (RMSE) for a regression problem statement.
Some Important questions which we are trying to understand in this article are as follows:
👉 The Game of increasing R-squared (R2)
👉 Why we go for adjusted-R2?
👉 When to use which from R2 and adjusted-R2?
Let’s first understand what exactly is R Squared?
R-squared, which sometimes is also known as the coefficient of determination, defines the degree to which the variance in the dependent variable (target or response) can be explained by the independent variable (features or predictors).
Let us understand this with an example — say the R2 value for a regression model having Income as an Independent variable (predictor) and, Expenditure as a dependent variable (response) comes out to be 0.76.
– In general terms, this means that 76% of the variation in the dependent variable is explained by the independent variables.
But for our defined regression problem statement, it can be understood as,
👉 76% variability in expenditure is associated or related with the regression equation and 24% variations are due to other factors.
👉76% variability in expenditure is explained by its linear relationship with income while 24% variations are uncounted for.
👉 76% variation in expenditure due to variation in income while we can’t say anything about the 24% variations. God knows better about it.
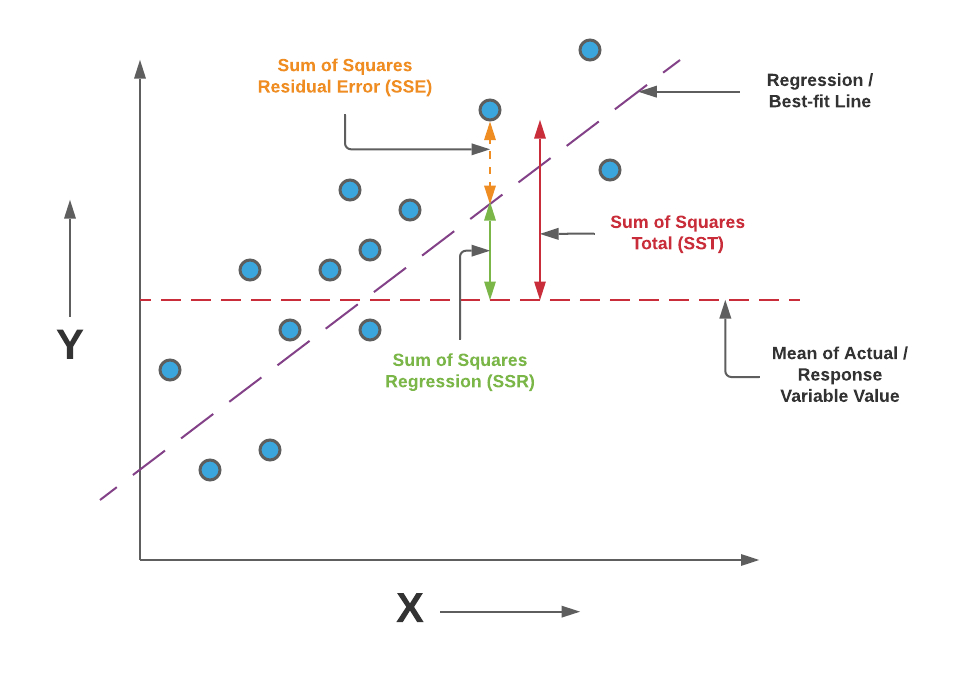
Image Source: link
Important points about R Squared
👉 Ideally, we would want the independent variables to explain the complete variations in the target variable. In that scenario, the R2 value would be equal to 1. Thus we can say that the higher the R2 value, the better is our model.
👉 In simple terms, the higher the R2, the more variation is explained by your input variables, and hence better is your model. Also, the R2 would range from [0,1]. Here is the formula for calculating R2–
The R2 is calculated by dividing the sum of squares of residuals from the regression model (given by SSRES) by the total sum of squares of errors from the average model (given by SSTOT) and then subtracting it from 1.
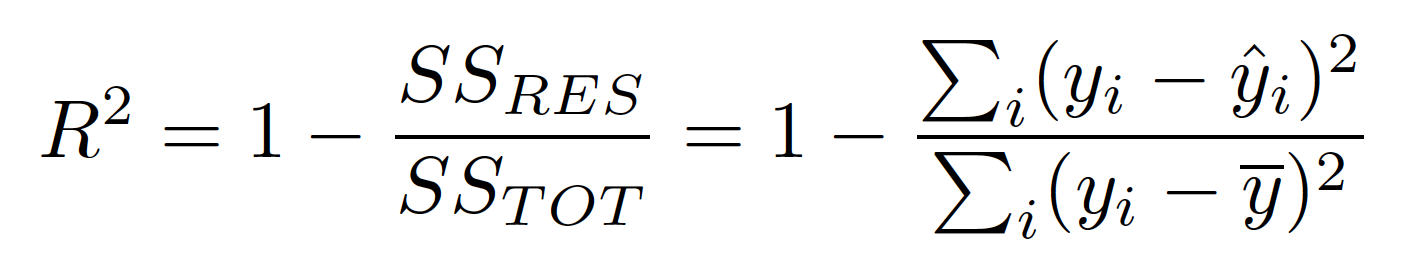
Fig. Formula for Calculating R2
Image Source: link
Drawbacks of using R Squared :
👉 Every time if we add Xi (independent/predictor/explanatory) to a regression model, R2 increases even if the independent variable is insignificant for our regression model.
👉 R2 assumes that every independent variable in the model helps to explain variations in the dependent variable. In fact, some independent variables don’t help to explain the dependent variable. In simple words, some variables don’t contribute to predicting the dependent variable.
👉 So, if we add new features to the data (which may or may not be useful), the R2 value for the model would either increase or remain the same but it would never decrease.
So, to overcome all these problems, we have adjusted-R2 which is a slightly modified version of R2.
Let’s understand what is Adjusted R2?
👉 Similar to R2, Adjusted-R2 measures the proportion of variations explained by only those independent variables that really help in explaining the dependent variable.
👉 Unlike R2, the Adjusted-R2 punishes for adding such independent variables that don’t help in predicting the dependent variable (target).
Let us mathematically understand how this feature is accommodated in Adjusted-R2. Here is the formula for adjusted R2
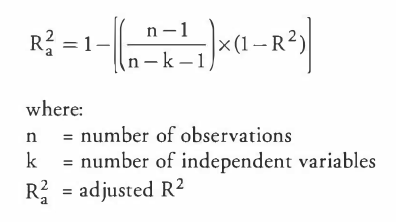
Fig. Formula for Calculating adjusted-R2
Image Source: link
Let’s take an example to understand the values changes of these metrics in a Regression model
For Example,
| Independent Variable | R2 | Adjusted-R2 |
| X1 | 67.8 | 67.1 |
| X2 | 88.3 | 85.6 |
| X3 | 92.5 | 82.7 |
In this example for a regression problem statement, we observed that the independent variable X3 is insignificant or it doesn’t contribute to explain the variation in the dependent variable. Hence, adjusted-R2 is decreased because the involvement of in-significant variable harms the predicting power of other variables that are already included in the model and declared significant.
R2 vs Adjusted-R2
👉 Adjusted-R2 is an improved version of R2.
👉 Adjusted-R2 includes the independent variable in the model on merit.
👉 Adjusted-R2 < R2
👉 R2 includes extraneous variations whereas adjusted-R2 includes pure variations.
👉 The difference between R2 and adjusted-R2 is only the degrees of freedom.
The Game of Increasing R2
Sometimes researchers tried their best to increase R2 in every possible way.
👉 One way to include more and more explanatory (independent) variables in the model because:
R2 is an increasing function of the number of independent variables i.e, with the inclusion of one more independent variable R2 is likely to increase or at least will not decrease.
When to use which?
Comparing models using R2
Comparing two models just based on R2 is dangerous as,
👉 Models having a different number of independent variables may have an equal value of R2.
👉 Total sample size and respective degrees of freedom are ignored.
Hence, there is a likelihood that one would choose the wrong model.
Problem solved by adjusted-R2
To compare two different models, or choose the best model, the adjusted-R2 is used because:
👉 It is adjusted for the respective degree of freedom.
👉 It takes into account the total sample size and number of independent variables.
👉 It is not an increasing function of the number of independent variables.
👉 It only increases if newly independent variables have an impact on the dependent variable.
CONCLUSION:
So, concluding the discussion we say that,
👉 R2 can be used to access the goodness of fit of a single model whereas,
👉Adjusted-R2 is used to compare two models and to see the real impact of newly added independent variables.
👉 Adjusted-R2 should be used while selecting important predictors for the regression model.
End Notes
Thanks for reading!
If you liked this and want to know more, go visit my other articles on Data Science and Machine Learning by clicking on the Link
Please feel free to contact me on Linkedin, Email.
Something not mentioned or want to share your thoughts? Feel free to comment below And I’ll get back to you.
About the author
Chirag Goyal
Currently, I am pursuing my Bachelor of Technology (B.Tech) in Computer Science and Engineering from the Indian Institute of Technology Jodhpur(IITJ). I am very enthusiastic about Machine learning, Deep Learning, and Artificial Intelligence.
The media shown in this article on Top Machine Learning Libraries in Julia are not owned by Analytics Vidhya and is used at the Author’s discretion.
I am currently pursuing my Bachelor of Technology (B.Tech) in Computer Science and Engineering from the Indian Institute of Technology Jodhpur(IITJ). I am very enthusiastic about Machine learning, Deep Learning, and Artificial Intelligence. Feel free to connect with me on Linkedin.


