Build Web App instantly for Machine Learning using Streamlit
This article was published as a part of the Data Science Blogathon
What is Streamlit?
Streamlit is an open-source python framework for building web apps for Machine Learning and Data Science. We can instantly develop web apps and deploy them easily using Streamlit. Streamlit allows you to write an app the same way you write a python code. Streamlit makes it seamless to work on the interactive loop of coding and viewing results in the web app.
Installing Streamlit
1. Make sure you have python installed in your system
2. Use the following command to install streamlit,
pip install streamlit
Check out the Github repo of streamlit here, and their documentation here.
The flow of Streamlit while developing a web app
Running a streamlit app
First, you create a python script with streamlit commands and execute the script using the following command,
streamlit run <yourscript.py>
After running this a sample app will open in a new tab in your default browser.
Development flow
If the source code of the streamlit’s python script changes the app shows whether to rerun the application or not in the top-right corner. You can also select the ‘Always rerun’ option to rerun always when the source script changes.
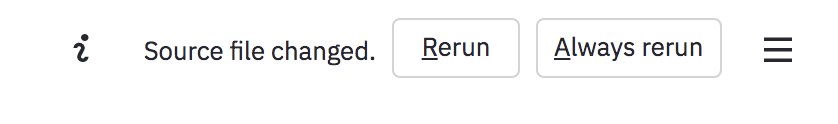
This makes our development flow much easier, every time you make some changes it’ll reflect immediately in your web app. This loop between coding and viewing results live makes you work seamlessly with streamlit.
Data flow
Streamlit allows you to write an app the same way you write a python code. The streamlit has a distinctive data flow, any time something changes in your code or anything needs to be updated on the screen, streamlit reruns your python script entirely from the top to the bottom. This happens when the user interacts with the widgets like a select box or drop-down box or when the source code is changed.
If you have some costly operations while rerunning your web app, like loading data from databases, you can use streamlit’s st.cache method to cache those datasets, so that it loads faster.
Displaying the data
Streamlit provides you with many methods to display various types of data like arrays, tables, and data frames.
- To write a string simply use, st.write(“Your string”)
- To display a data frame use, st.dataframe method
Widgets
There are several widgets available in streamlit, like st.selectbox, st.checkbox, st.slider, and etc. Let us see an example for widget in streamlit.
import streamlit as st
value = st.slider('val')  # this is a widget
st.write(value, 'squared is', value * value)
During the first run, the web app would output the string “0 squared is 0”, and then if a user increases or decreases the widget, the code is rerun by the streamlit from top to bottom and assigns the present state of the widget to the variable.
For example, if the user slides the slider to point 15, streamlit will rerun the code and output the following string “15 squared is 225”.
Layout
You can easily arrange your widgets or data seamlessly using the st.sidebar method. This method helps you to align data in the left panel sidebar. All you have to do is simply use st.sidebar.selectbox to display a selectbox in the left panel.
Let’s summarize the working of streamlit
- Streamlit runs the python script from top to bottom
- Each time the user interacts the script is a rerun from top to bottom
- Streamlit allows you to use caching for costly operations like loading large datasets.
Let’s get started with streamlit!
Let’s write a title and a DataFrame in the web app using streamlit.
import pandas as pd
import streamlit as st

st.title("Welcome to Streamlit!")

st.write("Our first DataFrame")

st.write(
  pd.DataFrame({
      'A': [1, 2, 3, 4],
      'B': [5, 6, 7, 8]
    })
)
Now execute the following command in your console,
streamlit run streamlit_app.py
After executing the command access the following URL to see the following result, http://localhost:8501/
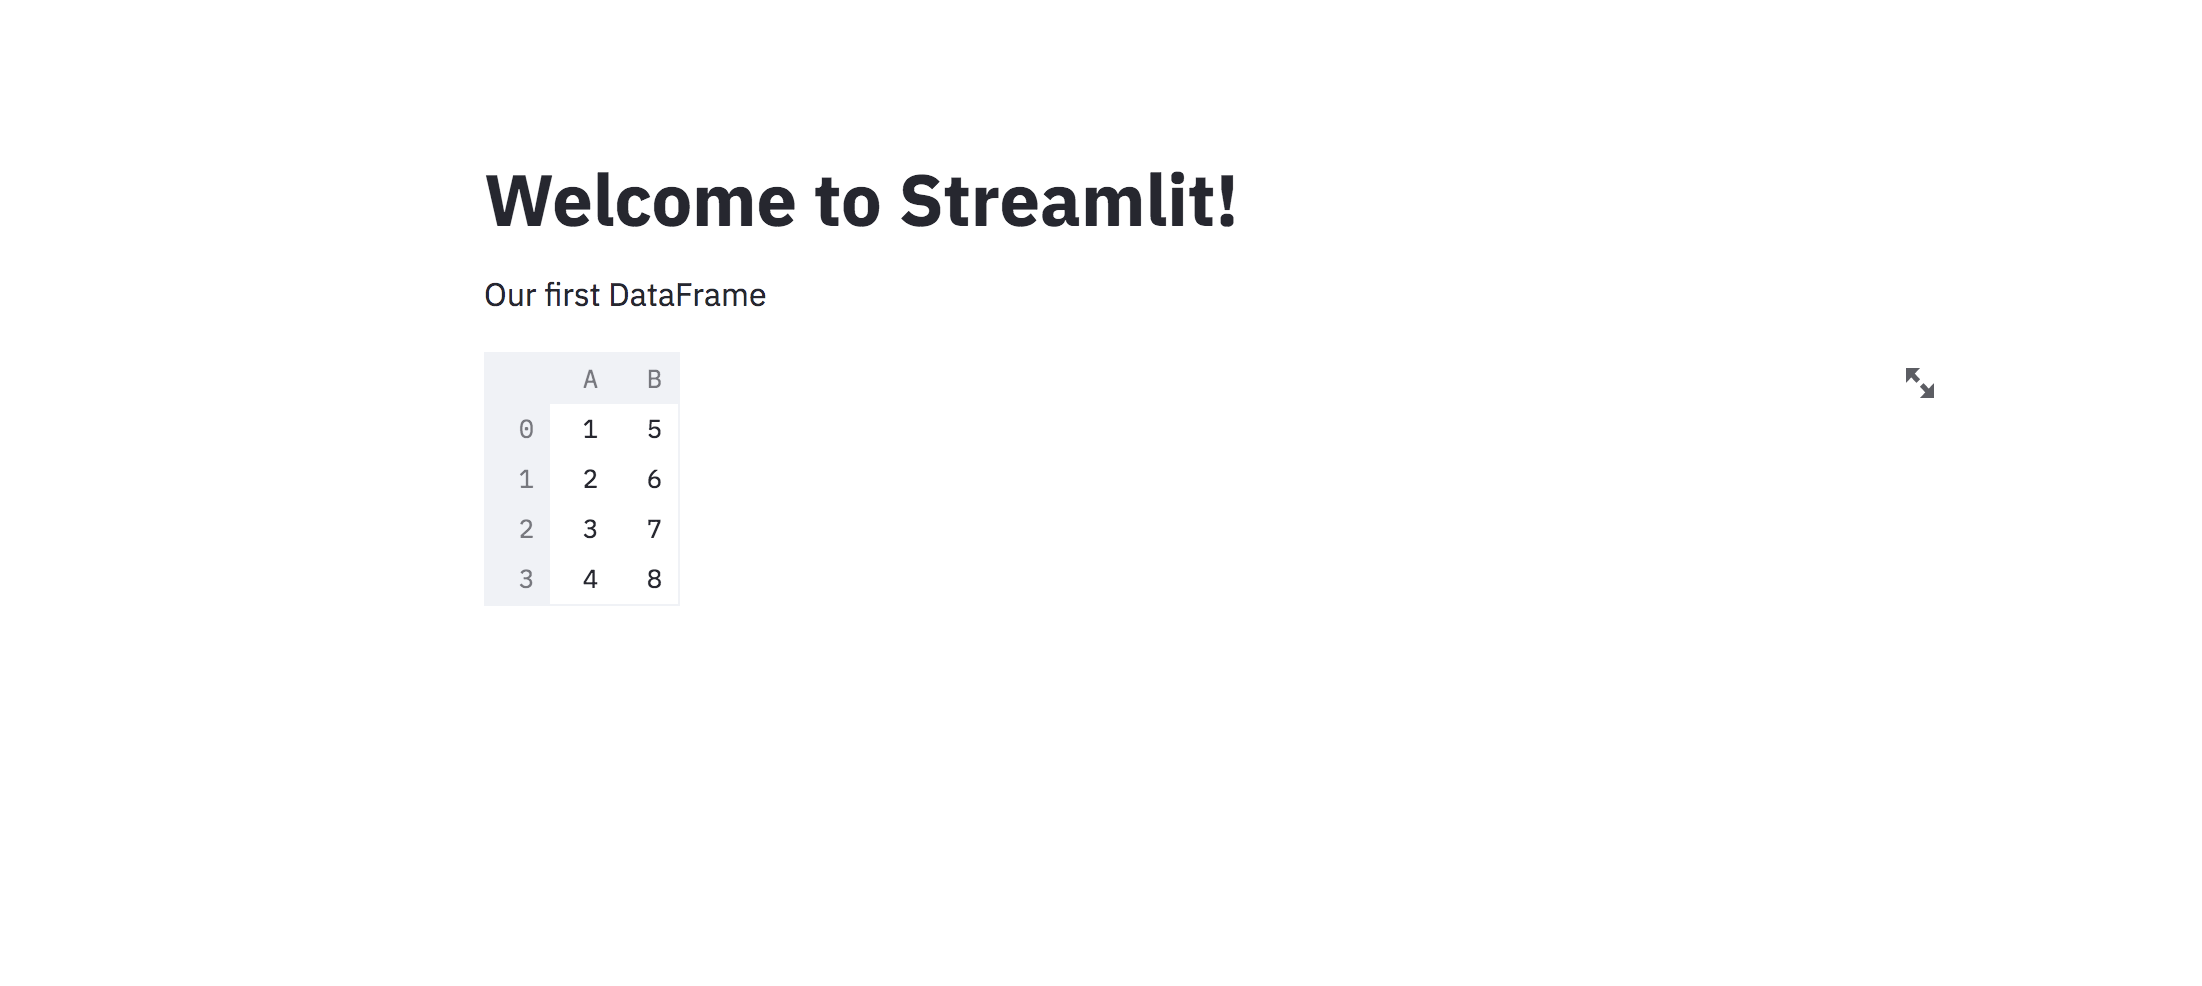
In the above code, st.title method writes the given string as header, st.write method writes the given string as such, and it also writes the DataFrame as well in the app.
Seems impressive right! Let’s move on with some more examples.
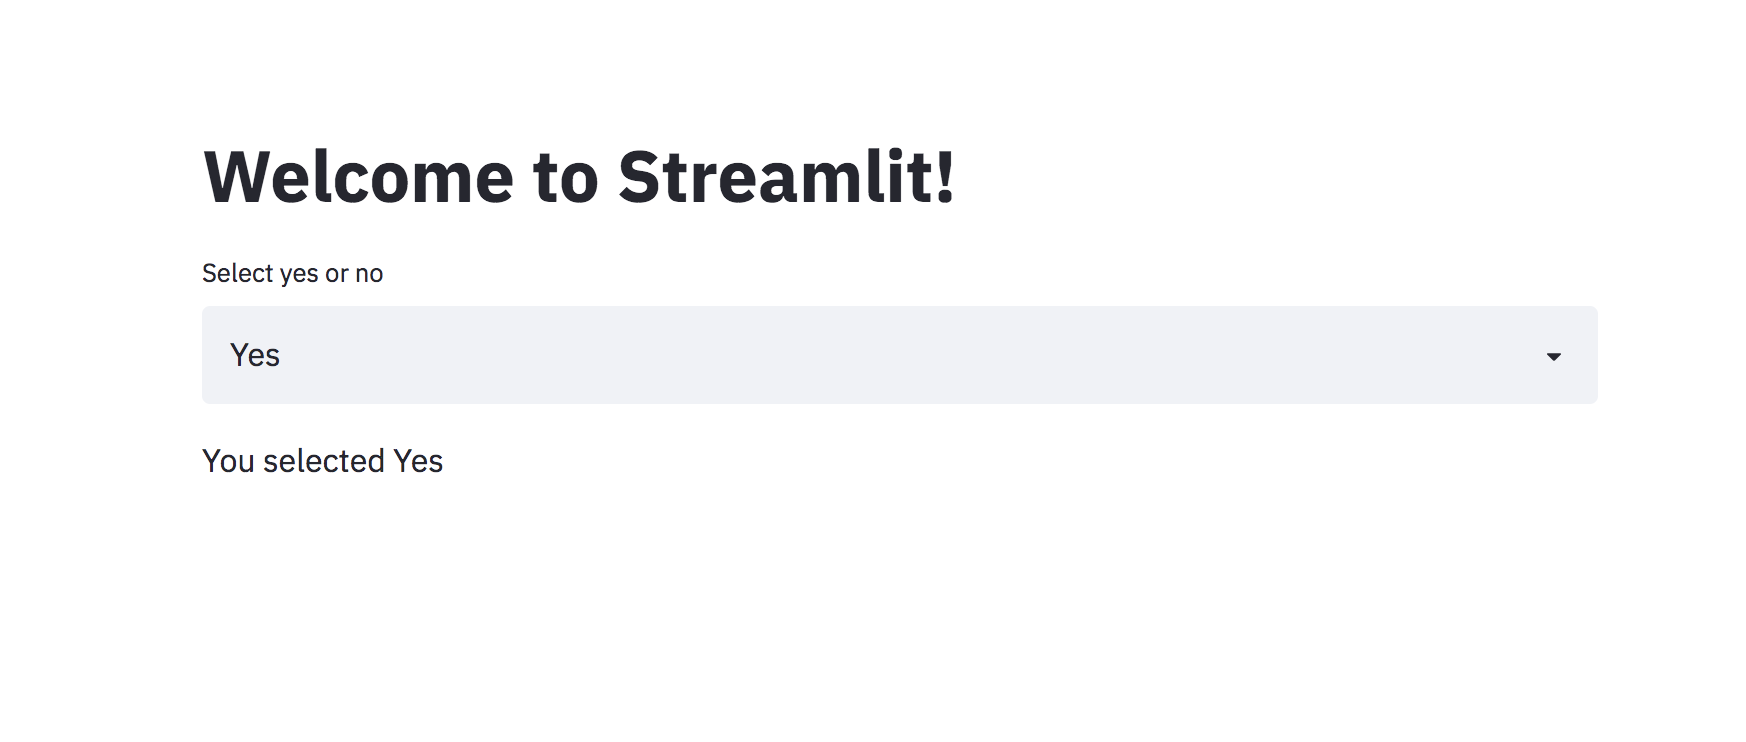
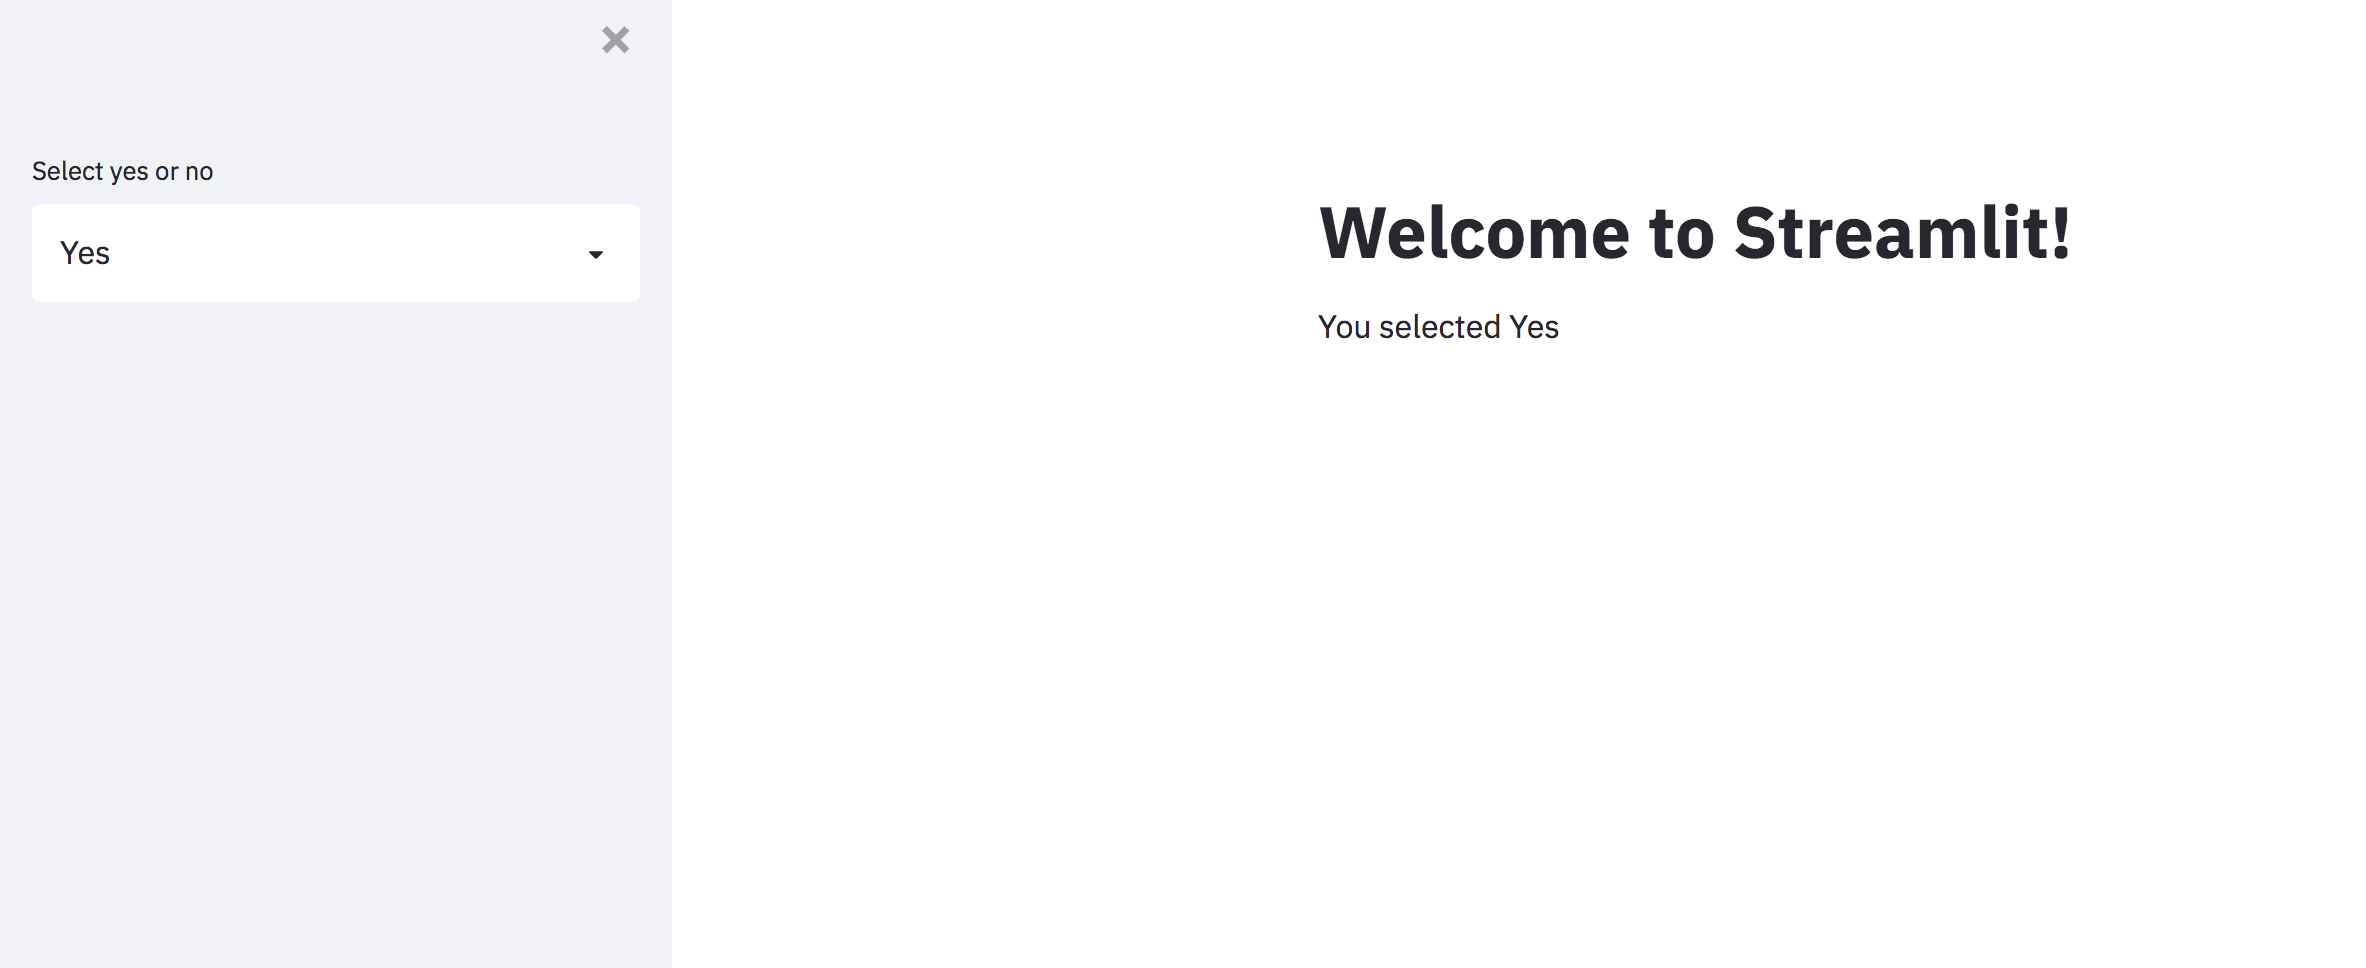
Select box in streamlit
import streamlit as st

st.title("Welcome to Streamlit!")

selectbox = st.selectbox(
    "Select yes or no",
    ["Yes", "No"]
)
st.write(f"You selected {selectbox}")
The first argument to st.selectbox is the string to display and the second argument is a list of options to select. And then we display the selected value in the app using st.write method.
Run the following command to see the results,
streamlit run selectbox.py
Now access the following URL http://localhost:8501/
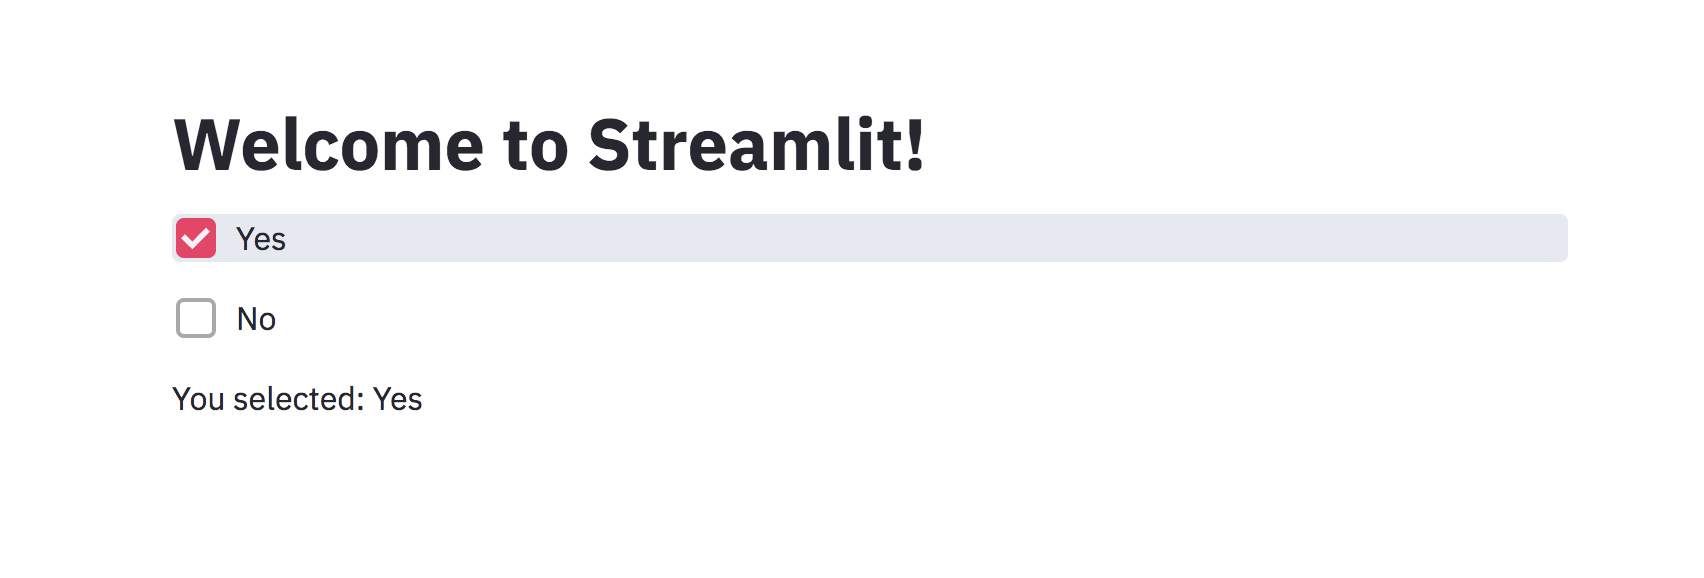
Checkbox in streamlit
import streamlit as st

st.title("Welcome to Streamlit!")

checkbox_one = st.checkbox("Yes")
checkbox_two = st.checkbox("No")

if checkbox_one:
    value = "Yes"
elif checkbox_two:
    value = "No"
else:
    value = "No value selected"

st.write(f"You selected: {value}")
The variable checkbox_one and checkbox_two contain a boolean value. If we have selected the checkbox “Yes” then checkbox_one will be having a True value else a False value.
Execute the following command,
streamlit run checkbox.py
Now access the following URL and see the results, http://localhost:8501/
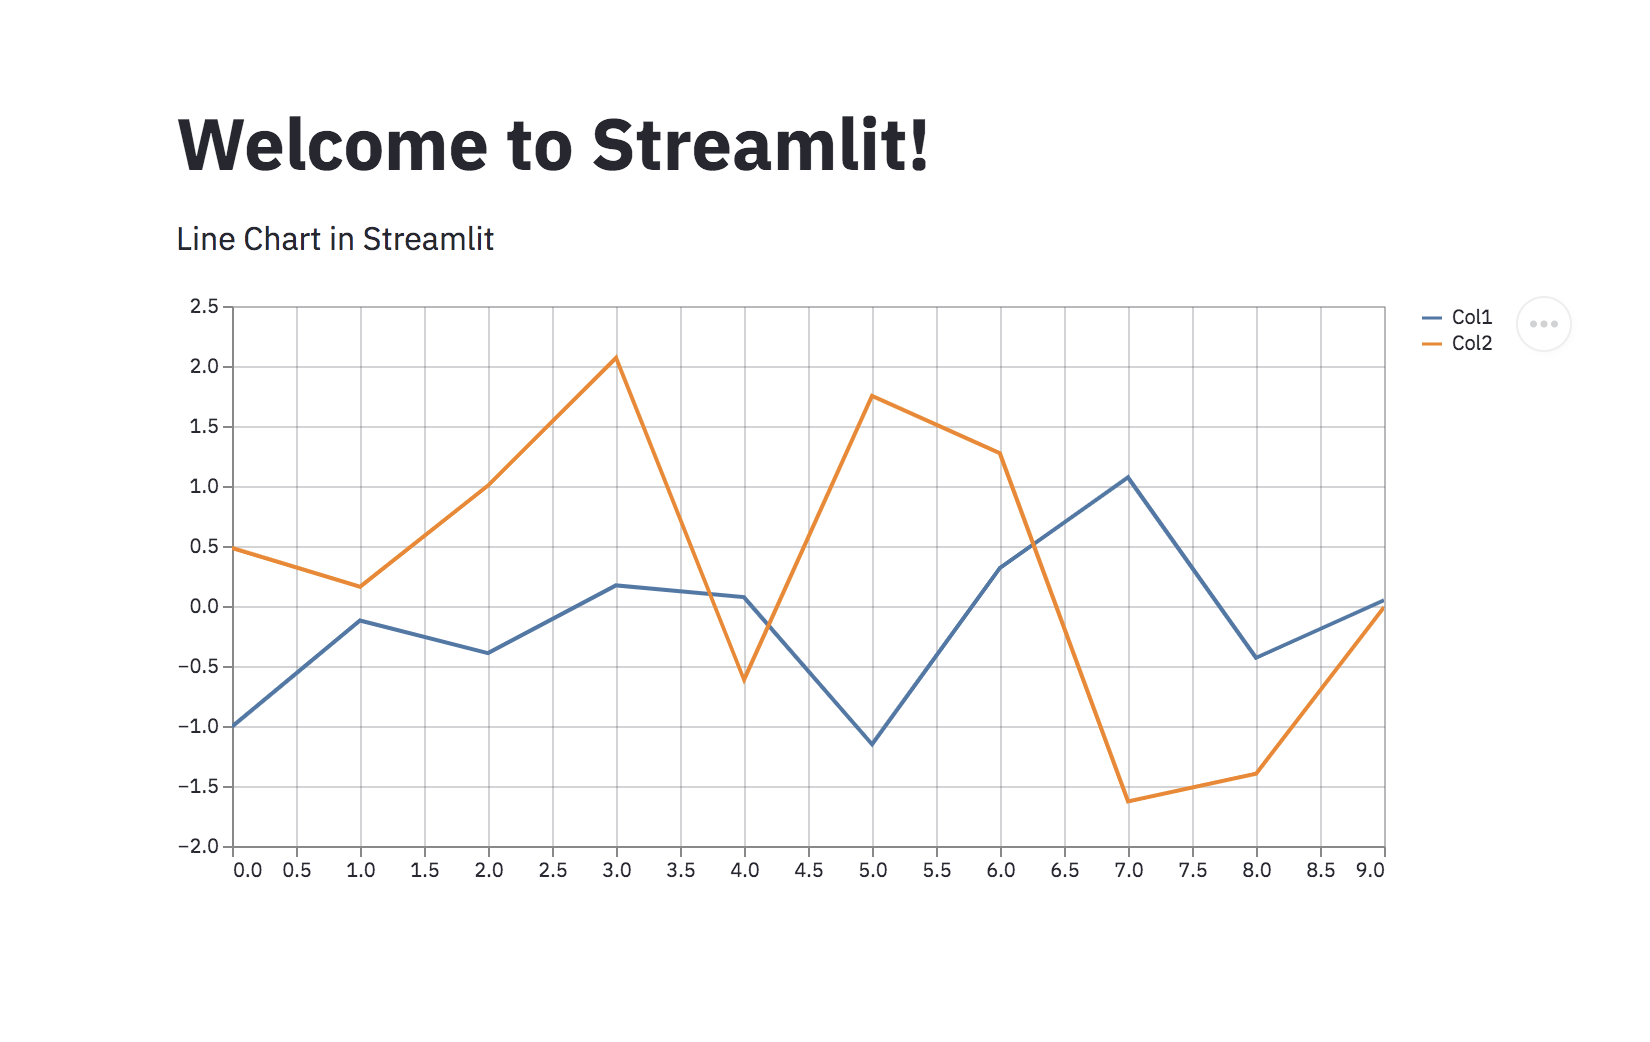
Line chart in streamlit
import pandas as pd
import streamlit as st

st.title("Welcome to Streamlit!")

st.write("Line Chart in Streamlit")
# 10 * 2 dimensional data
chart_data = pd.DataFrame(
    np.random.randn(10, 2),
    columns=[f"Col{i+1}" for i in range(2)]
)

st.line_chart(chart_data)
The DataFrame contains two-dimensional data with ten rows and two columns, by using st.line_chart we can plot those data in the app.
Execute the following command,
streamlit run linechart.py
Now access the following URL and see the results, http://localhost:8501/
Plotly charts in streamlit
import streamlit as st
import plotly.graph_objects as go


st.title("Welcome to Streamlit!")

fig = go.Figure(
    data=[go.Pie(
        labels=['A', 'B', 'C'],
        values=[30, 20, 50]
    )]
)
fig = fig.update_traces(
    hoverinfo='label+percent',
    textinfo='value',
    textfont_size=15
)

st.write("Pie chart in Streamlit")
st.plotly_chart(fig)
The st.plotly_chart method displays the provided figure object of plotly.
Execute the following command,
streamlit run plotly_chart.py
Now access the following URL and see the results, http://localhost:8501/
Sidebar in streamlit
import streamlit as st

st.title("Welcome to Streamlit!")

selectbox = st.sidebar.selectbox(
    "Select yes or no",
    ["Yes", "No"]
)
st.write(f"You selected {selectbox}")
The st.sidebar.selectbox method makes the select box to appear in the side box.
Execute the following command,
streamlit run sidebar.py
Now access the following URL and see the results, http://localhost:8501/
Develop a web app for Machine Learning using Streamlit
Let’s take a multi-class classification problem in machine learning and build a web app for it. The data used here is iris dataset.
The iris dataset description
- Number of Rows: 150
- Number of Columns: 4
- Column Information
- sepal length in cm
- sepal width in cm
- petal length in cm
- petal width in cm
- Target classes
- Iris-Setosa
- Iris-Versicolour
- Iris-Virginica
import numpy as np
import pandas as pd
import streamlit as st
import plotly.graph_objects as go
from sklearn.datasets import load_iris
from sklearn.ensemble import RandomForestClassifier
from sklearn.model_selection import train_test_split


iris_data = load_iris()
# separate the data into features and target
features = pd.DataFrame(
    iris_data.data, columns=iris_data.feature_names
)
target = pd.Series(iris_data.target)

# split the data into train and test
x_train, x_test, y_train, y_test = train_test_split(
    features, target, test_size=0.2, stratify=target
)


class StreamlitApp:

    def __init__(self):
        self.model = RandomForestClassifier()

    def train_data(self):
        self.model.fit(x_train, y_train)
        return self.model

    def construct_sidebar(self):

        cols = [col for col in features.columns]

        st.sidebar.markdown(
            '<p class="header-style">Iris Data Classification</p>',
            unsafe_allow_html=True
        )
        sepal_length = st.sidebar.selectbox(
            f"Select {cols[0]}",
            sorted(features[cols[0]].unique())
        )

        sepal_width = st.sidebar.selectbox(
            f"Select {cols[1]}",
            sorted(features[cols[1]].unique())
        )

        petal_length = st.sidebar.selectbox(
            f"Select {cols[2]}",
            sorted(features[cols[2]].unique())
        )

        petal_width = st.sidebar.selectbox(
            f"Select {cols[3]}",
            sorted(features[cols[3]].unique())
        )
        values = [sepal_length, sepal_width, petal_length, petal_width]

        return values

    def plot_pie_chart(self, probabilities):
        fig = go.Figure(
            data=[go.Pie(
                    labels=list(iris_data.target_names),
                    values=probabilities[0]
            )]
        )
        fig = fig.update_traces(
            hoverinfo='label+percent',
            textinfo='value',
            textfont_size=15
        )
        return fig

    def construct_app(self):

        self.train_data()
        values = self.construct_sidebar()

        values_to_predict = np.array(values).reshape(1, -1)

        prediction = self.model.predict(values_to_predict)
        prediction_str = iris_data.target_names[prediction[0]]
        probabilities = self.model.predict_proba(values_to_predict)

        st.markdown(
            """
            <style>
            .header-style {
                font-size:25px;
                font-family:sans-serif;
            }
            </style>
            """,
            unsafe_allow_html=True
        )

        st.markdown(
            """
            <style>
            .font-style {
                font-size:20px;
                font-family:sans-serif;
            }
            </style>
            """,
            unsafe_allow_html=True
        )
        st.markdown(
            '<p class="header-style"> Iris Data Predictions </p>',
            unsafe_allow_html=True
        )

        column_1, column_2 = st.beta_columns(2)
        column_1.markdown(
            f'<p class="font-style" >Prediction </p>',
            unsafe_allow_html=True
        )
        column_1.write(f"{prediction_str}")

        column_2.markdown(
            '<p class="font-style" >Probability </p>',
            unsafe_allow_html=True
        )
        column_2.write(f"{probabilities[0][prediction[0]]}")

        fig = self.plot_pie_chart(probabilities)
        st.markdown(
            '<p class="font-style" >Probability Distribution</p>',
            unsafe_allow_html=True
        )
        st.plotly_chart(fig, use_container_width=True)

        return self


sa = StreamlitApp()
sa.construct_app()
What happens in the above code?
First, an instance of the class StreamlitApp is created and contruct_app method of the class is invoked. The construct_app method does the following steps,
- Trains the iris data with Random Forest Classifier.
- Constructs the sidebar which consists of four select boxes or drop-down lists for fetching the following inputs, sepal length, sepal width, petal length, and petal width.
- After this process, it fetches the selected values of the drop-down list and predicts using the model trained before.
- After that, I have created two beta columns in the app which display the prediction and its probability side by side. The st.beta_column is the layout method that you could use to align the data in columns.
- I have plotted the probability distribution of the predictions using st.plotly_chart method in the streamlit app. Here I have used plotly to plot a pie chart using the data.
- When a user interacts with a widget the entire code is executed again from the top to the bottom.
Run the following command,
streamlit run streamlit_web_app.py
Now access the following URL, http://localhost:8501/
In this way, you can develop web apps for Machine Learning using Streamlit.
References
[1] Streamlit documentation
Connect with me on LinkedIn
Thank you!
The media shown in this article are not owned by Analytics Vidhya and are used at the Author’s discretion.
Machine Learning Engineer @ Zoho Corporation


