Data Cleansing: How To Clean Data With Python!
This article was published as a part of the Data Science Blogathon
Introduction
Data Cleansing is the process of analyzing data for finding incorrect, corrupt, and missing values and abluting it to make it suitable for input to data analytics and various machine learning algorithms.
It is the premier and fundamental step performed before any analysis could be done on data. There are no set rules to be followed for data cleansing. It totally depends upon the quality of the dataset and the level of accuracy to be achieved.
Reasons for data corruption:
- Data is collected from various structured and unstructured sources and then combined, leading to duplicated and mislabeled values.
- Different data dictionary definitions for data stored at various locations.
- Manual entry error/Typos.
- Incorrect capitalization.
- Mislabelled categories/classes.
Data Quality
Data Quality is of utmost importance for the analysis. There are several quality criteria that need to be checked upon:
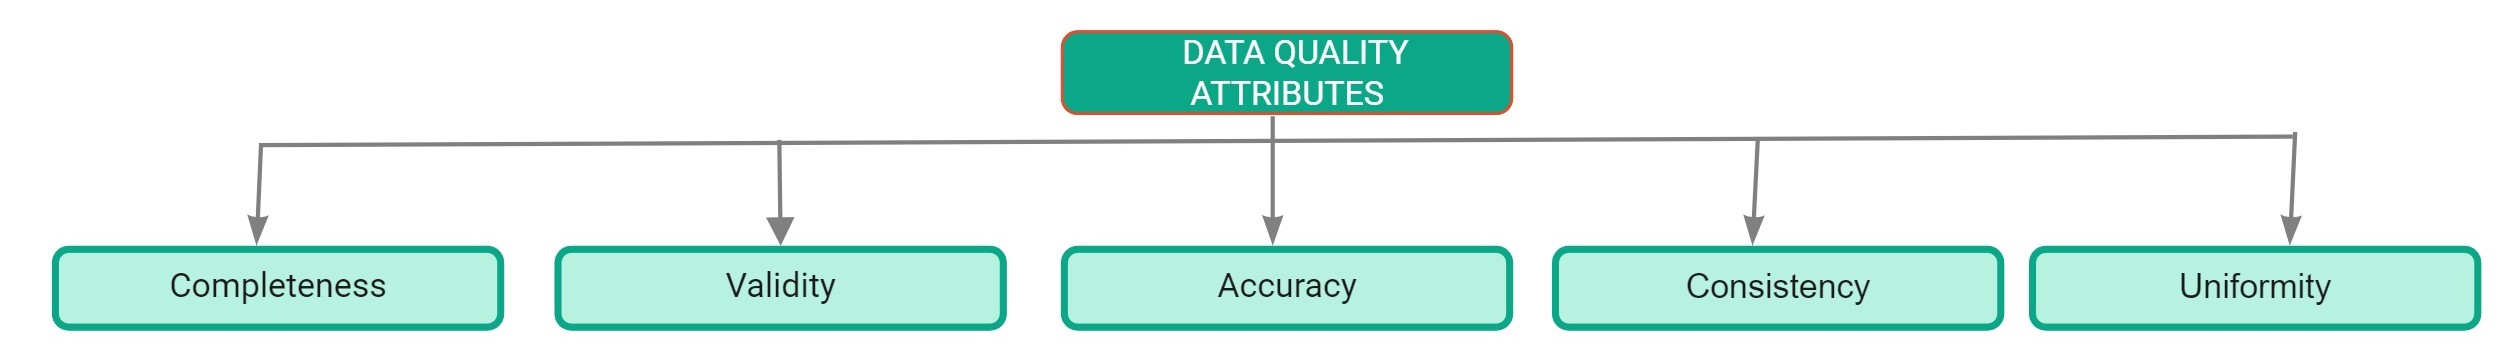
Data Quality Attributes
- Completeness: It is defined as the percentage of entries that are filled in the dataset. The percentage of missing values in the dataset is a good indicator of the quality of the dataset.
- Accuracy: It is defined as the extent to which the entries in the dataset are close to their actual values.
- Uniformity: It is defined as the extent to which data is specified using the same unit of measure.
- Consistency: It is defined as the extent to which the data is consistent within the same dataset and across multiple datasets.
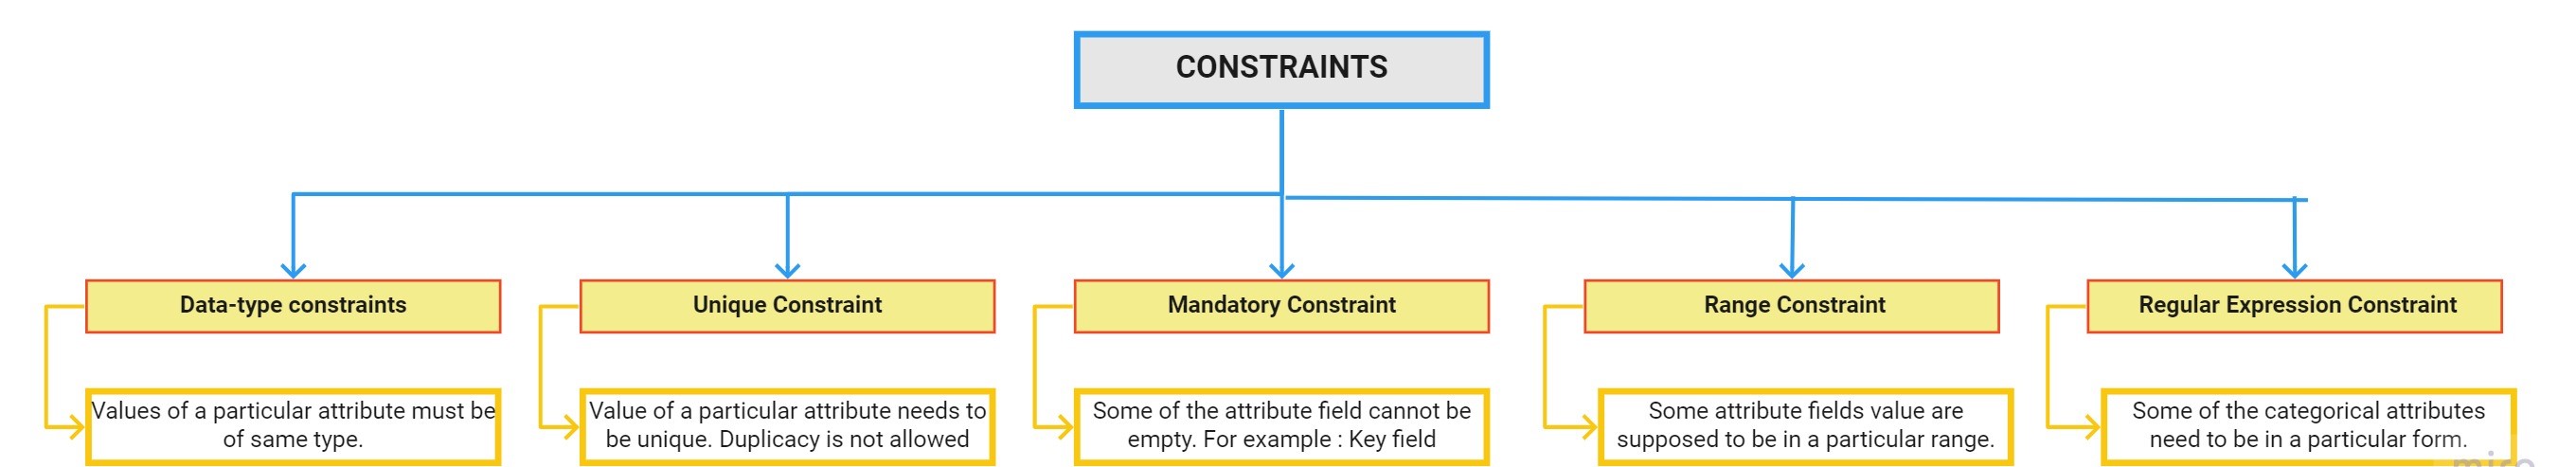
- Validity: It is defined as the extent to which data conforms to the constraints applied by the business rules. There are various constraints:
Data Profiling Report
Data Profiling is the process of exploring our data and finding insights from it. Pandas profiling report is the quickest way to extract complete information about the dataset. The first step for data cleansing is to perform exploratory data analysis.
How to use pandas profiling:
Step 1: The first step is to install the pandas profiling package using the pip command:
pip install pandas-profiling
Step 2: Load the dataset using pandas:
import pandas as pddf = pd.read_csv(r"C:UsersDellDesktopDatasethousing.csv")
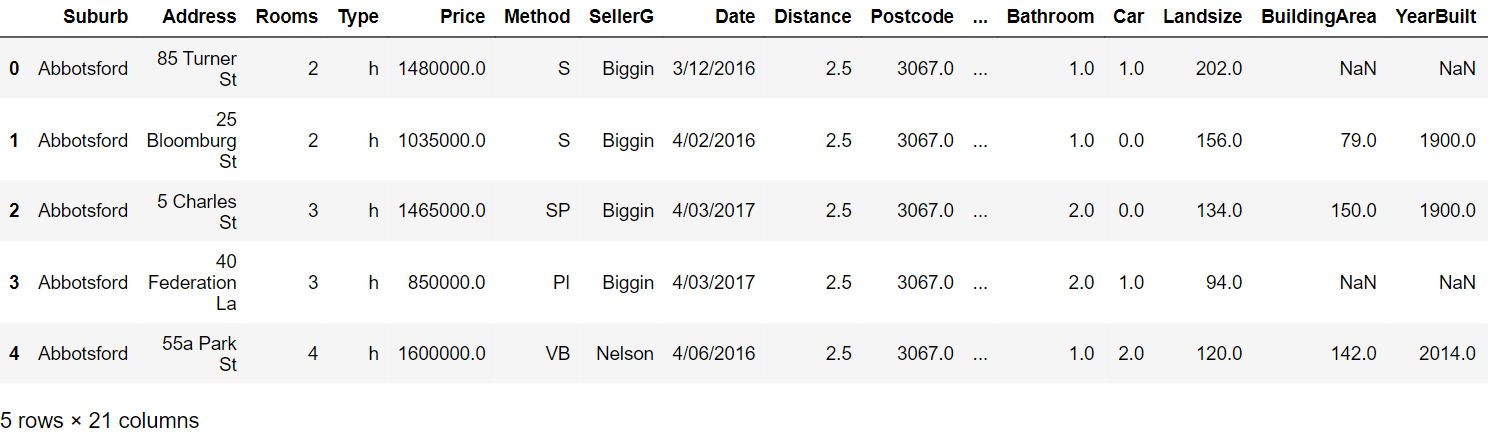
Step 3: Read the first five rows:
df.head()
Step 4: Generate the profiling report using the following commands:
from pandas_profiling import ProfileReportprof = ProfileReport(df)prof.to_file(output_file='output.html')
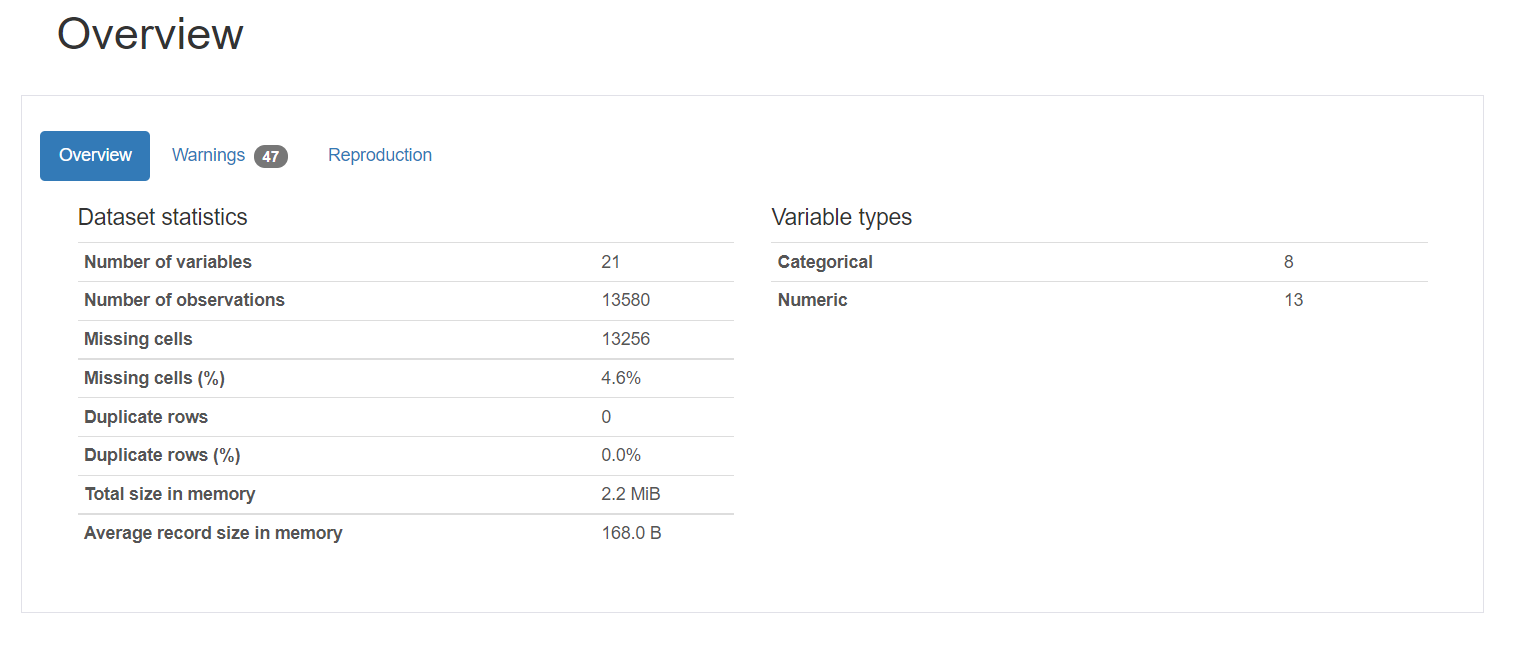
Profiling Report:
The profiling report consists of five parts: overview, variables, interactions, correlation, and missing values.
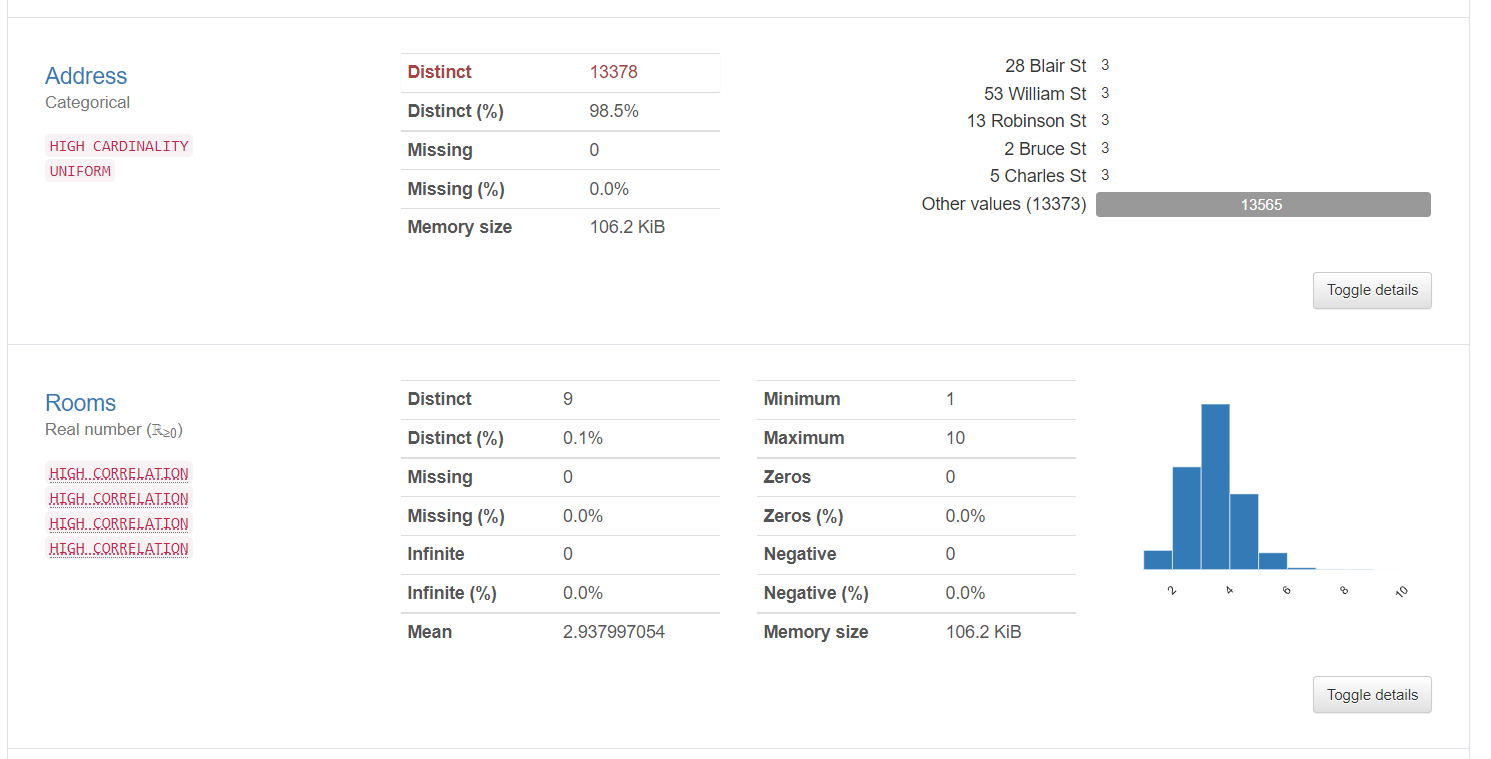
1. Overview gives the general statistics about the number of variables, number of observations, missing values, duplicates, and number of categorical and numeric variables.
2. Variable information tells detailed information about the distinct values, missing values, mean, median, etc. Here statistics about a categorical variable and a numerical variable is shown:
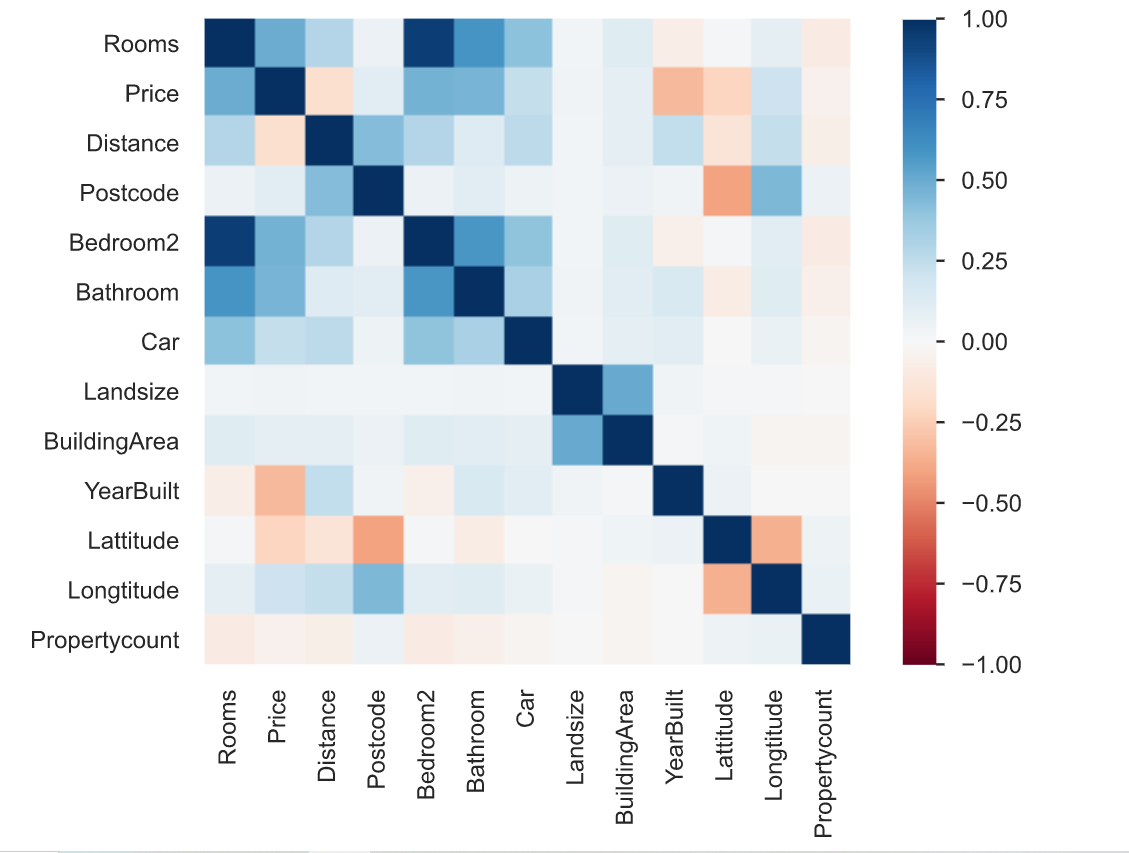
3. Correlation is defined as the degree to which two variables are related to each other. The profiling report describes the correlation of different variables with each other in form of a heatmap.
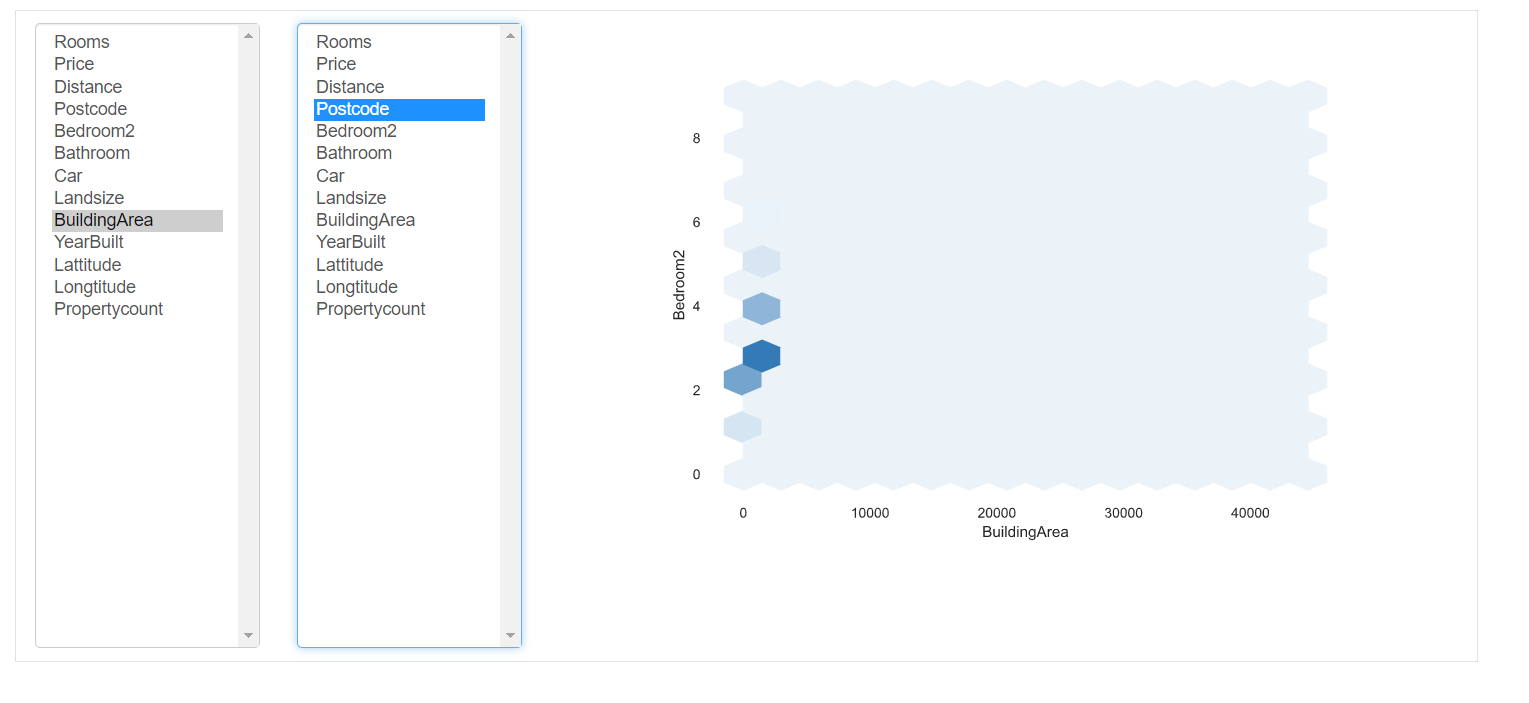
4.Interactions: This part of the report shows the interactions of the variables with each other. You can select any variable on the respective axes.
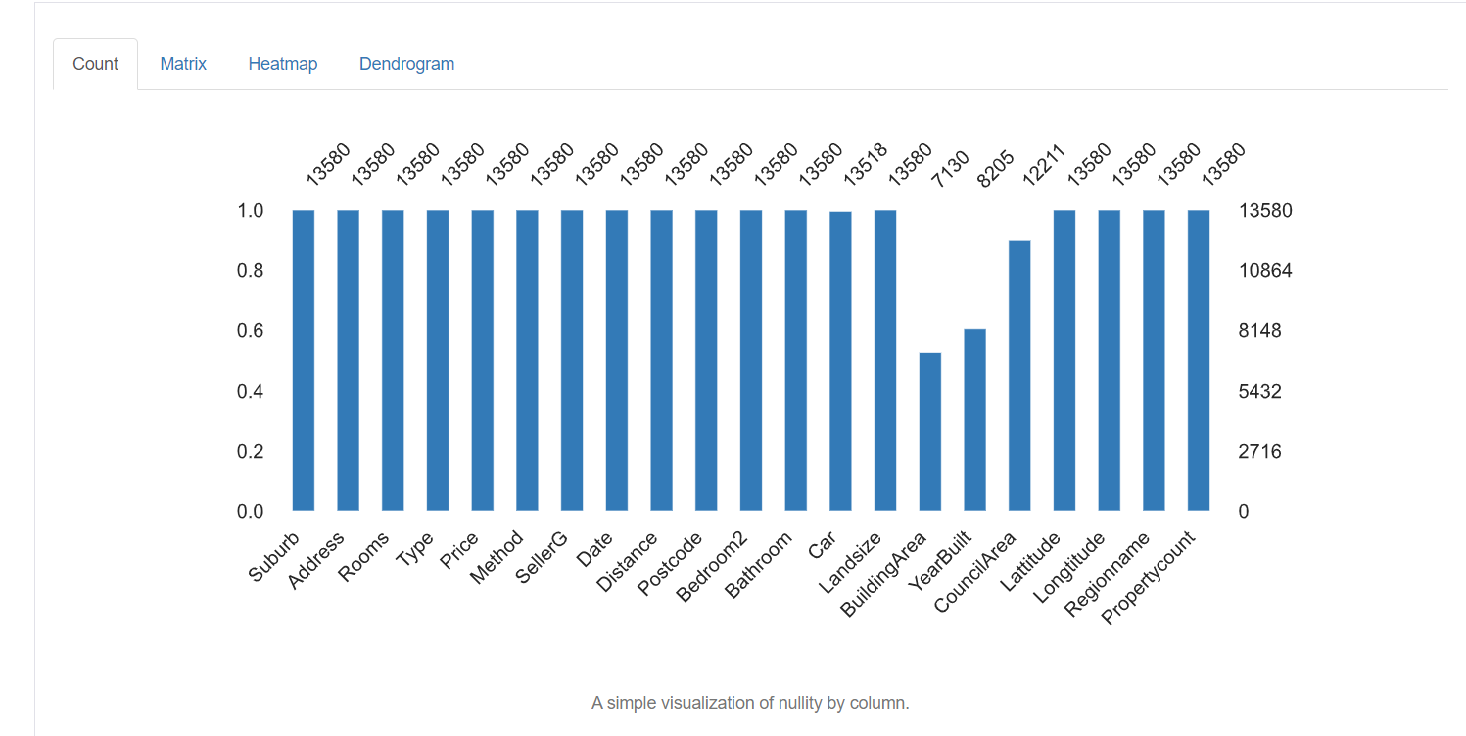
5. Missing values: It depicts the number of missing values in each column.
Data Cleansing Techniques
Now we have a piece of detailed knowledge about the missing data, incorrect values, and mislabeled categories of the dataset. We will now see some of the techniques used for cleaning data. It totally depends upon the quality of the dataset, results to be obtained on how you deal with your data. Some of the techniques are as follows:
Handling missing values:
Handling missing values is the most important step of data cleansing. The first question you should ask yourself is that why is the data missing? Is it missing just because it was not recorded by the data entry operator or is it intentionally left empty? You can also go through the documentation to find the reason for the same.
There are different ways to handle these missing values:
1. Drop missing values: The easiest way to handle them is to simply drop all the rows that contain missing values. If you don’t want to figure out why the values are missing and just have a small percentage of missing values you can just drop them using the following command:
df.dropna()It is not advisable although because every data is important and holds great significance to the overall results. Usually, the percentage of missing entries in a particular column is high. So dropping it is not a good option.
2. Imputation: Imputation is the process of replacing the null/missing values with some value. For numeric columns, one option is to replace each missing entry in the column with the mean value or median value. Another option could be generating random numbers between a range of values suitable for the column. The range could be between the mean and standard deviation of the column. You can simply import an imputer from the scikit-learn package and perform imputation as follows:
from sklearn.impute import SimpleImputer
#Imputation
my_imputer = SimpleImputer()
imputed_df = pd.DataFrame(my_imputer.fit_transform(df))
Handling Duplicates:
Duplicate rows occur usually when the data is combined from multiple sources. It gets replicated sometimes. A common problem is when users have the same identity number or the form has been submitted twice.
The solution to these duplicate tuples is to simply remove them. You can use the unique() function to find out the unique values present in the column and then decide which values need to be scraped.
Encoding:
Character encoding is defined as the set of rules defined for the one-to-one mapping from raw binary byte strings to human-readable text strings. There are several encoding available – ASCII, utf-8, US-ASCII, utf-16, utf-32, etc.
You might observe that some of the text character fields have irregular and unrecognizable patterns. This is because utf-8 is the default python encoding. All code is in utf-8. Therefore when the data is clubbed from multiple structured and unstructured sources and saved at a commonplace, irregular pattern in the text are observed.
The solution to the above problem is to first find out the character encoding of the file with the help of chardet module in python as follows:
import chardetwith open("C:/Users/Desktop/Dataset/housing.csv",'rb') as rawdata:result = chardet.detect(rawdata.read(10000))# check what the character encoding might beprint(result)
After finding the type of encoding, if it is different from utf-8, save the file using “utf-8” encoding using the following command.
df.to_csv("C:/Users/Desktop/Dataset/housing.csv")
Scaling and Normalization
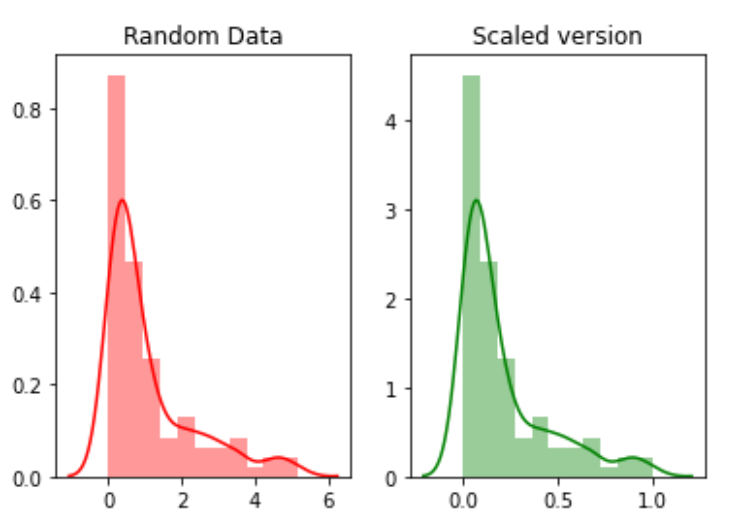
Scaling refers to transforming the range of data and shifting it to some other value range. This is beneficial when we want to compare different attributes on the same footing. One useful example could be currency conversion.
For example, we will create random 100 points from exponential distribution and then plot them. Finally, we will convert them to a scaled version using the python mlxtend package.
# for min_max scalingfrom mlxtend.preprocessing import minmax_scaling# plotting packagesimport seaborn as snsimport matplotlib.pyplot as plt
Now scaling the values:
random_data = np.random.exponential(size=100)# mix-max scale the data between 0 and 1scaled_version = minmax_scaling(random_data, columns=[0])
Finally, plotting the two versions.
Normalization refers to changing the distribution of the data so that it can represent a bell curve where the values of the attribute are equally distributed across the mean. The value of mean and median is the same. This type of distribution is also termed Gaussian distribution. It is necessary for those machine learning algorithms which assume the data is normally distributed.
Now, we will normalize data using boxcox function:
from scipy import statsnormalized_data = stats.boxcox(random_data)# plot both together to comparefig,ax=plt.subplots(1,2)sns.distplot(random_data, ax=ax[0],color='pink')ax[0].set_title("Random Data")sns.distplot(normalized_data[0], ax=ax[1],color='purple')ax[1].set_title("Normalized data")
Handling Dates
The date field is an important attribute that needs to be handled during the cleansing of data. There are multiple different formats in which data can be entered into the dataset. Therefore, standardizing the date column is a critical task. Some people may have treated the date as a string column, some as a DateTime column. When the dataset gets combined from different sources then this might create a problem for analysis.
The solution is to first find the type of date column using the following command.
df['Date'].dtype
If the type of the column is other than DateTime, convert it to DateTime using the following command:
import datetimedf['Date_parsed'] = pd.to_datetime(df['Date'], format="%m/%d/%y")
Handling inconsistent data entry issues
There are a large number of inconsistent entries that cannot be found manually or through direct computations. For example, if the same entry is written in upper case or lower case or a mixture of upper case and lower case. Then such an entry should be standardized throughout the column.
One solution is to convert all the entries of a column to lowercase and trim the extra space from each entry. This can later be reverted after the analysis is complete.
# convert to lower casedf['ReginonName'] = df['ReginonName'].str.lower()# remove trailing white spacesdf['ReginonName'] = df['ReginonName'].str.strip()
Another solution is to use fuzzy matching to find which strings in the column are closest to each other and then replacing all those entries with a particular threshold with the main entry.
Firstly we will find out the unique region names:
region = df['Regionname'].unique()
Then we calculate the scores using fuzzy matching:
import fuzzywuzzyfromfuzzywuzzy import processregions=fuzzywuzzy.process.extract("WesternVictoria",region,limit=10,scorer=fuzzywuzy.fuzz.token_sort_ratio)
Validating the process.
Once you have finished the data cleansing process, it is important to verify and validate that the changes you have made have not hampered the constraints imposed on the dataset.
And finally, … it doesn’t go without saying,
Thank you for reading!
The media shown in this article are not owned by Analytics Vidhya and are used at the Author’s discretion.
Computer science enthusiast


Hreat work! Very helpful 🙌🏻