Decoding the Chi-Square Test - Use along with Implementation and Visualization
This article was published as a part of the Data Science Blogathon
Introduction
In the last blog we looked at a test to find out correlation between the continuous variable in our data which you can read here. In this blog we will take a look at an important test that we can conduct to find out the correlation between the categorical variables in our data is Chi-Square Test, I will try to make the blog easy to understand focusing more on the implementation rather than the theory behind the test in this blog we will be looking at topics like:
- What is Chi-Square Test?
- How to implement the Chi-Square Test in Python?
- How to visualize the results of the test using a heat-map?

(Image Link)
What is Chi-Square Test?
Chi-Square test is a statistical test which is used to find out the difference between the observed and the expected data we can also use this test to find the correlation between categorical variables in our data. The purpose of this test is to determine if the difference between 2 categorical variables is due to chance, or if it is due to a relationship between them.

It is important to note that the variables to be compared should have only 2 categories i.e 1 and 0 the chi-square test fails to determine the correlation between variables with more than 2 categories.
While conducting the chi-square test we have to initially consider 2 hypothesis i.e the Null Hypothesis and the Alternate Hypothesis.
- H0 (Null Hypothesis) = The 2 variables to be compared are independent.
- H1 (Alternate Hypothesis) = The 2 variables are dependent.
Now, if the p-value obtained after conducting the test is less than 0.05 we reject the Null hypothesis and accept the Alternate hypothesis and if the p-value is greater that 0.05 we accept the Null hypothesis and reject the Alternate hypothesis. Now, let’s move onto the implementation. If you want to know more about the theory behind the Chi-square test you can check this out.
How to implement the Chi-Square Test in Python?
To implement the chi-square test in python the easiest way is using the chi2 function in the sklearn.feature_selection. The function takes in 2 parameters which are:
- x (array of size = (n_samples, n_features))
- y (array of size = (n_samples)) the y parameter is referred to as the target variable.
The function returns 2 arrays containing the chi2 statistics and p_values.
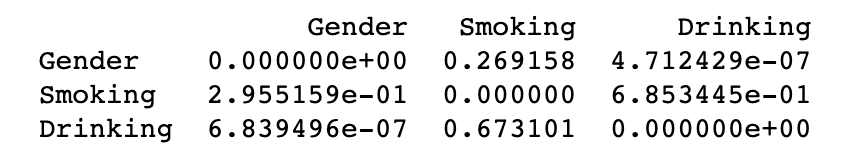
We will be using the p_values to determine the dependency of the variables. In the example below I have used a sample dataset which has 3 columns namely Gender, Smoking, Drinking the values of these columns have been initialised randomly. The dataset can be found on my Github repository here. Now our Null hypothesis will be that the variables being compared are independent and our alternate hypothesis will be that the variables are independent.from sklearn.feature_selection import chi2 import numpy as np import pandas as pd import matplotlib.pyplot as plt import seaborn as sns # Load Dataset df = pd.read_csv(‘SampleData.csv’) # Resultant Dataframe will be a dataframe where the column names and Index will be the same # This is a matrix similar to correlation matrix which we get after df.corr() # Initialize the values in this matrix with 0 resultant = pd.DataFrame(data=[(0 for i in range(len(df.columns))) for i in range(len(df.columns))], columns=list(df.columns)) resultant.set_index(pd.Index(list(df.columns)), inplace = True) # Finding p_value for all columns and putting them in the resultant matrix for i in list(df.columns): for j in list(df.columns): if i != j: chi2_val, p_val = chi2(np.array(df[i]).reshape(-1, 1), np.array(df[j]).reshape(-1, 1)) resultant.loc[i,j] = p_val print(resultant)
In the above code it can be observed that the p-values between the same columns are not calculated (Line 21), this is because we know that the correlation between same columns is going to be very high which will fetch us a value very close to 0. The code above will print a data frame that will look like the image below. Now that we have the results we will move onto visualizing the data frame.
How to visualize the results of the test using a heat-map?
Now that we have the data-frame will use the Heat map to plot the graph similar to the heat map used for visualising Pearson correlation. For this we will use the seaborn library. The code for visualization is as shown below-# Plotting a heatmap fig = plt.figure(figsize=(6,6)) sns.heatmap(resultant, annot=True, cmap=’Blues’) plt.title(‘Chi-Square Test Results’) plt.show()
The result produced by the above code will be as represented in the figure below now, using this heat map we can easily interpret the outcome of the test.
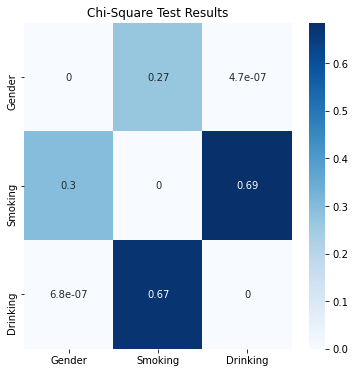
Observations :
- It can be seen that the diagonal has values equal to 0 as we had discussed above.
- It is also observed that Gender and Drinking columns have high correlation as their value is less than 0.05 and basically 0 or tending to zero in this case.
- On the other hand it can be seen that there is no conclusive evidence that Gender & Smoking as well as Smoking & Drinking are dependent on each other as their p-values are greater that 0.05
Conclusion:
In this blog, we have seen what is chi-square test? What is it used for? How to implement the test in python? And finally how to visualize the result? If you have any suggestions or questions feel free to comment them down. Also, connect with me on LinkedIn. Happy Learning! In future blogs I will try to cover other statistical tests like the T-test and the Anova test.
Connect with me on LinkedIn
Email: [email protected]
Check out my previous articles here.
The media shown in this article are not owned by Analytics Vidhya and are used at the Author’s discretion.
Frequently Asked Questions
You can use libraries in Python such as SciPy or Statsmodels to perform a Chi-Square Test. These libraries provide functions to calculate the test statistic and p-value, facilitating easy implementation.
The Chi-Square Test is appropriate for categorical data, where observations fall into different categories. It is commonly used to analyze relationships between categorical variables.
Yes, you can visualize Chi-Square Test results using various Python libraries such as Matplotlib or Seaborn. These libraries allow you to create visual representations like bar charts or heatmaps to enhance the interpretation of your findings.


I have a set of data with uncertainties involved x ,y. I fitted this x ,y as straight line by least square method so I have a equation like y=2x+1. How can I calculate the chi-square of this fitting Please help me.