Parametric and Non-Parametric Tests: The Complete Guide
Hypothesis testing is one of the most important concepts in Statistics which is heavily used by Statisticians, Machine Learning Engineers, and Data Scientists. In hypothesis testing, statistical tests are used to check whether the null hypothesis is rejected or not rejected. These Statistical tests assume a null hypothesis of no relationship or no difference between groups. So, In this article, we will be discussing the statistical test for hypothesis testing including both parametric and non-parametric tests.
This article was published as a part of the Data Science Blogathon.
Table of contents
What is a Parametric Test?
The basic principle behind the parametric tests is that we have a fixed set of parameters that are used to determine a probabilistic model that may be used in Machine Learning as well.
Parametric tests are those tests for which we have prior knowledge of the population distribution (i.e, normal), or if not then we can easily approximate it to a normal distribution which is possible with the help of the Central Limit Theorem.
Parameters for using the normal distribution is –
- Mean
- Standard Deviation
Why Do We Need a Parametric Test?
Eventually, the classification of a test to be parametric is completely dependent on the population assumptions. There are many parametric tests available from which some of them are as follows:
- To find the confidence interval for the population means with the help of known standard deviation.
- To determine the confidence interval for population means along with the unknown standard deviation.
- To find the confidence interval for the population variance.
- To find the confidence interval for the difference of two means, with an unknown value of standard deviation.
What is a Non-parametric Test?
In Non-Parametric tests, we don’t make any assumption about the parameters for the given population or the population we are studying. In fact, these tests don’t depend on the population.
Hence, there is no fixed set of parameters is available, and also there is no distribution (normal distribution, etc.) of any kind is available for use.
Why Do we Need Non-parametric Test?
This is also the reason that non-parametric tests are also referred to as distribution-free tests.
In modern days, Non-parametric tests are gaining popularity and an impact of influence some reasons behind this fame is –
- The main reason is that there is no need to be mannered while using parametric tests.
- The second reason is that we do not require to make assumptions about the population given (or taken) on which we are doing the analysis.
- Most of the nonparametric tests available are very easy to apply and to understand also i.e. the complexity is very low.
Differences Between Parametric and Non-parametric Test
| Parameter | Parametric Test | Nonparametric Test |
|---|---|---|
| Assumptions | Assume normal distribution and equal variance | No assumptions about distribution or variance |
| Data Types | Suitable for continuous data | Suitable for both continuous and categorical data |
| Test Statistics | Based on population parameters | Based on ranks or frequencies |
| Power | Generally more powerful when assumptions are met | More robust to violations of assumptions |
| Sample Size | Requires larger sample size, especially when distributions are non-normal | Requires smaller sample size |
| Interpretation of Results | Straightforward interpretation of results | Results are based on ranks or frequencies and may require additional interpretation |
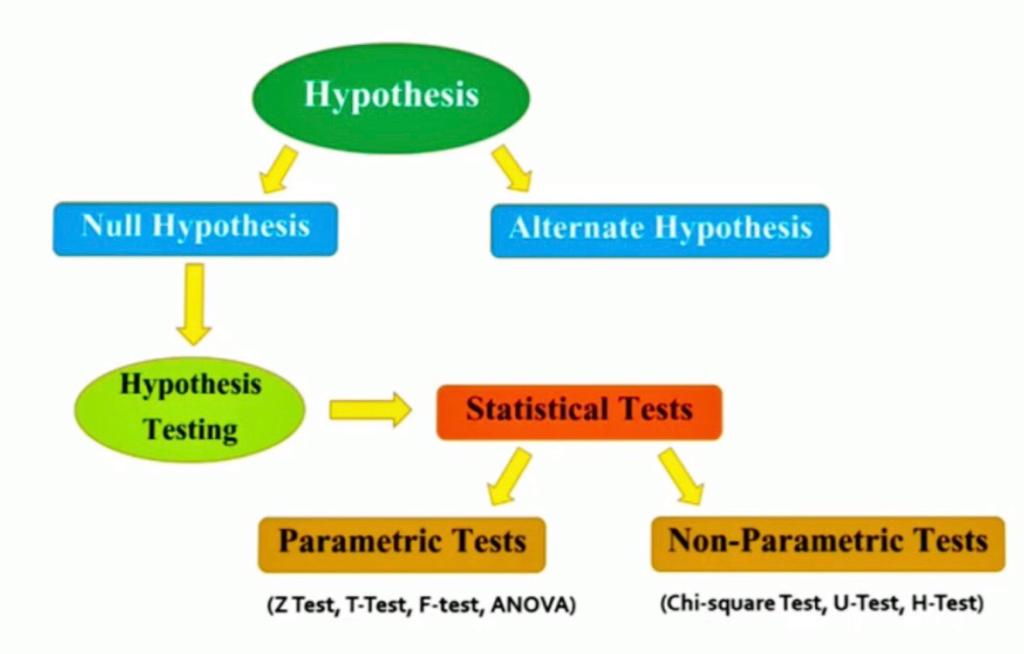
Image Source: Google Images
Types of Parametric Tests for Hypothesis Testing
T-Test
1. It is a parametric test of hypothesis testing based on Student’s T distribution.
2. It is essentially, testing the significance of the difference of the mean values when the sample size is small (i.e, less than 30) and when the population standard deviation is not available.
3. Assumptions of this test:
- Population distribution is normal, and
- Samples are random and independent
- The sample size is small.
- Population standard deviation is not known.
4. Mann-Whitney ‘U’ test is a non-parametric counterpart of the T-test.
A T-test can be a:
One Sample T-test: To compare a sample mean with that of the population mean.
where,
x̄ is the sample mean
s is the sample standard deviation
n is the sample size
μ is the population mean
Two-Sample T-test: To compare the means of two different samples.

where,
x̄1 is the sample mean of the first group
x̄2 is the sample mean of the second group
S1 is the sample-1 standard deviation
S2 is the sample-2 standard deviation
n is the sample size
Conclusion:
- If the value of the test statistic is greater than the table value -> Rejects the null hypothesis.
- If the value of the test statistic is less than the table value -> Do not reject the null hypothesis.
Z-Test
1. It is a parametric test of hypothesis testing.
2. It is used to determine whether the means are different when the population variance is known and the sample size is large (i.e, greater than 30).
3. Assumptions of this test:
- Population distribution is normal
- Samples are random and independent.
- The sample size is large.
- Population standard deviation is known.
A Z-test can be:
One Sample Z-test: To compare a sample mean with that of the population mean.
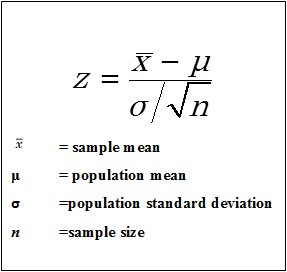
Image Source: Google Images
Two Sample Z-test: To compare the means of two different samples.

where,
x̄1 is the sample mean of 1st group
x̄2 is the sample mean of 2nd group
σ1 is the population-1 standard deviation
σ2 is the population-2 standard deviation
n is the sample size
F-Test
1. It is a parametric test of hypothesis testing based on Snedecor F-distribution.
2. It is a test for the null hypothesis that two normal populations have the same variance.
3. An F-test is regarded as a comparison of equality of sample variances.
4. F-statistic is simply a ratio of two variances.
5. It is calculated as:
F = s12/s22
6. By changing the variance in the ratio, F-test has become a very flexible test. It can then be used to:
- Test the overall significance for a regression model.
- To compare the fits of different models and
- To test the equality of means.
7. Assumptions of this test:
- Population distribution is normal, and
- Samples are drawn randomly and independently.
ANOVA
1. Also called as Analysis of variance, it is a parametric test of hypothesis testing.
2. It is an extension of the T-Test and Z-test.
3. It is used to test the significance of the differences in the mean values among more than two sample groups.
4. It uses F-test to statistically test the equality of means and the relative variance between them.
5. Assumptions of this test:
- Population distribution is normal, and
- Samples are random and independent.
- Homogeneity of sample variance.
6. One-way ANOVA and Two-way ANOVA are is types.
7. F-statistic = variance between the sample means/variance within the sample
Learn more about the difference between Z-test and T-test
Types of Non-parametric Tests
Chi-Square Test
1. It is a non-parametric test of hypothesis testing.
2. As a non-parametric test, chi-square can be used:
- test of goodness of fit.
- as a test of independence of two variables.
3. It helps in assessing the goodness of fit between a set of observed and those expected theoretically.
4. It makes a comparison between the expected frequencies and the observed frequencies.
5. Greater the difference, the greater is the value of chi-square.
6. If there is no difference between the expected and observed frequencies, then the value of chi-square is equal to zero.
7. It is also known as the “Goodness of fit test” which determines whether a particular distribution fits the observed data or not.
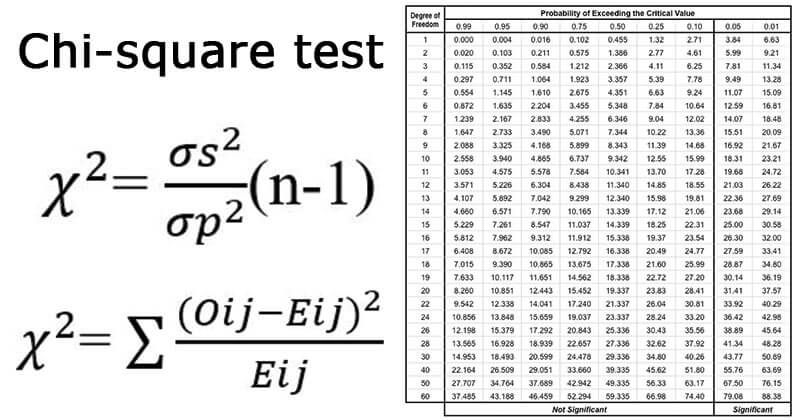
8. It is calculated as:
9. Chi-square is also used to test the independence of two variables.
10. Conditions for chi-square test:
- Randomly collect and record the Observations.
- In the sample, all the entities must be independent.
- No one of the groups should contain very few items, say less than 10.
- The reasonably large overall number of items. Normally, it should be at least 50, however small the number of groups may be.
11. Chi-square as a parametric test is used as a test for population variance based on sample variance.
12. If we take each one of a collection of sample variances, divide them by the known population variance and multiply these quotients by (n-1), where n means the number of items in the sample, we get the values of chi-square.
13. It is calculated as:
Mann-Whitney U-Test
1. It is a non-parametric test of hypothesis testing.
2. This test is used to investigate whether two independent samples were selected from a population having the same distribution.
3. It is a true non-parametric counterpart of the T-test and gives the most accurate estimates of significance especially when sample sizes are small and the population is not normally distributed.
4. It is based on the comparison of every observation in the first sample with every observation in the other sample.
5. The test statistic used here is “U”.
6. Maximum value of “U” is ‘n1*n2‘ and the minimum value is zero.
7. It is also known as:
- Mann-Whitney Wilcoxon Test.
- Mann-Whitney Wilcoxon Rank Test.
8. Mathematically, U is given by:
U1 = R1 – n1(n1+1)/2
where n1 is the sample size for sample 1, and R1 is the sum of ranks in Sample 1.
U2 = R2 – n2(n2+1)/2
When consulting the significance tables, the smaller values of U1 and U2 are used. The sum of two values is given by,
U1 + U2 = { R1 – n1(n1+1)/2 } + { R2 – n2(n2+1)/2 }
Knowing that R1+R2 = N(N+1)/2 and N=n1+n2, and doing some algebra, we find that the sum is:
U1 + U2 = n1*n2
Kruskal-Wallis H-test
1. It is a non-parametric test of hypothesis testing.
2. This test is used for comparing two or more independent samples of equal or different sample sizes.
3. It extends the Mann-Whitney-U-Test which is used to comparing only two groups.
4. One-Way ANOVA is the parametric equivalent of this test. And that’s why it is also known as ‘One-Way ANOVA on ranks.
5. It uses ranks instead of actual data.
6. It does not assume the population to be normally distributed.
7. The test statistic used here is “H”.
Also Read: The Evolution and Future of Data Science Innovation
Conclusion
Hope you know the difference between parametric and non-parametric tests now! If you want to master the techniques of statistical analysis and data science, then you should enroll in our BlackBetlt program. The course covers advanced statistical concepts and methods, including hypothesis testing, ANOVA, regression analysis, etc. With hands-on projects and real-world case studies, it provides a comprehensive and practical understanding of statistical analysis.
Frequently Asked Questions
A. Parametric tests assume that the data is distributed and the variances of the groups being compared are equal. Nonparametric tests do not make any assumptions about the distribution of the data or the equality of variances.
A. The 4 parametric tests are t-test, ANOVA (Analysis of Variance), pearson correlation coefficient
and linear regression.
A. The 4 non-parametric tests are wilcoxon signed-rank test, mann-Whitney U test, kruskal-Wallis test and spearman correlation coefficient.


Thanks for the wonderful lecture.
I liked your article Can you provide atleast one example of each parametric test and non parametric test to understand application of each statistical tools
Great article, Aashi Goyal! Thank you for providing a comprehensive overview of parametric and non-parametric tests in statistics. The importance of understanding these tests cannot be overstated, as they play a crucial role in hypothesis testing. Your article effectively explains the key differences between the two types of tests, highlighting the assumptions, data types, and test statistics involved. It's a valuable resource for statisticians, data scientists, and machine learning engineers. Keep up the excellent work!