Streamlit for ML Web Applications: Customer’s Propensity to Purchase
This article was published as a part of the Data Science Blogathon

Photo by __ drz __ on Unsplash
Analytics Dashboards and Web Applications are commonly used by Companies to communicate insights and deploy Machine Learning models. There is a wide pool of options when it comes to the tools needed for this. Tableau, PowerBI or even customized tools using web frameworks like Flask can be used to build these dashboards.
However, these types of dashboards are often time-consuming to build and also end up being on a higher side of costing for the stakeholders. A great alternative to this is an open-source Python-based library called Streamlit. Most Data Scientists have good Python Experience and this is all you need to know to develop web applications using Streamlit. It’s also very easy to learn the framework.
In this blog, I have demonstrated building a Streamlit Application that takes in specific user inputs and predicts the probability that a Customer with those features will make a purchase. I have tried to include some of the most desired front-end features that Businesses expect from a web application. This blog intends to communicate to the readers, the ease of Streamlit w.r.t. visualizations, user inputs, and integration of Machine Learning models. I have used a Kaggle and you can have a look at it here.
The Business Problem
While a website can have many visitors, only a small proportion may actually buy from the business. Currently, the business may be spending money to retarget these visitors using maybe advertisements on Social media platforms like Facebook. It is only logical for it to optimize this activity by targeting only the most valuable prospects who are more likely to make a purchase. Our task is exactly this – to build a Machine Learning model that predicts the propensity of purchase for a particular customer using historical data. Let’s get started!
Build and Save a Machine Learning Model
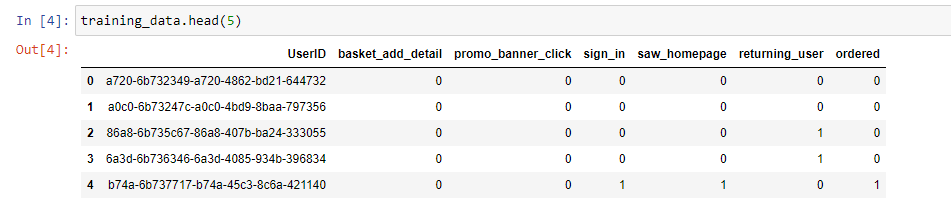
We will start by having a look at our training data. For the sake of simplicity, I have chosen a subset of features from the dataset. I have saved this subset for loading it later in our Streamlit Application.
import pandas as pd
training_data=pd.read_csv("training_sample.csv")
training_data=training_data[['UserID',"basket_add_detail",'promo_banner_click',"sign_in","saw_homepage","returning_user","ordered"]]
training_data.to_csv("training_sample_subset.csv")
Let us have a closer look at the columns in the dataset:
‘UserID’ – Unique Identifier for each customer
‘basket_add_detail’ – A binary variable indicating if the customer added an item to the basket from the product detail page
‘promo_banner_click’ – A binary variable indicating if the customer clicked on any promotional banners
‘sign_in’ – Another binary variable, indicating if the customer signed into our website.
‘returning_user’ – Again, a binary variable indicating if the customer is a returning visitor to our website.
‘saw_homepage’ – A binary variable indicating if the customer saw the homepage of the website
‘ordered’ – Our target variable. A binary variable indicating if the customer placed an order.
The problem at hand is a classification problem. Since this blog focuses on the Streamlit application, I have built a simple model using Logistic Regression in Python. Note that in practice you may need to do an EDA, choose an appropriate model (Logistic Regression, Random Forest Classifier, KNN Classifier, etc.), maybe use cross-validation, regularisation, account for an unbalanced dataset, etc. Anyways, let us have a look at our model, shall we?
#Seperating dependent and independent variables
X=training_data[["basket_add_detail",'promo_banner_click',"sign_in","saw_homepage","returning_user"]]
y=training_data[["ordered"]]
# split X and y into training and testing sets
from sklearn.model_selection import train_test_split
X_train,X_test,y_train,y_test=train_test_split(X,y,test_size=0.25,random_state=0)
from sklearn.linear_model import LogisticRegression
# instantiate the model (using the default parameters)
propensity_model = LogisticRegression()
# fit the model with data
propensity_model.fit(X_train,y_train)
#predict for test dataset
y_pred=propensity_model.predict(X_test)
#evaluate the model fit
from sklearn import metrics
metrics.accuracy_score(y_test, y_pred)
The Accuracy of the model comes out to be 0.9693. Let’s be happy about this as far as this Streamlit blog is concerned 😛
Now that we have our model ready, let us save this as a pickle file. We will use this later to make predictions in the Streamlit Application. The Python code to save a Machine Learning model as a pickle file is given below:
#save the pickle file to be loaded in the streamlit app
import pickle
with open("propensity_model.pkl", 'wb') as pfile:
    pickle.dump(propensity_model, pfile)
Simple Multi-Page Web Application using Streamlit
Building a Multipage Application is usually one of the most common requests that you would get from your project stakeholders. Here, we will see how to build a two-page application in Streamlit using radio buttons. To do this we will need to write 3 python (.py) scripts. Two of them will be the tasks that need to be performed on respective pages and one script to integrate these two scripts. In our case, page 1 will show details about the training data, and the code for this is written in “training.py”. Page 2 will have user input fields and predictions. The code for this is written in “predict.py”. These two files will be integrated using a third python script called “Streamlit_main_app.py”.
Let us have a look at how we actually integrate the two pages in the script “Streamlit_main_app.py”
import streamlit as st
import training
import predict
#Title of the Application
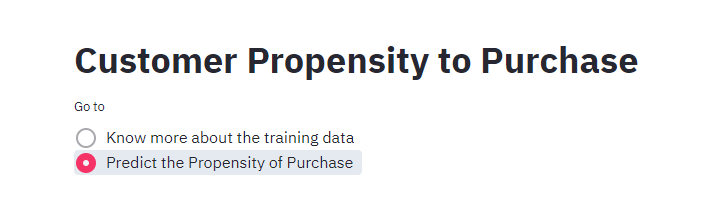
st.title("Customer Propensity to Purchase")
#Choice of page
page_choices={"Know more about the training data":training,
"Predict the Propensity of Purchase":predict}
#Create radio button for the page choice
page_selection = st.radio("Go to", list(page_choices.keys()))
#Choosing the page based on the user selection from radio button
page = page_choices[page_selection]
#Display the page
with st.spinner(f'Loading {page_selection} ...'):
page.app()
- Note that we have imported “training.py” and “predict.py”
- Here page.app() refers to the definition called “app()” written within both training.py and predict.py. We will come across this at a later stage in this blog.
Let us have a look at how this looks in the web application.
Read Data, Display a Table, Plot a Chart in Streamlit
Let us read the training data and display it. We will be exploring how to display tables and charts using Streamlit. This code will be written in “training.py”
import streamlit as st
import pandas as pd
#import altair as alt
import matplotlib.pyplot as plt
st.set_option('deprecation.showPyplotGlobalUse', False)
def app():
#Header
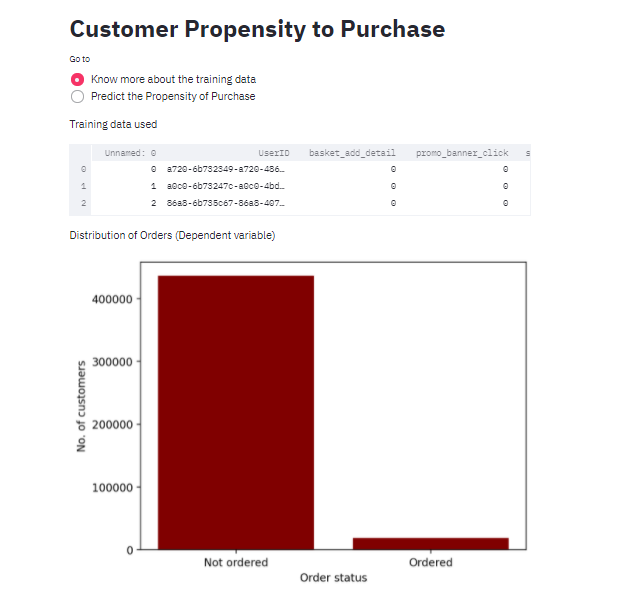
st.write("Training data used")
#Reading the data
training_sample_subset=pd.read_csv("training_sample_subset.csv")
#display the data as a table
st.write(training_sample_subset.head(30))
#header
st.write("Distribution of Orders (Dependent variable)")
#bar plot
temp=training_sample_subset["ordered"].value_counts()
fig, ax = plt.subplots()
ax.bar(["Not ordered","Ordered"],temp,color ='maroon',width = 0.4)
plt.xlabel("Order status")
plt.ylabel("No. of customers")
st.pyplot()
We have completed our first page of the web application. Let us see how it looks.
User Inputs in Streamlit
We will next move to the second page which takes in the user inputs and predicts if the Customer will make a purchase or not. It also shows the probability of purchase. These lines of code are written within “predict.py”.
import streamlit as st
import pandas as pd
import pickle
def app():
option_basket = st.sidebar.selectbox(
'Did the customer add any item to the basket?',
('Yes', 'No'))
option_promo = st.sidebar.selectbox(
'Did the customer click on any Promo banner?',
('Yes', 'No'))
option_sign_in = st.sidebar.selectbox(
'Did the customer sign in?',
('Yes', 'No'))
option_home = st.sidebar.selectbox(
'Did the customer see the home page?',
('Yes', 'No'))
option_repeat = st.sidebar.selectbox(
'Is he a repeating customer?',
('Yes', 'No'))
if st.sidebar.button('Predict Propensity of the Customer to make a purchase'):
lookup_dict={"Yes":1,"No":0}
dict = {'basket_add_detail':[lookup_dict[option_basket]],
'promo_banner_click':[lookup_dict[option_promo]],
'sign_in':[lookup_dict[option_sign_in]],
"saw_homepage":[lookup_dict[option_home]],
"returning_user":[lookup_dict[option_repeat]]
}
prediction_df = pd.DataFrame(dict)
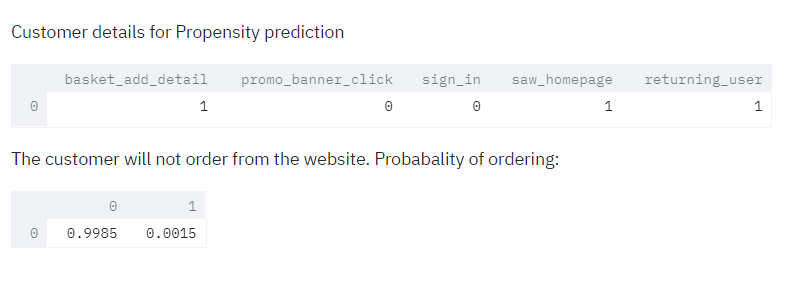
st.write("Customer details for Propensity prediction")
st.write(prediction_df)
with open("propensity_model.pkl", 'rb') as pfile:
propensity_model_loaded=pickle.load(pfile)
y_predicted=propensity_model_loaded.predict(prediction_df)
if (y_predicted[0]==1):
st.write("The customer will order from the website. Probabality of ordering:")
else:
st.write("The customer will not order from the website. Probabality of ordering:")
st.write(propensity_model_loaded.predict_proba(prediction_df))
We will look into each of these code pieces in detail and look at the corresponding application snapshots.
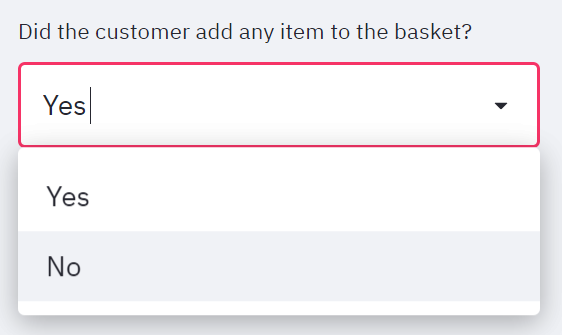
1) You would have seen 5 similar user input code blocks corresponding to the five input variables used during the model’s training. The user input is taken in the form of a “Yes” or “No” selection to a question.
option_basket = st.sidebar.selectbox(
     'Did the customer add any item to the basket?',
    ('Yes', 'No'))
2) Once the user chooses all the 5 input variables, he needs to click on a button that will trigger the prediction process based on the user inputs.
if st.sidebar.button('Predict Propensity of the Customer to make a purchase'):
        ...
3) Let us convert the user input into a form consumable by our saved model
lookup_dict={"Yes":1,"No":0}

dict = {'basket_add_detail':[lookup_dict[option_basket]],

            'promo_banner_click':[lookup_dict[option_promo]],

            'sign_in':[lookup_dict[option_sign_in]],

            "saw_homepage":[lookup_dict[option_home]],

            "returning_user":[lookup_dict[option_repeat]]

           }

prediction_df = pd.DataFrame(dict)
Load a saved Machine Learning model
4) Next, we will load the saved model (pickle file) and make a prediction using this model.
with open("propensity_model.pkl", 'rb') as pfile:
            propensity_model_loaded=pickle.load(pfile)
y_predicted=propensity_model_loaded.predict(prediction_df)
Predict the Propensity of Purchase
5) We have thus predicted the propensity of purchase of a customer.
  if (y_predicted[0]==1):
            st.write("The customer will order from the website. Probabality of ordering:")
  else:
            st.write("The customer will not order from the website. Probabality of ordering:")
  st.write(propensity_model_loaded.predict_proba(prediction_df))
Conclusion
Streamlit can be used to create ML-based web applications within a matter of hours. Hope this article motivates you to try out Streamlit based web applications. You can look at the documentation here. Some famous alternatives to Streamlit are Bokeh, Dash for Python users, and the famous R-Shiny Applications for R users. This is my first blog and I would love to hear feedback from the readers.
The media shown in this article are not owned by Analytics Vidhya and are used at the Author’s discretion.


Hi Congrats you have made an end to end project but your files / content of your files for streamlit are missing.Can you update your code or provide link where the components will be available predict.py Streamlit_main_app.py training.py