Understanding Indian Cuisine: A data-driven study
Indians love to eat, and the variety of food ensures that each part of India will surprise you with a new dish. The diversity in soil, climate, rainfall patterns, farming methods, ethnic groups, culture, occupation, etc of people across the country makes the cuisine very widespread and vast. People use a wide variety of vegetables, dairy products, spices, herbs, etc to cook their food.
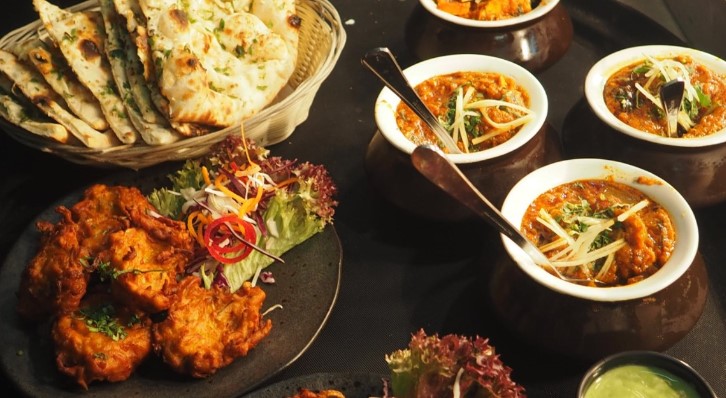
Image 1
Overview of Indian Cuisine
The iconic biryani is also cooked in different ways across the nation. The famous Hyderabadi Biryani is made by marinating the meat and cooking it along with the rice. The cooking is done over a slow fire to give it aroma and fragrance. The uniqueness of Kolkata biryani lies in using potatoes along with meat. Kolkata Biryani uses fewer spices but has more flavours. The wide variety of spices and raw materials available all over the Indian subcontinent makes it easy for each region to cook a dish in its own special way.
Understanding Indian cuisine can be a complex study. The wide variety of food types and recipes makes it difficult to group food dishes into a specific class. Indian food history is thousands of years old.
Indians consider a healthy breakfast very important. North Indians will prefer Roti and Parathas over Rice. People in Gujrat might prefer Dhokla, and people in South India will prefer Idli and Dosa. Bengali cuisine has many varied types of fish and sweets. Indians consider evening snacks an important part of the day where family members gather to chat over tea. There is also high importance of Desserts in Indian cuisine, similar to the Western concept of desserts. Sweets like Gulab Jamun, Rasgulla, Laddu, Jalebi are popular all across India.
To understand Indian cuisine, we need to analyse the geographic distribution of Indian dishes and the ingredients used in making the food.
Dataset for Indian Cuisine Analysis
The dataset is taken from Kaggle. The data contains various information on Indian dishes. Data includes the name of the dish, main ingredients, diet type, preparation time of the dish, the cooking time of food, flavour profile of the dish, meal course, state of origin of the dish, and the region of the state. The dataset also has many missing values.
Check the dataset here: https://www.kaggle.com/nehaprabhavalkar/indian-food-101
The dataset has a lot of information about Indian dishes and can be used to do a study.
Getting Started with the Indian Cuisine Analysis
Understanding Indian Cuisine Analysis Data
First, let us import the libraries and get the data.
import numpy as np
import pandas as pd
import plotly.express as px
import seaborn as sns
import matplotlib.pyplot as plt
%matplotlib inline
For this job, we will only need basic plotting tools and libraries. Now, we import the data.
df= pd.read_csv("/kaggle/input/indian-food-101/indian_food.csv")
Let us now see how the data looks like.
df.head()
Output:
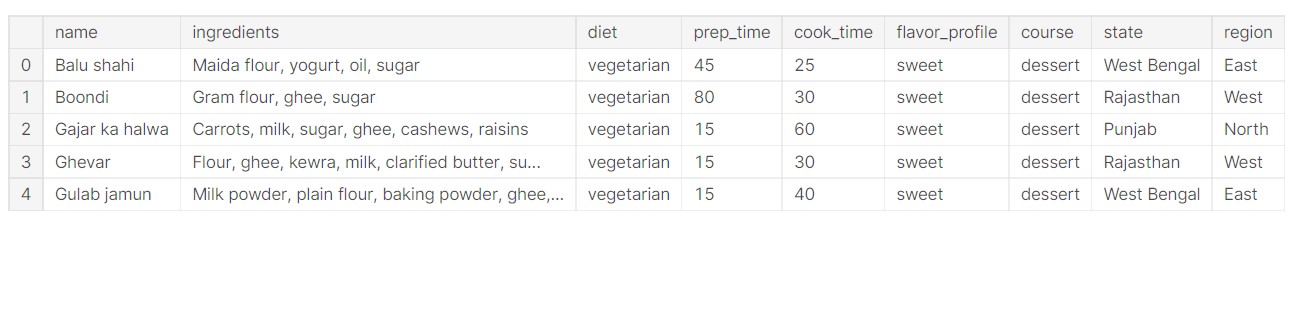
So, we can see that all the data is present and we can use it without any problems.
Let us have a look at the data types and amount of data points.
df.info()
Output:
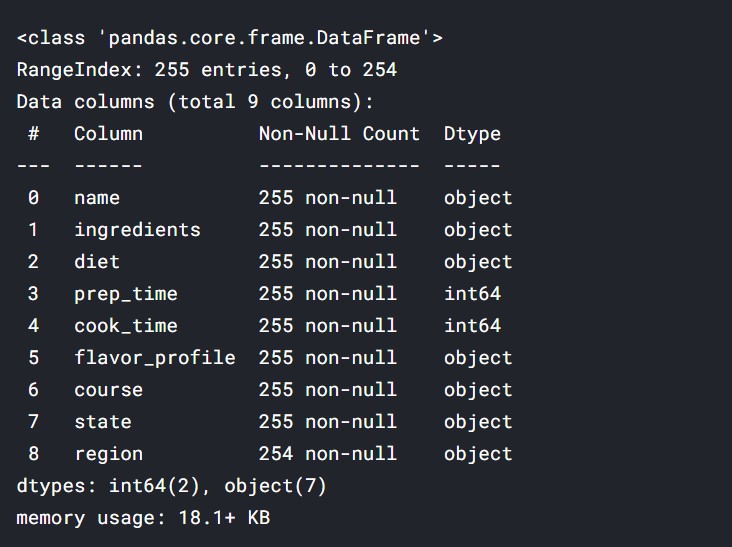
So, there are 255 dishes in the data. Quite a large number!
Only the prep_time and cook_time are numbers, which denote the dish preparation time and dish cooking time respectively. Others are all string fields, which is quite normal.
Let us have a look at the data distribution of the two numeric fields, that is prep_time and cook_time.
df.describe()
Output:
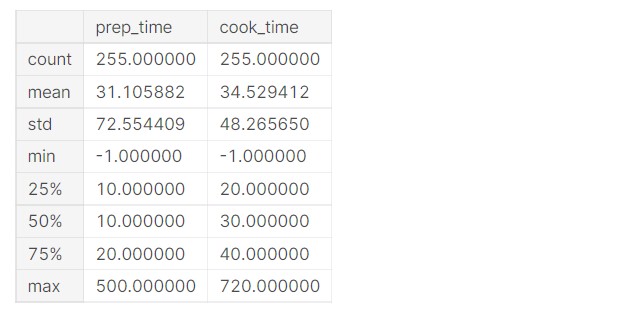
The mean preparation time and cook time is over 30 minutes. It does explain the fact that Indian dishes take a long time to get cooked. Since our childhood days, we have seen that our mothers took a long time to cook our favourite dishes (in India). The complex preparation and wide variety of ingredients used make it a long process.
Let us see the distribution of states.
px.bar(df, y="state")
Output:
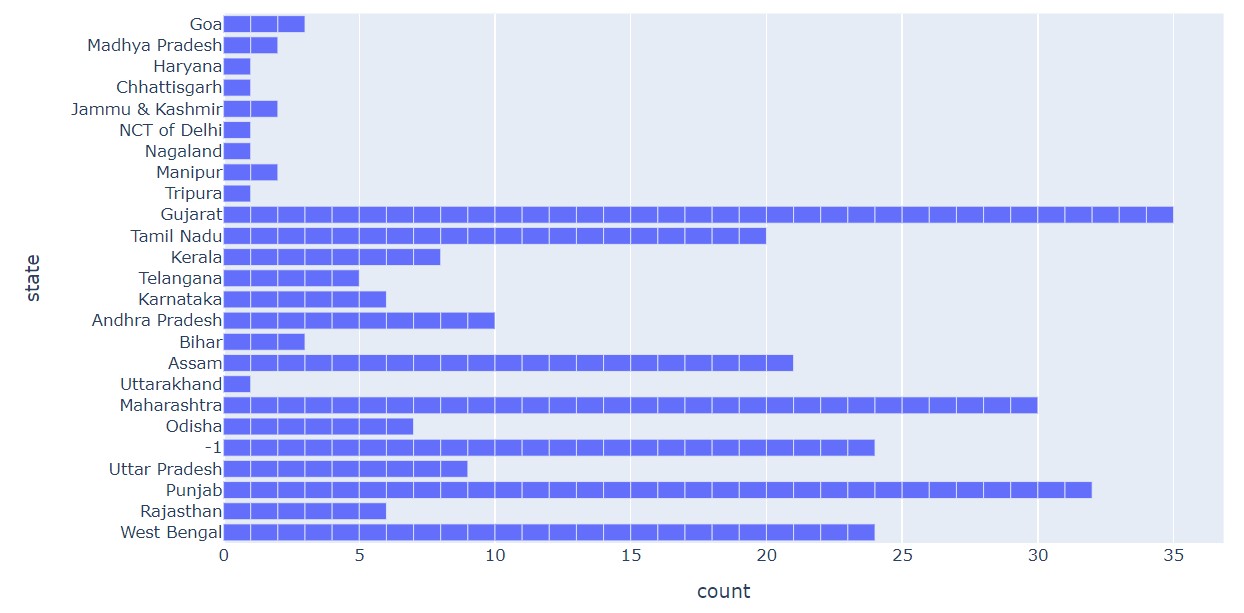
The largest number of entries here are from Gujrat.
Let us get the same data in the form of a table.
print("STATES WITH NUMBER OF DISHES")
pd.crosstab(df["state"],["name"])
Output:
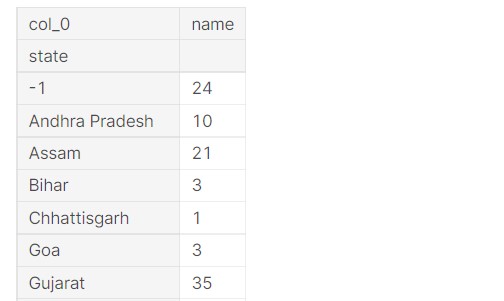
The entire table is longer. I will share the link to the notebook in the end, do have a look there.
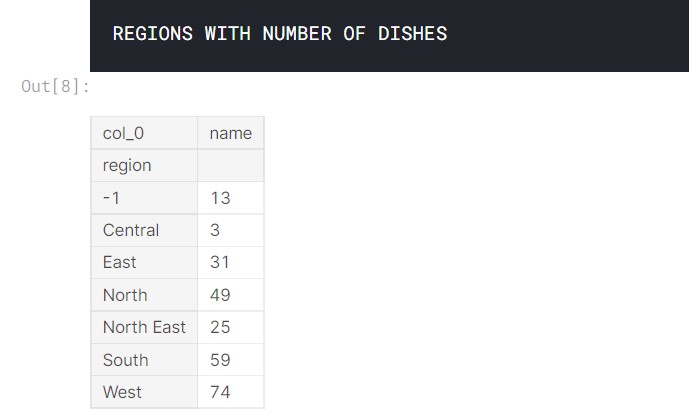
Let us see the distribution of regions.
print("REGIONS WITH NUMBER OF DISHES")
pd.crosstab(df["region"],["name"])
Output:
Let us see some more data visuals.
Next, we plot the regions as a pie chart.
px.pie(df, names='region', title='Region')
Output:
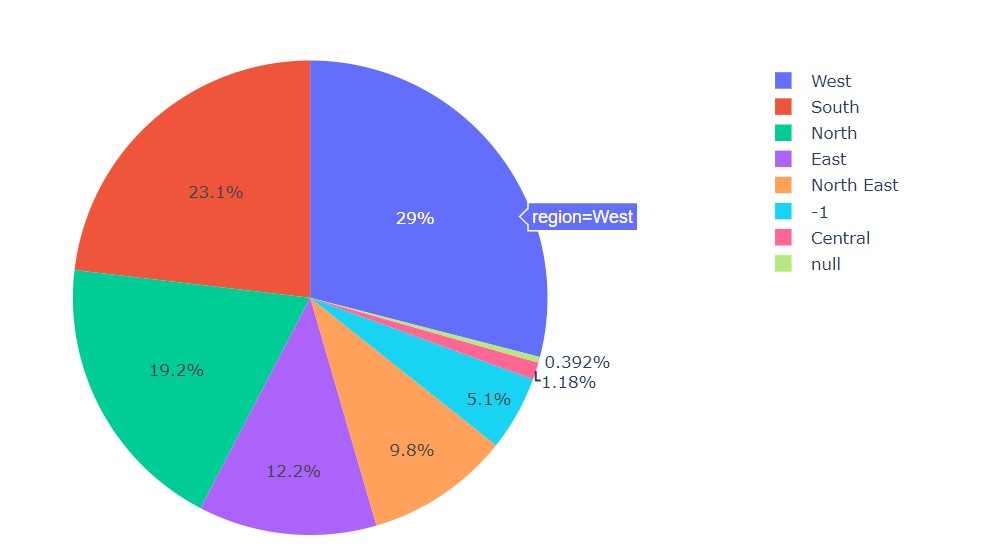
We can see that majority of the dishes listed here are from the western region.
Let us see if the dishes are veg or non-veg.
px.pie(df, names='diet', title='Dish Type')
Output:
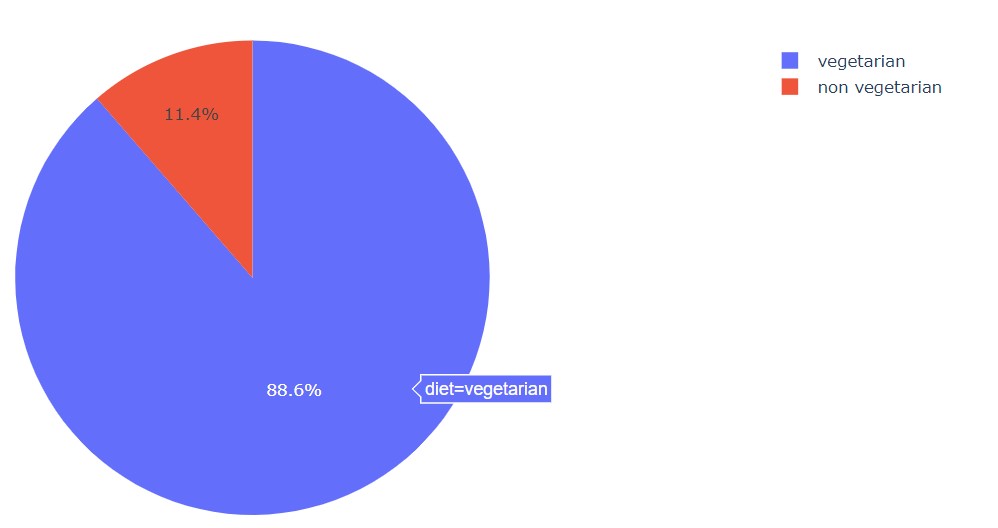
We can see that majority of the dishes are vegetarian and a few of them are non-vegetarian.
Let us see the flavour profile of the dishes.
px.pie(df, names='flavor_profile', title='Flavour Profile')
Output:
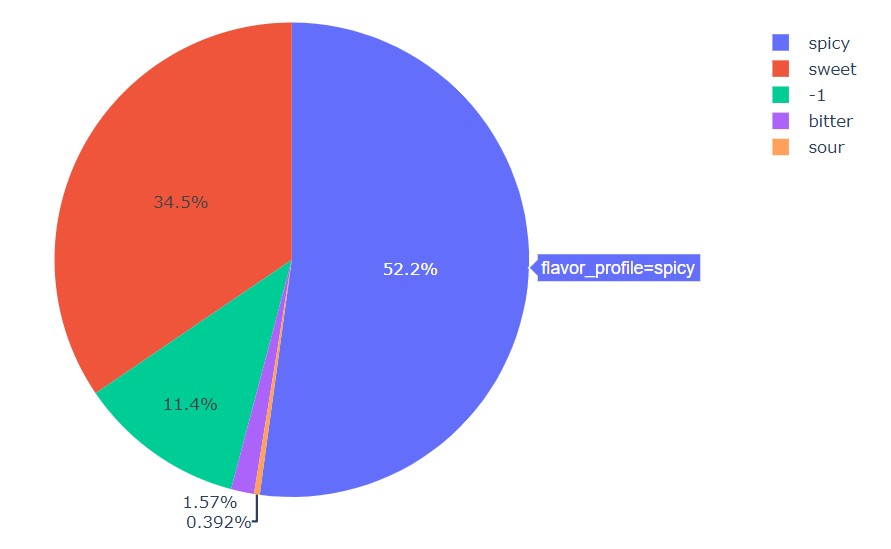
The majority of items are spicy, and then there are sweet items. The “-1” items are wrong and mislabeled data. Very few items are bitter or sour.
Now, we analyze the course of the meal.
px.pie(df, names='course', title='Diet Course')
Output:
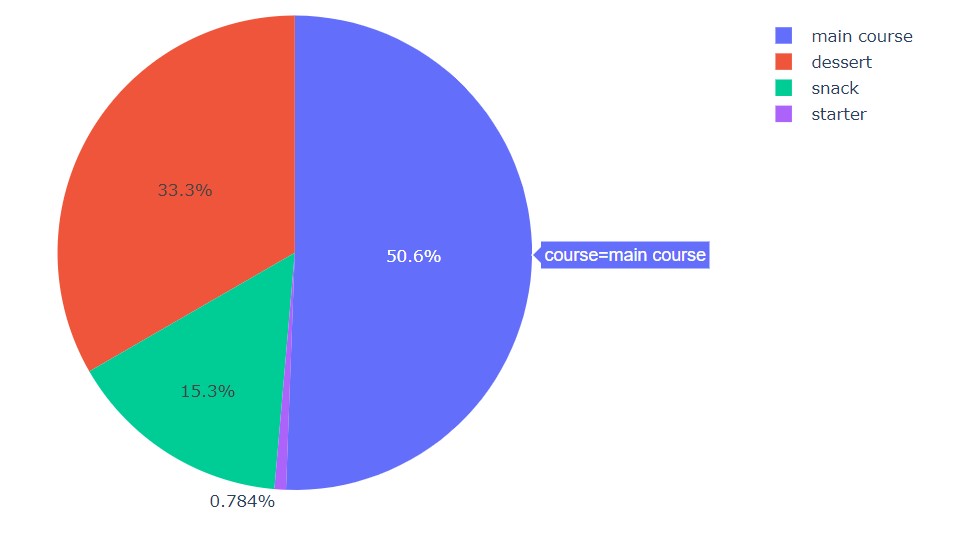
As we can see, the majority is the main course. Then, there is dessert.
Now, let us analyze the type of diet in each region.
px.bar(
    df, x='region', color= 'diet',
       title= 'Different Diet per Region',
       labels= {'region': 'Region', 'diet': 'Diet'},
       color_discrete_sequence=['#3CB14C','#35612D']
      )
Output:
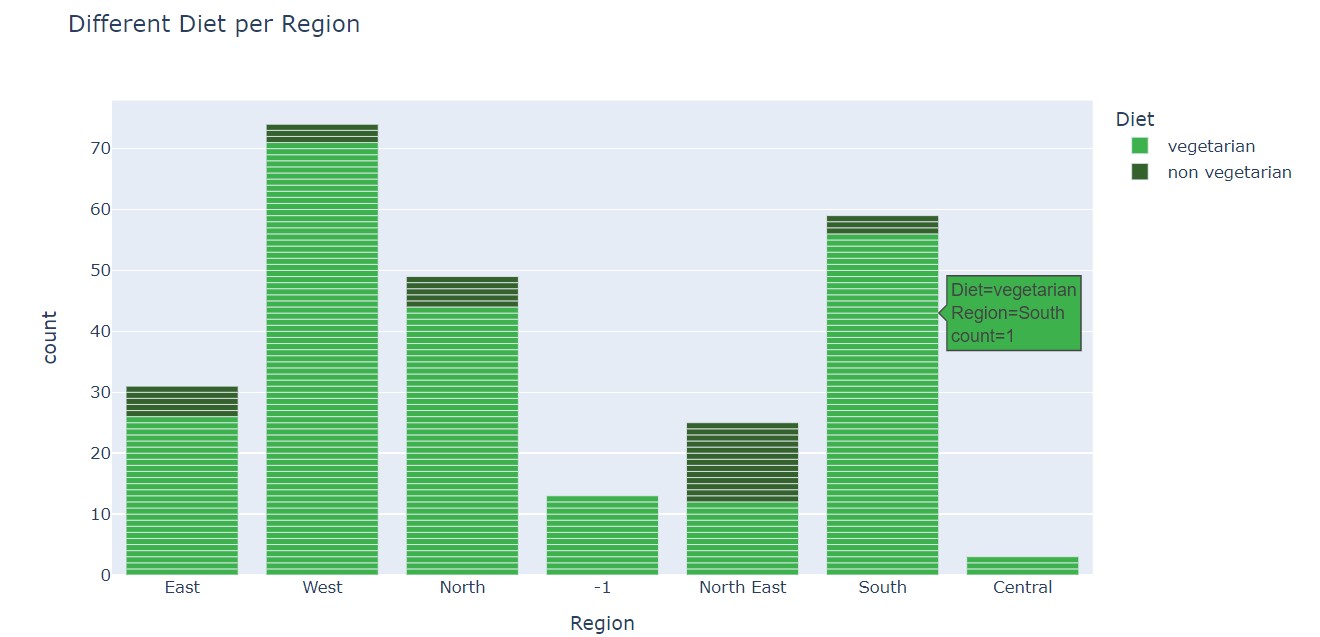
The majority of the non-veg dishes (as a ratio of total dishes) are in the Northeast region. Northern and western regions have very few non-veg dishes.
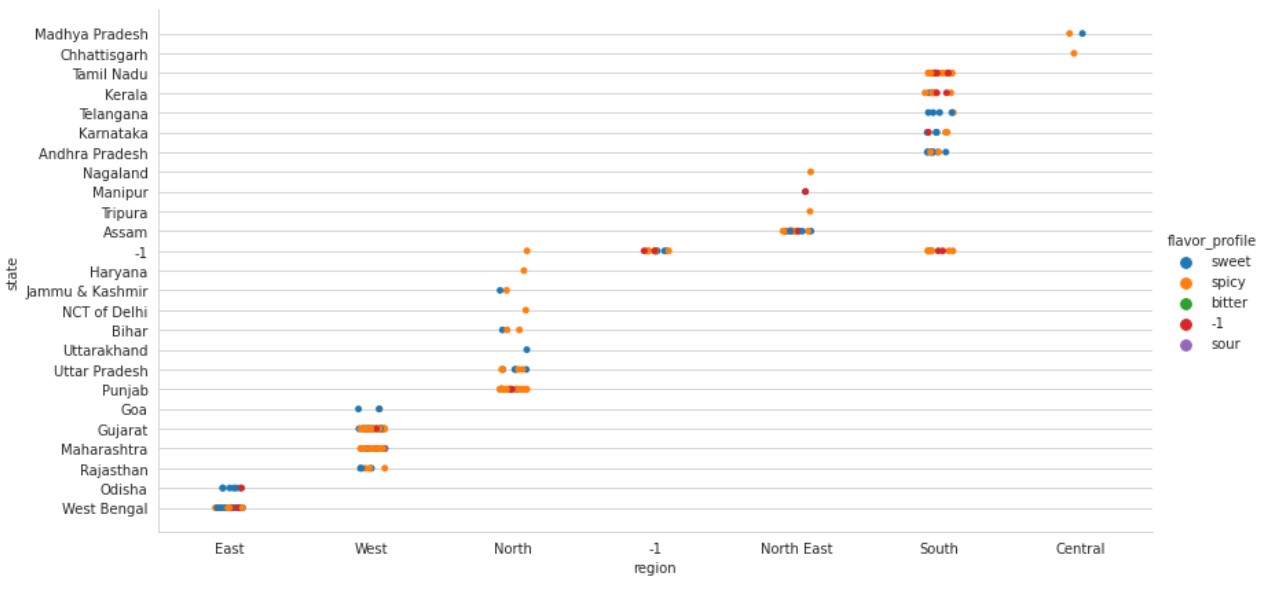
Let us try to see the broader picture of the data, with many distributions including Region, State and Flavour profile. This will give us a better understanding of the data.
sns.set_style("whitegrid")
sns.catplot(data=df, x="region", y="state", hue="flavor_profile", height=6, aspect=2)
Output:
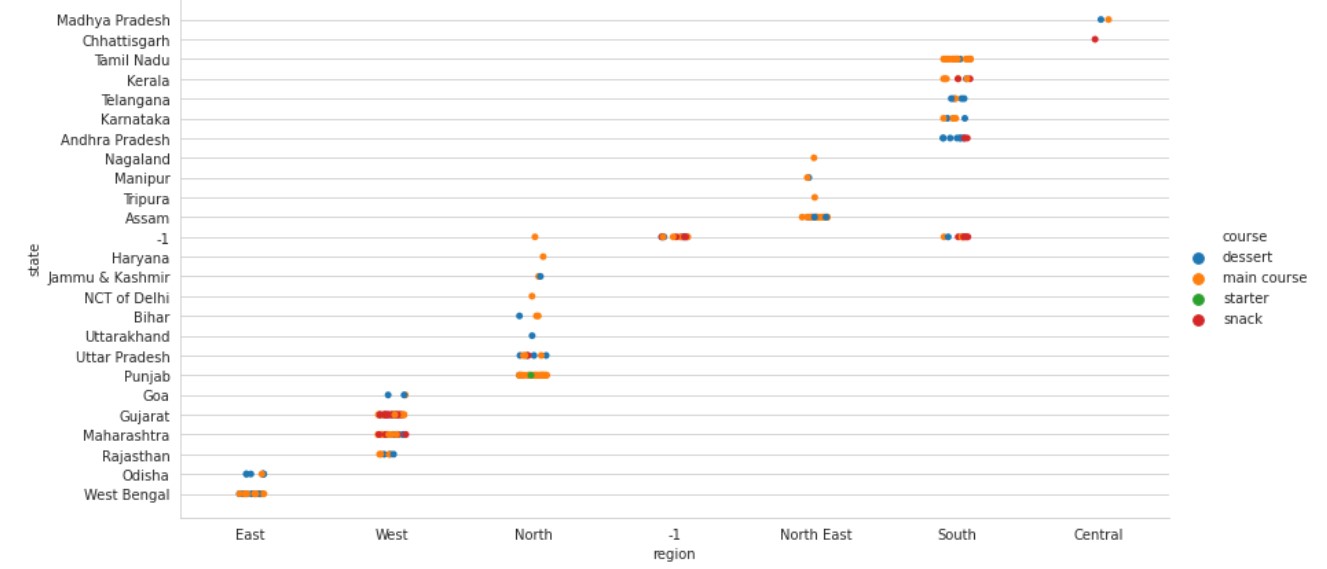
Now, let us replace the flavor profile with the meal course.
sns.set_style("whitegrid")
sns.catplot(data=df, x="region", y="state", hue="course", height=6, aspect=2)
Output:
After this, we proceed with simple bar plots.
sns.set_style("whitegrid")
plt.figure(figsize=(10,5))
sns.barplot(x="flavor_profile", y="cook_time", hue="diet", data=df)
Output:
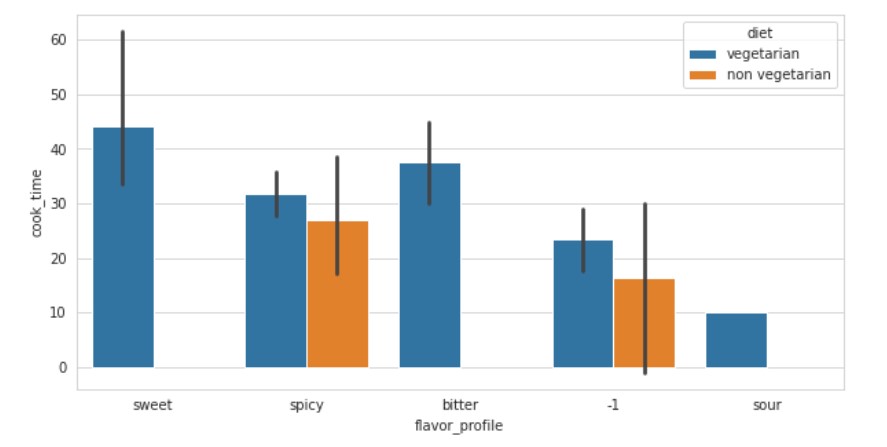
We see that all the non-vegetarian items are spicy. The “-1” units are wrongly labeled data. Sweet and sour foods are not non-vegetarian. The cook times of sweet dishes are in the higher range.
It is understandable as these dishes have many special requirements and preparation methods.
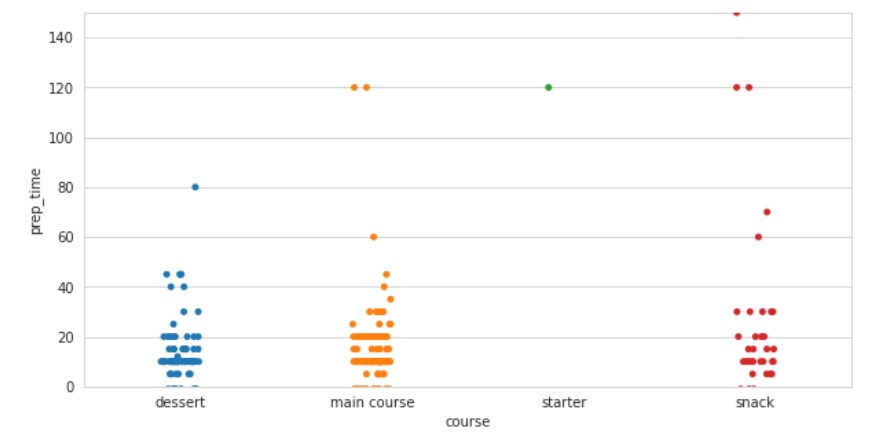
Let us compare the preparation times of different course types.
sns.set_style("whitegrid")
plt.figure(figsize=(10,5))
plt.ylim(0,150)
sns.stripplot(x="course",y="prep_time",data=df)
Output:
Now, we replace the preparation time data with cooking time data.
sns.set_style("whitegrid")
plt.figure(figsize=(10,5))
plt.ylim(0,150)
sns.stripplot(x="course",y="cook_time",data=df)
Output:
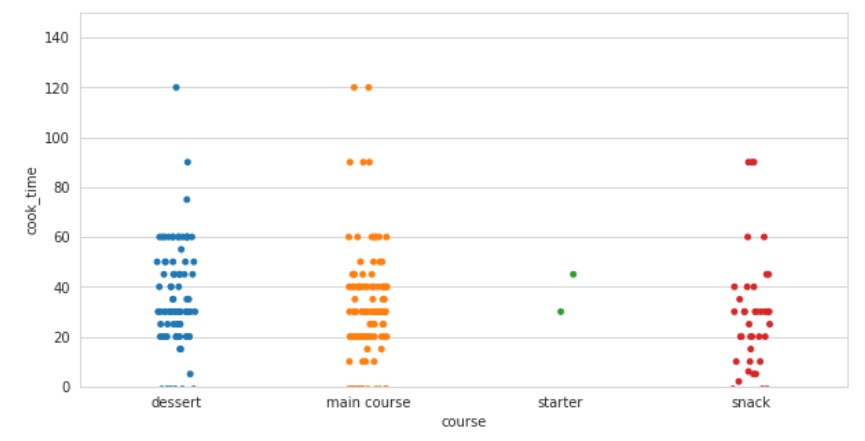
There are different types of food items with different cook times. Some of the inferences we can derive from all the data exploration and visuals:
1. Indian Food is highly spicy, a large share of the dishes is spicy.
2. Majority of the dishes follow a vegetarian diet.
3. There are also a wide variety of sweets. indicating the fact that Indians love sweets a lot.
Let us look at the food ingredients.
First, we will work on WordCloud.
ingredientsList=[]
for i in range(0,255):
    ingredientsList.append(df['ingredients'][i].split(","))
flat_list = []
for sublist in ingredientsList:
    for item in sublist:
        flat_list.append(item)
countIngredients=[]
for i in flat_list:
   countIngredients.append(flat_list.count(i))
flat_small=map(lambda x:x.lower(), flat_list)
Ingredients_df = pd.DataFrame(list(zip(flat_small, countIngredients)),
               columns =['Ingredient', 'Occurrence'])
sorted=Ingredients_df.sort_values(by=['Occurrence'], ascending=False)
unique_ingredients=sorted.drop_duplicates()
Now, we plot the word cloud.
from wordcloud import WordCloud, STOPWORDS, ImageColorGenerator
wordcloud = WordCloud(width = 1000, height = 500).generate(" ".join(flat_list))
plt.figure(figsize=(15,8))
plt.imshow(wordcloud)
plt.axis("off")
plt.show()
Output:
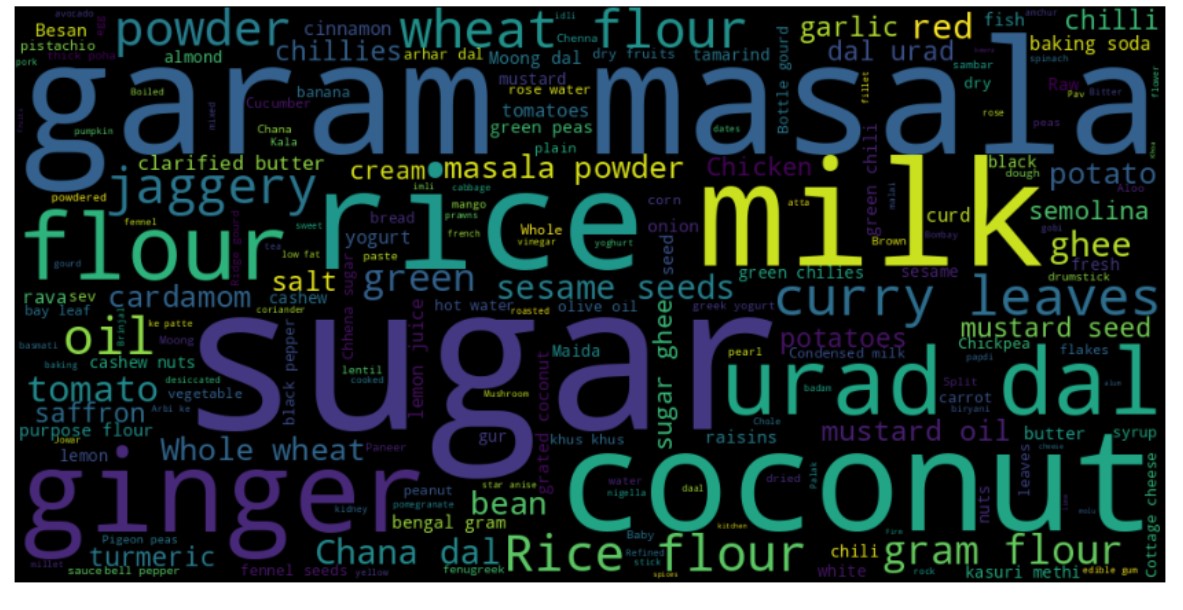
WordCloud Observation
1. Sugar is a big name here, from sugar to Gajar ka Halwa, a large number of Indian dishes have sugar as an ingredient.
2. Rice is also a staple diet of Indians, that is why it is prominent here.
3. Milk is also very important in the daily diet and is an important part of Indian cuisine. Paneer, Rasmalai, Dahi, Phirni, etc all have milk as an ingredient. Milk is not just a complete meal, but also an important ingredient in many Indian dishes.
4. We will find a large number of spices in the image, as Indian food is rich in spices. Garam masala is one such component. Most of the Indian spicy dishes have Garam Masala as an ingredient.
5. Ghee is also very important, Indians prefer Ghee over butter.
6. Tomato is also a very important ingredient in dishes.
The wide variety of ingredients makes a great variety in Indian cuisine. Let us see the top 30 ingredients.
px.bar(unique_ingredients.head(30), x='Ingredient' , y='Occurrence' )
Output:
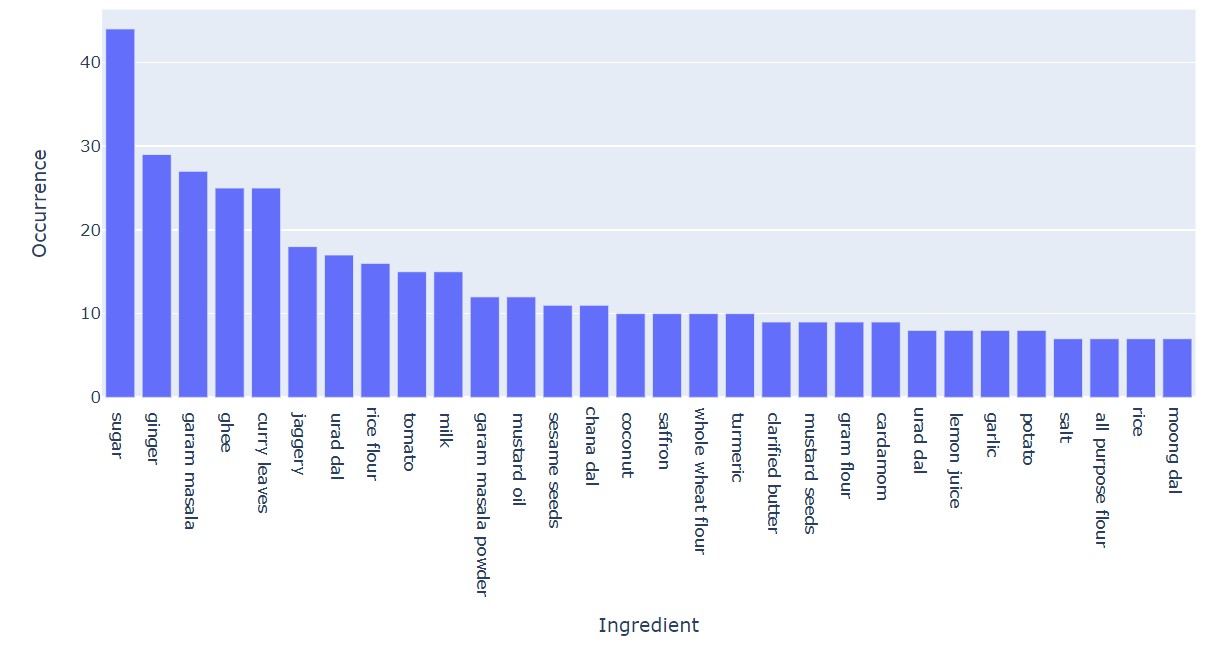
So, we see the data distribution for the food ingredients.
Some final study can be done, considering the regions and using bar charts to count and visualize data. Bar charts are a simple and great way to understand a lot of things.
First, we see the distribution of veg and non-veg foods for all Indian States.
sns.set_context('paper',font_scale=1.5)
plt.figure(figsize=(20,12))
sns.countplot(y=df.state,hue=df['diet'])
plt.ylabel('States')
plt.xlabel('counts')
plt.title("Number of Food Items from Each State - Veg & Non-Veg")
plt.show()
Output:
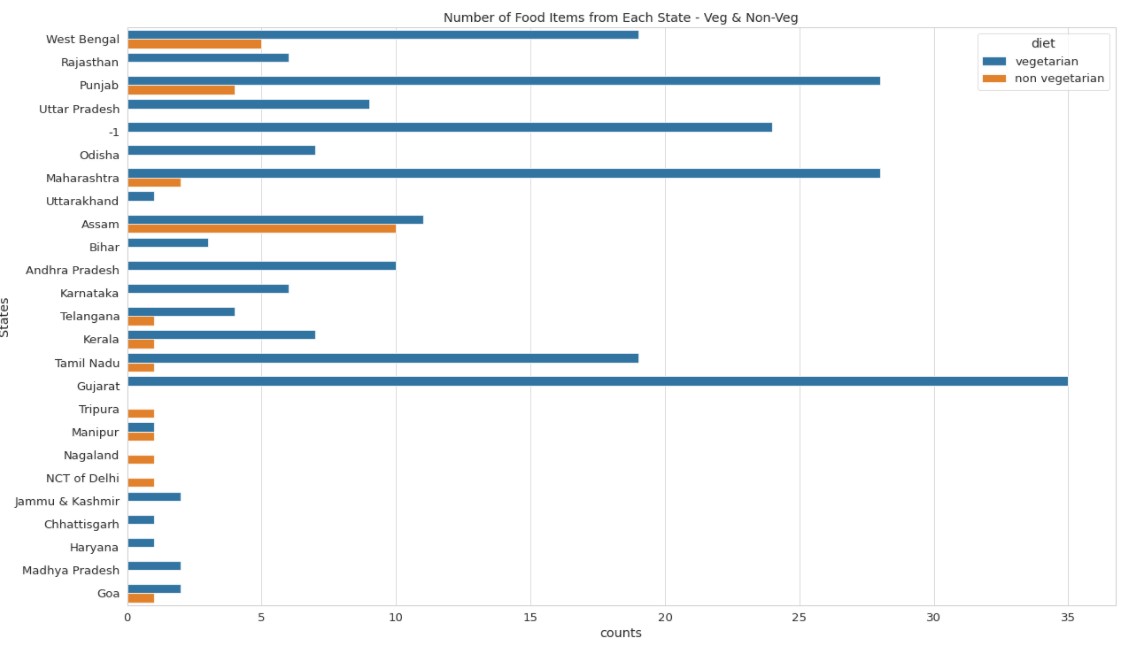
Some inferences:
West Bengal, Assam, and Punjab have the largest number of non-veg dishes. Goa also has a good percent of total dishes as non-veg dishes.
Now, coming to the barplot of the food profile based on region.
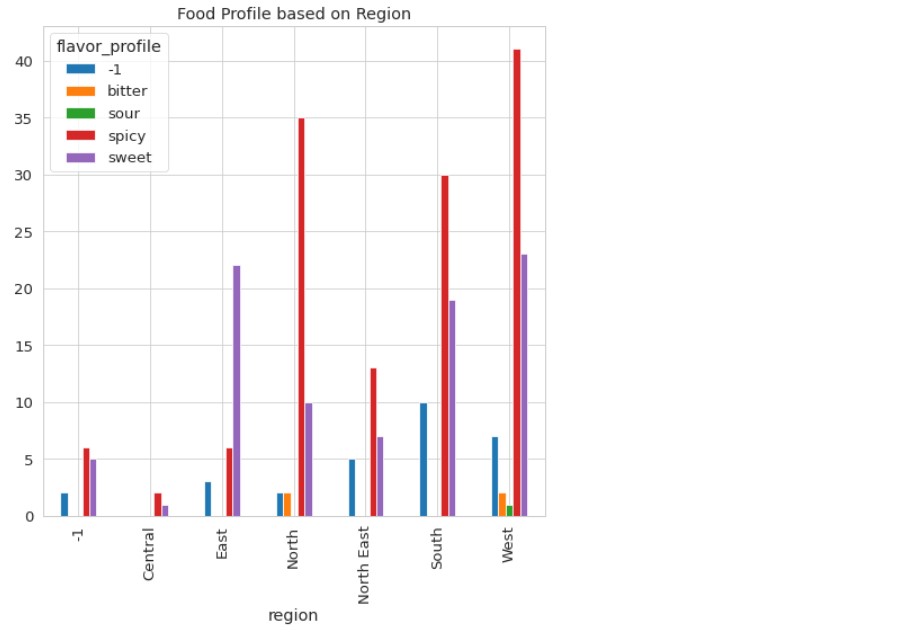
pd.crosstab(df["region"],df["flavor_profile"]).plot(kind="bar",figsize=(8,8))
plt.title("Food Profile based on Region")
plt.show()
Output:
And, finally, the food course is based on region.
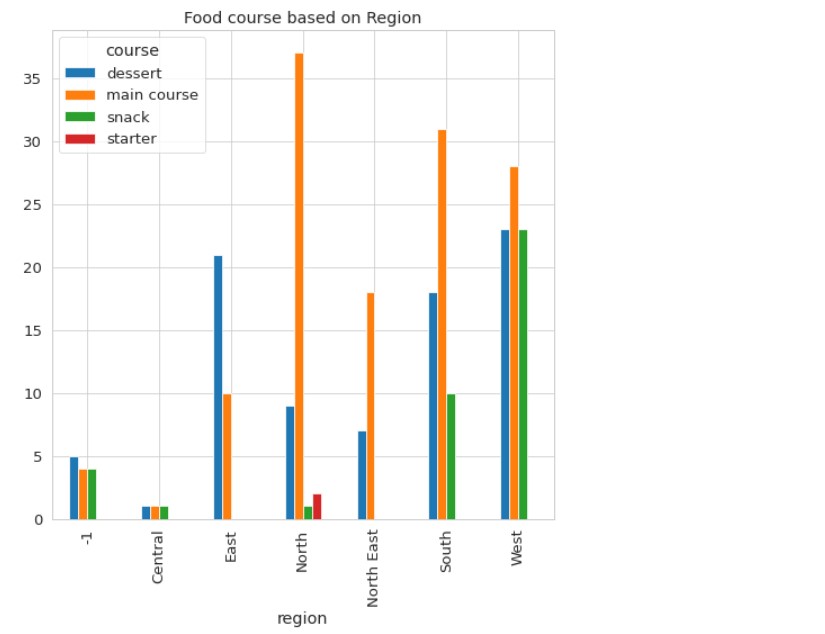
pd.crosstab(df["region"],df["course"]).plot(kind="bar",figsize=(8,8))
plt.title("Food course based on Region")
plt.show()
Output:
Let us see what we can understand
Spicy and sweet dishes are available in almost all states of India. The majority of Indian dishes are main course items. There are also a large number of desserts.
The entire study was an interesting way to understand the Food Map of India. Indian food map is a wide and vast area. To understand it in deep, we need more data and information. This limited amount of data serves the purpose of doing a basic study and analysis. We can get a brief overview of the whole Indian dishes scenario. With the limited amount of information, we understood a lot about Indian Cuisine.
The code is in the Kaggle Notebook, do consider upvoting if you like the work.
Notebook: https://www.kaggle.com/prateekmaj21/understanding-indian-food
About me
Prateek Majumder
Analytics | Content Creation
Connect with me on Linkedin.
My other articles on Analytics Vidhya: Link.
Thank You.
Image Sources
- Image 1 – https://www.pexels.com/photo/white-and-brown-cooked-dish-on-white-ceramic-bowls-958545/
The media shown in this article is not owned by Analytics Vidhya and are used at the Author’s discretion.
Prateek is a final year engineering student from Institute of Engineering and Management, Kolkata. He likes to code, study about analytics and Data Science and watch Science Fiction movies. His favourite Sci-Fi franchise is Star Wars. He is also an active Kaggler and part of many student communities in College.


