Clustering Machine Learning Algorithm using K Means
This article was published as a part of the Data Science Blogathon.
Table of Contents
1. Introduction
2. Clustering
3. Types of Clustering
4. K-Means Clustering
5. Finding K value
6. Elbow Method
7. Silhouette Method
8. Implementation
9. Conclusion
Introduction
In this article, we will learn about K-Means clustering in detail. K-Means is one of the most popular and simplest machine learning algorithms. K-Means is used when we have unlabeled data. So now we will learn everything in this article. Before going into that first we will learn what is clustering.
Clustering
Clustering: The process of dividing datasets into groups consisting of similar data points is called clustering.
Clustering is an unsupervised learning technique.
Imagine a supermarket where all the items were arranged. All the vegetables were placed in the vegetable section, fruits in the fruits section, and all. So that you can easily shop and get things that you want. They were not mixed up. This is an example of clustering. They were divided into clusters based on their similarity.
Let’s see some examples of clustering.
Whenever you visit Amazon, you will see a recommendation list of some products. This is based on your past purchases. This is done because of clustering.
And even same with Netflix. You will get movie recommendations based on your watch history.
Types of Clustering
1. Exclusive Clustering
2. Overlapping Clustering
3. Hierarchical Clustering
Exclusive Clustering: Exclusive Clustering is the hard clustering in which data point exclusively belongs to one cluster.
For example, K-Means Clustering.
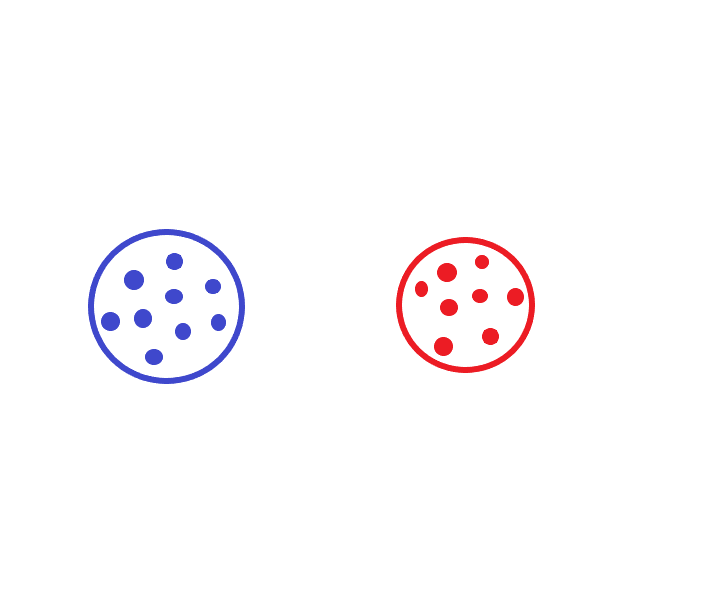
Here you can see all similar datapoints are clustered. All the blue-colored data points are clustered into the blue cluster and all the red-colored data points are clustered into the red cluster.
Overlapping Clustering: Overlapping clustering is the soft cluster in which data point belongs to multiple clusters.
For example, C-Means Clustering.
.png)
In this, we can see that some of the blue data points and some of the pink data points are overlapped.
Hierarchical Clustering: Hierarchical clustering is grouping similar objects into groups. This forms the set of clusters in which each cluster is distinct from another cluster and the objects within that each cluster is similar to each other.
I know this might be a little confusing. Let’s understand it in detail.
.png)
Source-Author
Observe this picture. There are Six different data points namely, A, B, C, D, E, and F.
Coming to case1, A and B are clustered based on some similarities whereas E and D are clustered based on some similarities.
Coming to case2, the combination of A and B is similar to C so the combination of A and B is grouped with C.
Coming to case3, the combination of D and E is similar to F. So the combination of D and E is grouped with F.
Coming to the last case, the combination of A, B, C and combination of D, E, F are quite similar so all these points are grouped into a single cluster.
This is how hierarchical clustering works.
Let’s learn about K-Means Clustering in detail.
K-Means Clustering
K-Means Clustering: The algorithm which groups all the similar data points into a cluster is known as K-Means Clustering. This is an unsupervised machine learning algorithm. This contains no labeled data. K-Means is a centroid-based algorithm in which each group has a centroid.
Here K in K-Means is the number of clusters. In this K-Means algorithm first, we randomly assign some centroids to the dataset. And then clusters are formed by assigning data points to the cluster to which the data point is near to the corresponding cluster. From those clusters, new centroids were formed with the mean data points. This process will continue until the model is optimized which means the final centroids will not change even for the next iteration.
Let us understand it in detail by taking some random data points. For these points, two clusters were formed with random centroids.
This is the first iteration. Centroids were completely random and clusters will look like this.
.png)
Source: Author
Now coming to the second iteration, the mean of data points were taken and new centroids were formed. Now the clusters will look like this.
.png)
Now coming to the third iteration, again centroids were reassigned based on mean data points. Clusters will be like this.
.png)
Here the model is optimized. Centroids were not changing though we iterate again. So final clusters were formed.
Finding K value
In this article, we will see 2 methods to find the K value for K-Means.
1. Elbow Method
2. Silhouette Method
Elbow Method
Elbow Method: This is one of the most popular methods that is used to find K for K-Means.
For this, we have to learn something known as WSS(Within the sum of squares).
WSS: The WSS is defined as the sum of squared distance between each member of the cluster and its centroid.
.png)
Where
p(i)=data point
q(i)=closest centroid to the data point
Here in the elbow method, the K value is chosen after the decrease of WSS is almost constant.
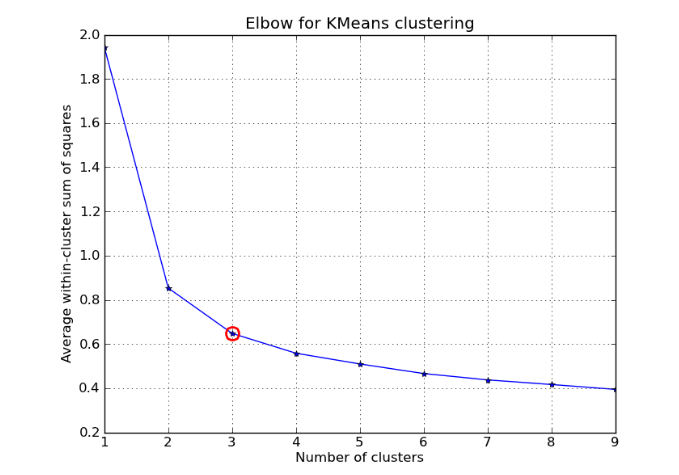
Source-https://machinelearninginterview.com/wp-content/uploads/2020/12/elbow.png
In the above picture, you can see the elbow point, which is 3. After that point, WSS is almost constant. So 3 is selected as K.In this way elbow method is used for finding the value of K
Silhouette Method
Silhouette Method: Here in the silhouette method, we will compute the silhouette score for every point.
Silhouette Coefficient for the point= (b-a)/max(a,b)
Where
a=mean intra-cluster distance
b=mean nearest cluster distance
Silhouette coefficient for dataset = Mean Silhouette Coefficient over points.
If we draw a graph for these points, we will get something like this.
.png)
So here we can see the highest silhouette coefficient is for K = 3. In this way, the silhouette method is used for finding K.
But in the Silhouette method, there are some chances of getting overfitted to some extent. Because by increasing the number of clusters, the size of clusters becomes small and distance between other clusters may decrease and finally leads to overfitting sometimes. But in a lot of cases, it works well.
It is available in scikit learn library.
sklearn.metrics.silhouette_score
Implementation
Create a model by importing KMeans which is an inbuilt model in scikit learn library. So we can directly import it. Using the fit method train the model with data. and finally, use the predict method to predict the outcome of desired data.
And finally, in visualizations, you can see all the data points were clustered into different groups, and centroids were also assigned.
This is how K-Means Clustering is implemented.
In this colab notebook, you can see how K Means is implemented by taking some dataset.
Conclusion
In this article, we have learned about the K Means clustering algorithm from scratch to implementation. First, we have seen clustering and then finding K value in K Means. For that, we have seen two different methods. Overall we have seen the importance of the K Means clustering algorithm. Finally, we had implemented the code for this algorithm in the Jupiter notebook.
Hope you guys found it useful. Read more articles on machine learning algorithms on AV blog.
Connect with me on Linkedin:
https://www.linkedin.com/in/amrutha-k-6335231a6vl/
The media shown in this article is not owned by Analytics Vidhya and are used at the Author’s discretion.


