Learn About Apache Spark Using Python
Introduction
In the last article, we discussed Apache Spark and the big data ecosystem, and we discussed the role of apache spark in data processing in big data. If you haven’t read it yet, you can find it on this page.
This article will discuss the Spark MLlib in detail with Implementation with Python. In Big data primary goal is to process the data and get insights, and spark lets you build data pipelines with Machine learning support which means we can get our training and prediction in real-time. Spark ML library → MLlib (Machine learning library) is used for implementing machine learning operations using Spark Dataframe based APIs.
MLlib supports various data sources, including Parquet, CSV, JSON, JDBC, etc. MLlib has special libraries for images and LIBSVM data types and supports label column data and a feature vector.
LIB SVM It is a DataFrame type that has a label column and feature vector.
This article was published as a part of the Data Science Blogathon.
Table of contents
Features of MLlib
Spark MLlib provides functions that easily extract features from raw data, feature extraction, dimensionality reduction, string tokenization, and other tasks.
- MLlib supports both Supervised and Unsupervised machine learning
- We can create a classifier for image and audio in Spark
- Clustering can also be performed with the help of MLlib
- Spark can be used in real-time computer vision tasks.
- External spark packages can be installed for specific tasks.
We can make machine learning pipelines using Transformers, Estimators, and the Pipeline API.
Objective
We are going to implement a Regression model in Spark:
- Getting Spark ML and statistical libraries
- Basic statistical operations
- Building Simple linear regression in Spark
- Training and evaluation
Installing Pyspark
Installation and setup of Pyspark are effortless. Using the pip package manager, you can install Pyspark in any cloud notebook in Python.
!pip install pyspark
!pip install findspark
import findspark
findspark.init()
Importing Required libraries
import pandas as pd
import matplotlib.pyplot as plt
from pyspark import SparkContext, SparkConf
from pyspark.sql import SparkSession
Creating Spark Session and Context
We need to create a Spark session to load our data frames.
# Spark Context Class
sc = SparkContext()

# spark session
spark = SparkSession
    .builder
    .appName("Python Spark DataFrames Machine learning")
    .config("spark.some.config.option", "some-value")
    .getOrCreate()
I was verifying the Spark session instance by running the spark command.
Spark ML Libraries
In this article, we are mainly going to cover four SparkMl functions. For more information about ML libraries, refer to this link.
- Feature library (
pyspark.ml.feature)
The feature library is used to create feature vectors and process them, and the feature library contains VectorAssembler, Normalizer, Standard Scaler, etc.
- stat library(
pyspark.ml.stat)
Stat library is used for Statistical tasks like Correlation, Hypothesis testing, Std deviation, etc.
- Regression library (
pyspark.ml.regression)
The regression library contains Regression models.
from pyspark.ml.feature import VectorAssembler, Normalizer, StandardScaler
from pyspark.ml.stat import Correlation
from pyspark.ml.regression import LinearRegression
Loading Data and Creating Feature Vectors
We are loading the data in Spark using pandas data frame, and later using MLlib classes, we will convert the data frame into feature vectors for model building.
Loading the car data frame using cars.csv
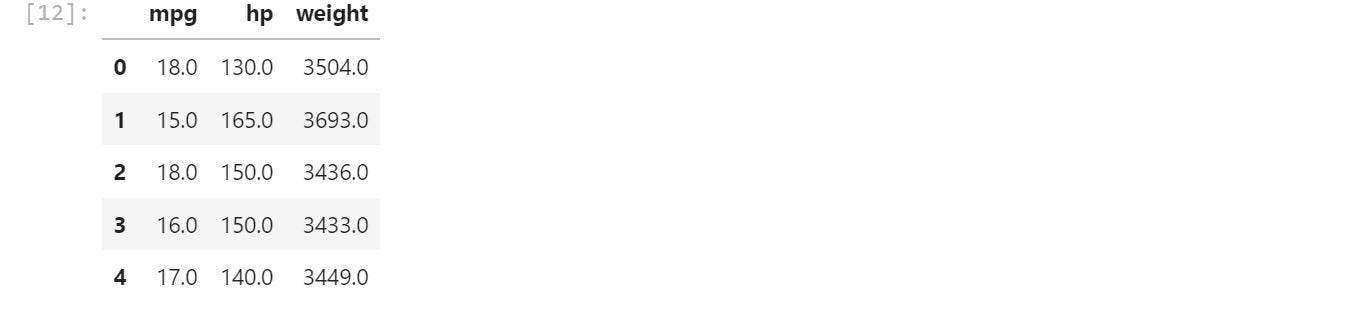
cars = pd.read_csv('https://cf-courses-data.s3.us.cloud-object-storage.appdomain.cloud/IBM-BD0225EN-SkillsNetwork/labs/data/cars.csv',header=None, names=["mpg", "hp", "weight"])we are interested in loading only 3 columns, and that is mpg (mileage per gallon, hp(horsepower), and weight.
Loading pandas Dataframe into Spark Dataframe
We use the function createDataFrame to load the data into a Spark dataframe.
sdf = spark.createDataFrame(cars2)
sdf.printSchema()
Feature vectors are used to work with ML models in Spark. Using the function, VectorAssemblerwe can convert the dataframes column into feature vectors.
Hp and weight are the input features, and mpg(miles per gallon) is the target label.
assembler = VectorAssembler(
    inputCols=["hp", "weight"],
    outputCol="features")
output = assembler.transform(sdf).select('features','mpg')
here output is a spark dataframe, and it contains the column featuresand mpg .
Splitting the Dataset into Training and Testing
train, test = output.randomSplit([0.75, 0.25])75% of the data will be used for training, and 25 % of the data will be used for testing purposes.
Feature Engineering and Statistics
In this part, we perform feature engineering and fundamental statistics to improve our training data by creating new features and dropping redundant features.
This process involves the study of our data on how the different feature vectors are working and how are they related. We use statistics to understand the relation between features.
Correlation
Spark ML offers inbuilt statistical functions. We can use the Correlation function from the Stat library to determine the different types of correlations betweenhp and weight.
Correlation function → Correlation.corr(df_name,”feature_col”,”type_of_correlation”)
r1 = Correlation.corr(train, "features","pearson").head()
print("Pearson correlation matrix:n" + str(r1[0]))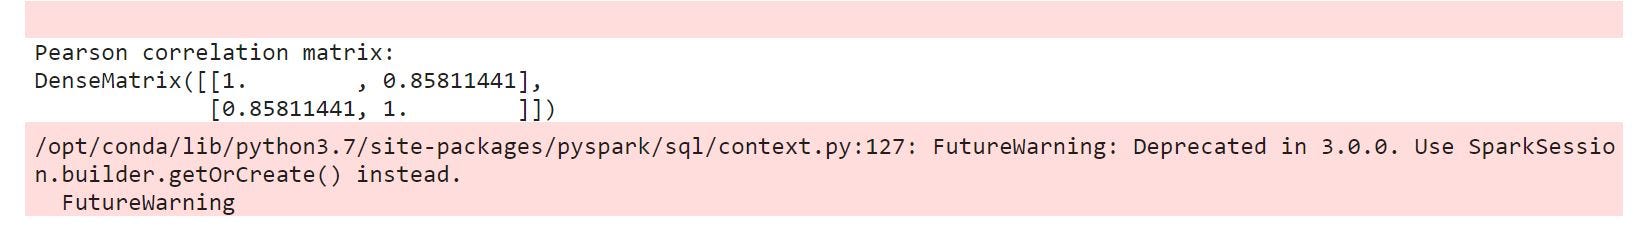
r2 = Correlation.corr(train, "features", "spearman").head()
print("Spearman correlation matrix:n" + str(r2[0]))
We observed that there is a 0.86 (or 86%) correlation between features ( “weight” and “hp”). That is logical as a vehicle with higher horsepower will likely have a bigger engine and thus weigh more.
We can visualize the correlation between horsepower and weight.
plt.figure()
plt.scatter(cars2["hp"], cars2["weight"])
plt.xlabel("horsepower")
plt.ylabel("weight")
plt.title("Correlation between Horsepower and Weight")
plt.show()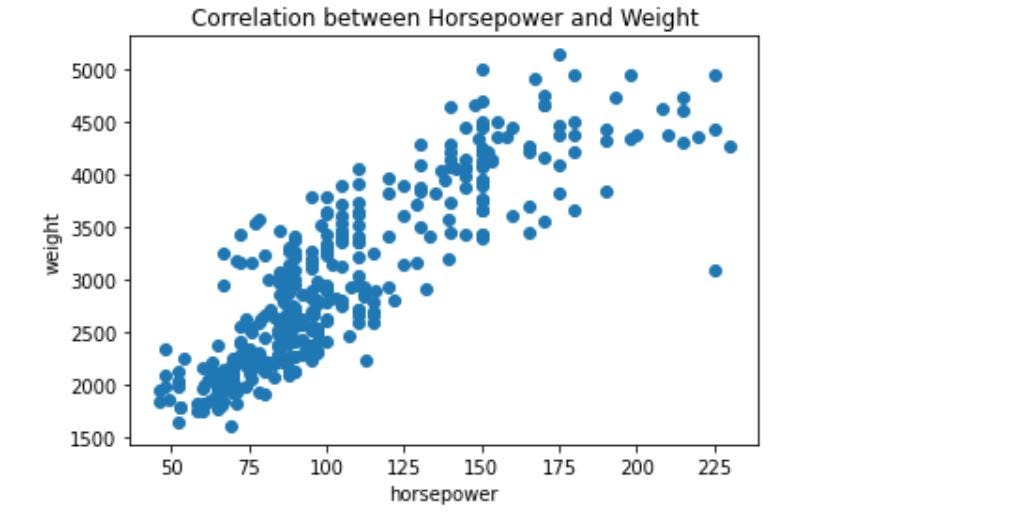
Normalization
Normalization helps our model to converge more efficiently and faster. It is a good practice to normalize our feature vectors before training.
Normalization shifts the value ranging between 0 and 1.
Spark ML lib provides a Normalizer Class to normalize our feature vectors.
normalizer = Normalizer(inputCol="features", outputCol="features_normalized", p=1.0)
train_norm = normalizer.transform(train)
print("Normalized using L^1 norm")
train_norm.show(5, truncate=False)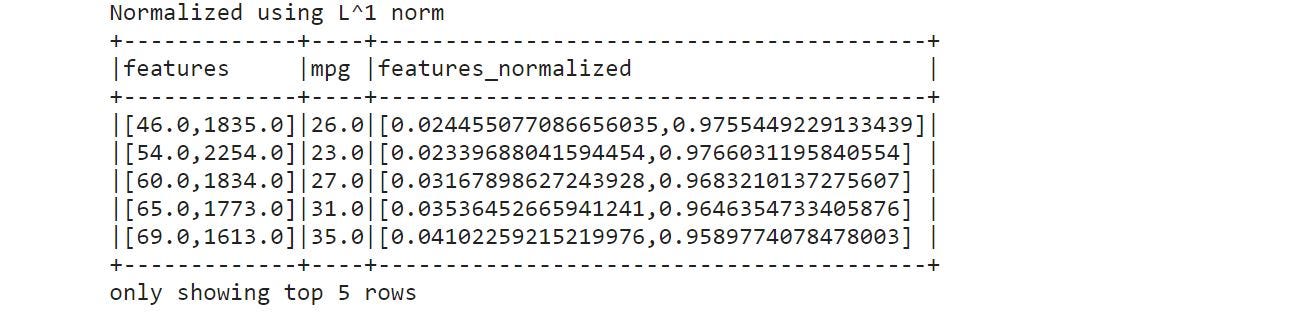
- P denotes the range 0–1.
- We first instantiate the Class Normalizer and then call the function transform to perform actual normalization.
Standard Scaling (Standardization)
This is a technique to scale the features such that all columns in the features have 0 mean and 1 unit variance. This creates a bell-shaped distribution.
Standard Scaling does not restrict data values in a certain range.
Spark provides StandardScaler for standardization.
standard_scaler = StandardScaler(inputCol="features", outputCol="features_scaled")
train_model = standard_scaler.fit(train)
train_scaled = train_model.transform(train)
train_scaled.show(5, truncate=False)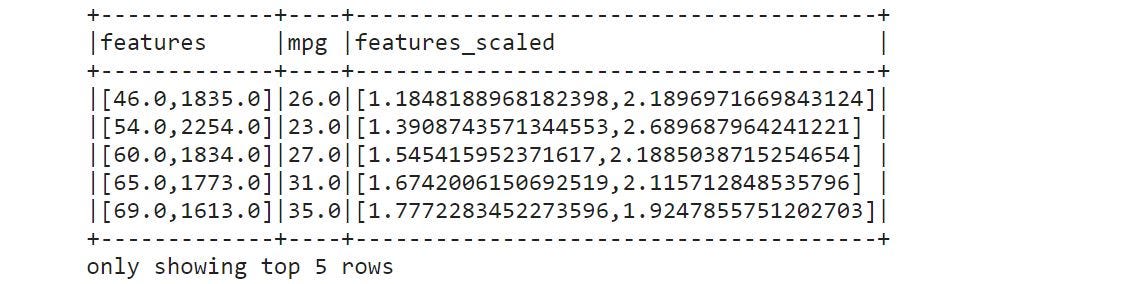
Note: If we are scaling the training data we must scale testing data as well using the same fitted scaling class.
Scale the testing data
test_scaled = train_model.transform(test)
test_scaled.show(5, truncate=False)
Model Building and Training
At this step, we are ready with our scaled feature vectors. We will train our Standard Scaled version of features on the Linear Regression Model using Spark, the Inbuilt Regression model.
If you want to revise your regression concepts, refer to this link.
- we are creating a model using
LinearRegression()class and training using the functionfit().
from pyspark.ml.regression import LinearRegression
# Create a LR model
lr = LinearRegression(featuresCol='features_scaled', labelCol='mpg', maxIter=100)

# Fit the model
lrModel = lr.fit(train_scaled)

# coefficients and intercept
print("Coefficients: %s" % str(lrModel.coefficients))
print("Intercept: %s" % str(lrModel.intercept))

# Summary
trainingSummary = lrModel.summary
#trainingSummary.residuals.show()
print("RMSE: %f" % trainingSummary.rootMeanSquaredError)
print("R-squared: %f" % trainingSummary.r2)

RMSE : 4.11→ Our model predicts mpg with an average error of 4.11 units.lrModel.coefficients→ Returns regression coefficients.
Prediction Phase
Once our model is trained, we can use the function transform()to get predictions on our new unseen scaled data.
model.transform()It automatically creates a prediction column in our test data.
lrModel.transform(test_scaled).show(5)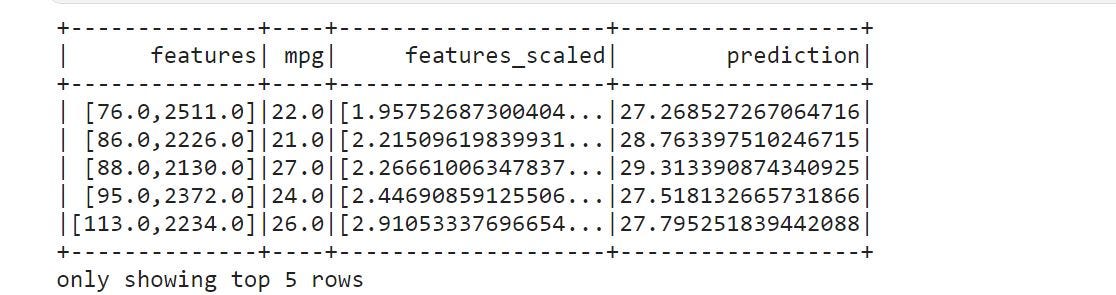
As you noticed that, mpg(true-mpg) and prediction(predicted-mpg) are pretty close and have an average error of 4.11 units.
Conclusion
This article discussed machine learning capabilities with Apache spark in Python. We then discussed the steps involved in building a machine learning pipeline, and Spark supports many add-on packages for specific tasks.
Spark supports computer vision and natural language processing. Spark can be used for building pipelines for computer vision and natural language processing tasks.
Frequently Asked Questions
A. Normalizing in PySpark involves using the StandardScaler or Min-Max Scaler functions from the MLlib library to scale numerical data within a specific range, making features comparable and improving machine learning model performance.
A. Normalization in Spark, like in PySpark, is the process of scaling numerical data to a standard range, such as between 0 and 1, to ensure that features are on a common scale for fair comparisons and to mitigate the influence of varying feature scales on machine learning models.
A. Regexp_replace in PySpark is a function used for text manipulation. It enables you to search for substrings within a text column using regular expressions and replace them with a specified replacement string. This function is useful for cleaning and modifying text data in data processing tasks.
A. The Standard Scaler in PySpark is a feature transformation technique that standardizes numerical features by subtracting the mean and dividing by the standard deviation. It scales data to have a mean of 0 and a standard deviation of 1, making it suitable for machine learning algorithms that are sensitive to feature scaling.
The media shown in this article is not owned by Analytics Vidhya and is used at the Author’s discretion.


beautiful work But pls, correct errors thks