Introduction to K-Means Clustering using MLIB
This article was published as a part of the Data Science Blogathon.
Introduction
K-means clustering is one of the algorithms which unsupervised machine learning supports hence before moving forward with K-means let’s have background knowledge of the unsupervised learning method. In this method, we don’t have predefined labels unlike the supervised method hence we don’t draw predictions but make clusters/groupss out of them so that the data could get segmented according to the features that are fed to the model.
What approach does K-Means clustering follow?
As discussed that this algorithm is a part of unsupervised learning so instead of making predictions we will segment that data based on the different number of clusters. K-means follow a few mathematical steps which are important to discuss:
Step 1: Select the number of clusters, and there are a few ways to select the appropriate number of clusters like the elbow method and domain knowledge.
Step 2: Assigning the K points or we can also say randomly assigning the centroids from the dataset.
Step 3: In the last step each K point will be adjusted closely towards its closest centroid that will eventually form the clusters/group.
Initiating the Spark Object
This step in any spark-related project is the first thing we have to do by creating and instantiating the PySpark environment so that we can access all of its utilities and functions that are required to implement the K-means clustering algorithm.
from pyspark.sql import SparkSession
spark = SparkSession.builder.appName('intro_cluster').getOrCreate()
spark
Output:
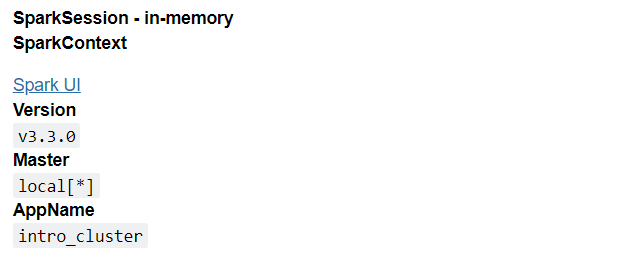
Inference: First and foremost SparkSession object is called from PySpark’s SQL module then we created the intro_cluster session using the getOrCreate() function incorporated by the builder() function.
from pyspark.ml.clustering import KMeans
Inference: In PySpark we import all the classification algorithms like decision tree classifier, GBT classifier, Random forest classifier, and logistic regression from the classification class same way we are importing the KMeans object from the clustering class.
Reading the Dataset
As mentioned earlier as well that this is the dataset which is provided by the spark in their official GitHub repository, this dataset is quite small so one should not expect real-world results but surely it can help to understand the concept of practically implementing the k-means clustering.
dataset_kmeans = spark.read.format("libsvm").load("sample_kmeans_data.txt")
dataset_kmeans.show()
Output:
Inference: Here notice that we are reading the dataset after converting it in the format of lib-svm as the dataset is in the form of lib-svm and then it becomes easy to load. Later we are looking at the dataset using the show function.
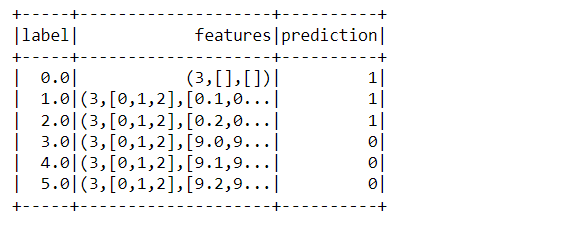
dataset_kmeans.head(5)
Output:
[Row(label=0.0, features=SparseVector(3, {})),
 Row(label=1.0, features=SparseVector(3, {0: 0.1, 1: 0.1, 2: 0.1})),
 Row(label=2.0, features=SparseVector(3, {0: 0.2, 1: 0.2, 2: 0.2})),
 Row(label=3.0, features=SparseVector(3, {0: 9.0, 1: 9.0, 2: 9.0})),
 Row(label=4.0, features=SparseVector(3, {0: 9.1, 1: 9.1, 2: 9.1}))]
Inference: There is one other method to have a sneak peek of the dataset i.e. the head function which returns all the column names with their corresponding values. Notice that features are being returned as SparseVector.
dataset_kmeans.printSchema()
Output:
root
 |-- label: double (nullable = true)
 |-- features: vector (nullable = true)
Inference: If one wants to know what how the Schema of the dataset looks like then they can use the print schema() function. Here it has returned two columns one is the label and the other is the features column in the vector format.
Implementation
As we know that we don’t predict any labels in K-means instead we used to make a cluster to segment the data in the best possible way, but here comes the complex part as there are no 100% optimal ways to find the best number of clusters either one should have the amazing domain knowledge or elbow method, sometimes for the easier problem, we can give a shot to hit and trial method, that’s what we are gonna do here:
- When clusters = 2 i.e. when the dataset will be separated into two groups.
- When clusters = 3 i.e. when the dataset will be separated into three groups.
When clusters = 2
kmeans_2_cluster = KMeans().setK(2).setSeed(1)
Inference: Above code is the way how we set the number of clusters from the set() method. Note that we are using the settled() function as well as KMeans to choose the random number of data for each group so if we set an appropriate number then after each time it will execute it will take the same random distribution.
first_model = kmeans_2_cluster.fit(dataset_kmeans)
Inference: Now we are fitting the KMeans model i.e. training the model based on the available dataset. Note that we are feeding the complete data for training as we don’t have the labels hence there is no point in splitting the dataset.
predictions_first_model = first_model.transform(dataset_kmeans)
predictions_first_model.show()
Output:
Inference: Now it’s time to make some predictions (here let’s make a relevant cluster based on the input data) and for that, we are using the transform method on the whole dataset. When we saw the output we can see that there are two groups one is tagged as 1 and another one as 2.
from pyspark.ml.evaluation import ClusteringEvaluator
evaluator = ClusteringEvaluator()
Inference: Building the model is one thing and testing and evaluating it is more important as it will allow us to consider whether this model is good to go or need any changes. Hence, we are using the clustering evaluator object to get some Kmeans evaluation methods.
silhouette_2_clusters = evaluator.evaluate(predictions_first_model)
print("Silhouette evaluation results = " + str(silhouette_2_clusters))
Output:
Silhouette evaluation results = 0.9997530305375207
Inference: The silhouette is a statistical method that checks upon the consistency within the clusters of data. Its coefficient value ranges between [-1,1] the more positive the coefficient the better the more the data point is within that particular cluster.
two_centroid = first_model.clusterCenters()
print("Center of clusters: ")
for c in two_centroid:
    print(c)
Output:
Center of clusters:
[9.1 9.1 9.1]
[0.1 0.1 0.1]
Inference: To get to know about the center/centroid of each cluster is very important as they help us to know how separable they are from each other. In the output, one can see that there are two clusters as we choose the number of K (clusters) as 2.
When clusters = 3
kmeans_3_clusters = KMeans().setK(3).setSeed(1)
second_model = kmeans_3_clusters.fit(dataset_kmeans)
predictions_second_model = second_model.transform(dataset_kmeans)
Inference: Now it’s time to check how our model will perform when we choose to have three clusters and for that the process is almost the same here we will set the K value as 3 i.e. 3 groups then we will fit/train the complete data (the reason I have already discussed) at the last for drawing predictions transform method comes to rescue.
from pyspark.ml.evaluation import ClusteringEvaluator
evaluator = ClusteringEvaluator()

silhouette_3_clusters = evaluator.evaluate(predictions_second_model)
print("Silhouette evaluation results = " + str(silhouette_3_clusters))
Output:
Silhouette evaluation results = 0.6248737134600261
Inference: Here if we will compare the Silhouette distance when clusters were 2 then one can conclude that we should go with 2 clusters only as it is giving us better results.
three_centroid = second_model.clusterCenters()
print("Center of clusters: ")
for c in three_centroid:
    print(c)
Output:
Center of clusters:
[9.1 9.1 9.1]
[0.05 0.05 0.05]
[0.2 0.2 0.2]
Inference: The sole purpose of building the model with a 3-K value is to compare both of them and choose the best possible K value here we can see a three-centroid value.
Conclusion to K-Means Clustering
We are in the endgame guys 🙂 In this section, we will go through everything we did soo far in this article in terms of practical implementation. From the introduction to the K-means algorithm and its way of operating, we went through comparing two different cases and chose the best one.
- Firstly we discuss how the K-Means algorithm works and then set up a PySpark platform so that we could implement it and get a hands-on experience.
- Then we read the official dataset from the PySpark documentation example and also analyze the Schema and got a basic understanding of the same.
- Then at the last, we build the K-means model on two cases (when clusters are 2 and 3) and after seeing the evaluation results we concluded that for this particular data when clusters were 2 it performed better.
Here’s the repo link to this article. I hope you liked my article on Introduction to tree methods in MLIB. If you have any opinions or questions, then comment below.
Connect with me on LinkedIn for further discussion on MLIB or otherwise.
The media shown in this article is not owned by Analytics Vidhya and is used at the Author’s discretion.


