Complete Guide to Run Machine Learning on Spark using Spark MLLIB
This article was published as a part of the Data Science Blogathon.
Introduction
The digital transformation has given rise to the release of massive amounts of data each second, and companies’ servers are not that powerful to bear the load. It is tough to store and process a massive amount of data and more difficult when we have real-time or streaming data. When Hadoop came into the picture, then the companies need to use MapReduce, which only works in Java and needs to write many lines of code. After that, Spark, a live data processing tool, was released that helps to process live data and apply various machine learning and analytics on top of it. In this article, we will learn about Spark MLLIB, a python API to work on spark and run a machine learning model on top of the massive amount of data.
Brief Overview of Spark
Spark is an open-source, distributed, unified analytics engine used for real-time data processing and acts as a faster cluster computing framework. Spark is popular due to its in-memory computation power, which increases the data processing speed and makes it capable to handle huge amounts of data. Apache spark is an advanced version of Hadoop because Hadoop is a framework that uses map-reduce for the processing, which reads the data from disk and forms key-value pair so if we read data from disk, process it, and write it again to disk so it is very time-consuming and spark does all things in main memory means data store in RAM was to compute time reduces and operations happen very fast.
Spark is built on Scala, an advanced Java version that runs on JVM. Spark provides high-level APIs through which we can code and use spark in any language, including Java, Python, Scala, R, etc. And working with spark through Python is known as Pyspark.
What is Spark MLLIB?
MLLIB stands for Machine learning library in Spark. This library aims to make practical machine learning scalable and easy to implement. It provides tools to implement all machine learning algorithms, including Regression, classification, dimensionality reduction tools, transformation, feature extraction, pipelines (tunning), save and load algorithm, and utilities for linear algebra and statistics.
When we talk about spark MLLIB so, it has a dataframe-based API, and as of spark 2 onwards, the RDD-based API entered the maintenance phase, and the primary ML API is now a dataframe-based API that is a spark. ml.0
Spark MLLIB Tools
Spark provides a different set of machine learning tools to perform different tasks and take different actions.
- Machine Learning algorithms – It provides tools and techniques to implement Regression, Classification, clustering, and collaborative filtering.
- Featurization – Tools for feature extraction, transformation, dimensionality reduction, and feature selection.
- Pipelines – tools for constructing, evaluating, and tuning ML pipelines.
- Persistence – save and load algorithms, models, and pipelines.
- Utilities – Linear algebra, statistics, data handling
Spark MLLIB Data Types
Spark supports different data types. Spark MLLIB supports local vectors and Matrices stored on a single machine and distributed matrices. So it supports many data types packed with one or many RDDs.
- Local Vector – MLLIB supports two types of local vectors, which are dense and sparse. A labeled point is a local vector, either dense or sparse, that is associated with a label or response. For example, in binary classification, the label should be either 0 (negative) or 1 (positive).
- Local matrix – It has integer type row, column indices, and double type values stored in a single machine.
- Distributed matrix – It has long-type row and column indices and double-type values. It is stored in a distributed manner in one or more RDD.
Machine learning Pipelines
When we talk about ML pipelines, it is all about understanding different stages, including estimator, evaluator, transformer, etc. Machine learning pipelines provide uniform high-level APIs built on top of data frames. It is used to create and tune practical machine learning pipelines. It is mainly used with structured data.
- Dataframe – A dataframe from spark SQL is used as a machine learning dataset. It holds a variety of data types text, feature vectors, labels, etc.
- Transformer – A transformer is an algorithm that transforms one algorithm into another dataframe.
- Estimator – An estimator is an algorithm that can be fit on a dataframe to produce a transformer.
- Pipeline – A pipeline integrate multiple transformers and estimators to specify a machine learning workflow.
- Evaluator – It will evaluate the outcome of the model.
Running Pyspark on Jupyter Notebook and Google Colab
We now know about spark and why today it is used by each organization to process their data. To get hands-on practical knowledge about spark let up first install and set up complete spark on our system. First, we are installing Pyspark on the Jupyter notebook.
- Step-1) Install Anaconda – If you have Anaconda, then good else, then download and install it using the official link.
- Step-2) Install JDK 1.8.0 – As we studied, spark works on top of JDK and JVM, you need to have JDK installed in your system if you want to work with a spark on a local Jupyter notebook.
- Step-3) Download Spark – From the official spark website we have to download a tar file of spark and extract it.
- step-4) set environment variable – You have to set a Path and environment variable as shown below, and you will be good to go with spark.
#ENVIRONMENT VARIABLE
SPARK_HOME = C:sparkspark-2.3.1-bin-hadoop2.7
HADOOP_HOME = C:sparkspark-2.3.1-bin-hadoop2.7
#PATH VARIABLE
C:sparkspark-2.3.1-bin-hadoop2.7bin
Running Spark on Google Colab
Running Pyspark on Google colab is very simple; you must visit the collab website and create a new Colab Notebook. In the first cell run the below PIP command to install Pyspark.
! pip install pyspark
As the cell successfully runs and you are good to go to use Pyspark for further practicals.
Basics of Pyspark
We have installed PySpark on our system so before directly using MLLIB and developing a machine learning model using Spark, let us refresh some basic Pyspark and how it works with data frames and process data. Pyspark is a tool through which we can work with spark using Python as a programming language. Let us give some hands-on practice to Pyspark.
Create Spark context
spark context is the main entry to use the spark feature. It will create a connection with a spark cluster and can be used to create RDDs, accumulators, and broadcast variables on that cluster. Only one spark context may be active per JVM. While creating spark context you have to set the app name and a master name, which we have defined as local. And we create an object of spark context. Without defining any configurations also, you can create a spark context.
from pyspark import SparkContext, SparkConf
conf = SparkConf().setAppName("pyspark_practice").setMaster("local")
sc = SparkContext(conf=conf)
To see all the configurations, you can use the below command and read all the system details.
Working with Pyspark RDDs
RDD stands for Resilient distributed datasets. An RDD in spark is simply an immutable distribution of objects. Spark RDDs are the same as Pandas Dataframes. Each RDD is split into multiple partitions, which may be computed on different cluster nodes. RDD can be created in two ways by loading some external dataset like CSV, excel files, or you can also create it by transforming one RDD into another.
When we have RDD (dataset) so before applying a machine learning algorithm, we perform the different tasks on data like handling missing values, dealing with categorical data, and feature scaling. And all these tasks are known as operations, and operations can be anything like sorting, filtering, summarizing, etc. In spark, operations are divided into 2 things as Transformation and Actions. First, we will create one RDD and learn different operations that we can perform on it.
To create RDD parallelize function is used that accepts a list in which you can simply have a collection of numbers, strings, tuples, dictionary
names = sc.parallelize(['Shubham','rishi','prayag','shivam','rahul','Madhav','Nihal','sourik','Rishabh', 'Yash', 'kaushik','shivani'])
print(type(names))
The second way to create an RDD is from an external file in which we read some files by referencing its URL.
#Reading any csv file
csv_file = spark.read.csv('/content/students_placement.csv', inferSchema = True, header = True)
## Reading TXT file
#txt_file = spark.read.text("example.txt")
## Reading JSON file
#json_file = spark.read.json("sample.json", multiLine=True)
RDD Actions
Actions are used to execute the scheduled task on the dataset because when we apply the transformation, It only creates a DAG and when we act then tasks task tasks tasked display an output. We will study some popular actions used on the dataset.
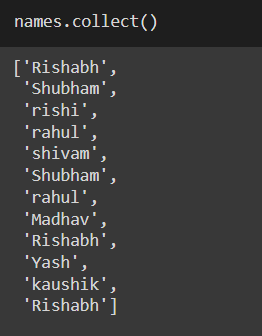
1. Collect
This is the first action that will display all values right away. It has created a list. If you will perform the transformation, then nothing will be displayed.
names.collect()
source – SS Of Code output
2. count By Value
If you want a count of a particular value in data, then you can use this action. The alternative to this function you can also use a simple count function which is also one action.
names.countByValue()
3. For Each
It is a unique operation that takes each value and applies a function to it to perform a certain task. It is used to create logs.
def f(x):
  print(x)
a = sc.parallelize([1,2,3,4,5]).foreach(lambda x: f(x))
words = sc.parallelize (["scala", "java","hadoop", "spark", "akka","spark vs hadoop","pyspark", "pyspark and spark"])
fore = words.foreach(lambda x: x.startswith('p'))
4. Take
we do not use the collect function in a production environment because it gives me complete details of data in a cluster that can collapse the memory. After all, complete data will come in memory so we use the take function to intake the required number of rows.
5. First
The first action returns the first element from an RDD.
names.first()
6. Glom
It transforms each partition into a tuple of elements. It will create an RDD of tuples so it will store 1 tuple per RDD. We use GLOM function to make each partition into a tuple. We have created a 3 partition, and when you use to collect, then it will same as 1 partition, but when you use glom function, then it will be stored in 3 partitions.
nums = sc.parallelize([1,3,5,3,4,2,5,7], 3)
nums.glom().collect()
7. Reduce
It is the same as the python reduce function, which accepts a function and reduces all the elements per a particular function. Below is an example of adding all the data using reduced action.
sample_rdd = sc.parallelize([2,4,6,8])
print(sample_rdd.reduce(lambda x, y: x+y))
7. save RDD as a Text File
To serve the resultant RDD into a text file, we use to save ait n RDD as a text file. You can specify the path where you want the RDD to be saved. This function is mainly used to save our results and analysis when working with a large amount of data.
RDD Transformations
Transformation helps us to shape our dataset. Changes are lazily evaluated because whenever we use transformation then it will create a new RDD and you can display the content of the new RDD only when you perform any action on it. It will create DAG(directed acyclic graph) and keep building the graph till you perform any action on it that is why it is called lazy. As RDD is immutable so we cannot make any change in the existing RDD so transformation takes an RDD as input and generate another RDD. we will discuss some of the most used RDD transformations.
1. Map
As the name suggests, the Map transformation maps a certain value to the elements of the input RDD. The map takes a function as a parameter and applies the function to each RDD element. For example, if we want to add 10 to each element in RDD then using MAP, in this case, will be easy and handy.
sample_rdd.map(lambda x: x+10).collect()
2. Filter Transformation
Filter transformation filters out the RDD elements according to certain conditions. It accepts a function and applies that function to each element and if the element meets the condition then added to a new RDD and creates a new RDD.
s_rdd = sc.parallelize([1,2,4,5,7,8,2])
print(s_rdd.filter(lambda x: x%2 == 0).collect())
filter_rdd_2 = sc.parallelize(['Rahul', 'Swati', 'Rohan', 'Shreya', 'Priya'])
filter_rdd_2.filter(lambda x: x.startswith('R')).collect()
3. Union Transformation
We have read the Union function in SQL and its task is the same as it accepts the 2 RDD and combines them to generate one single RDD, which is a combination of both the RDD.
union_inp = sc.parallelize([2,4,5,6,7,8,9])
union_rdd_1 = union_inp.filter(lambda x : x%2==0)
union_rdd_2 = union_inp.filter(lambda x: x%3 == 0)
print(union_rdd_1.union(union_rdd_2).collect())
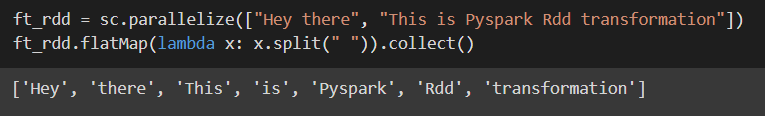
4. FlatMapTransformation
It performs the same operation as the Map operation except for the fact that flat map transformation return separate (flatter) values for each element from the original RDD.
ft_rdd = sc.parallelize(["Hey there", "This is Pyspark Rdd transformation"])
ft_rdd.flatMap(lambda x: x.split(" ")).collect()
5. Join Transformation
The operation returns an RDD with a pair of elements with the matching keys and the values for that key. In simple words, it joins two RDD based on certain keys and keeps their values in a list.
x = sc.parallelize([('Spark', 1), ('Hadoop', 4)])
y = sc.parallelize([('Spark', 2), ('Hadoop', 5)])
print(x.join(y).collect())
6. Distinct Transformation
It returns the distinct values in a specified column from an RDD.
sample_rdd.distinct().collect()
Build your first ML model using Spark MLLIB
We will learn a simple demo of developing a simple linear regression using spark MLLIB. We will walk through each step of the ML project lifecycle including preparing and processing data. We are using a simple dataset which is a student grade dataset that you can download from here.
Install all dependencies and start the spark session
spark session is the same as the spark context which is used as an entry point to start working with the dataframe and datasets which were introduced when spark 2. O was introduced.
# Start Spark Session
!pip install findspark
import findspark
findspark.init()
from pyspark.sql import SparkSession
spark = SparkSession.builder.master("local[*]").getOrCreate()
The builder method gives you access to builder APIs that you can use to configure the session. Get or create is used when you want to share a spark context.
Read Dataset
I hope that you have downloaded the dataset. And If you are working on the local Jupyter Notebook, then directly use the spark read command to read the dataset. If working on Collab, then you have to upload a file using the left navigation pane, or you can also use the below command.
from google.colab import files
files.upload()
Now you can run the spark Read CSV file function and a file path to load the dataset.
data = spark.read.csv('Student_Grades_Data.csv', header=True, inferSchema=True)
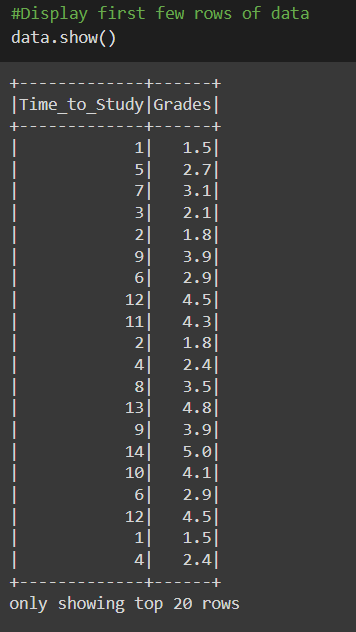
Display the data
To have a gentle look over a few rows of data we can use the show function. Apart from this, you can use the print schema function to print the data type of each column to observe what data type infer schema has set for a set column by keeping it True.
data.printSchema()
Separate the Independent columns
Now we will create the feature array by omitting the last column or dependent column of the dataset. If you remember that to train a machine learning model, we want to feed features and labels to predict a label for new features.
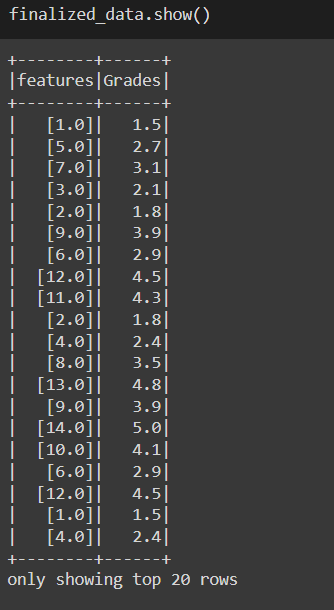
#create a feature array by omitting the last column
feature_cols = data.columns[:-1]
from pyspark.ml.feature import VectorAssembler
vect_assembler = VectorAssembler(inputCols = feature_cols, outputCol="features")
#Utilize Assembler created above in order to add the feature column
data_w_features = vect_assembler.transform(data)
Vector assembler is a transformer that assembles all the features into one vector from multiple columns that are of type double you can also observe in the below-given figure. Now select only the feature and label to create the machine learning model.
finalized_data = data_w_features.select("features","Grades")
finalized_data.show()
Train-Test Split
Now we will split the prepared final data into two sets train set and a test set where the train set is used for model training, and the test set is used to evaluate the model, like how it is performing on unknown features.
train_dataset, test_dataset = finalized_data.randomSplit([0.7, 0.3])
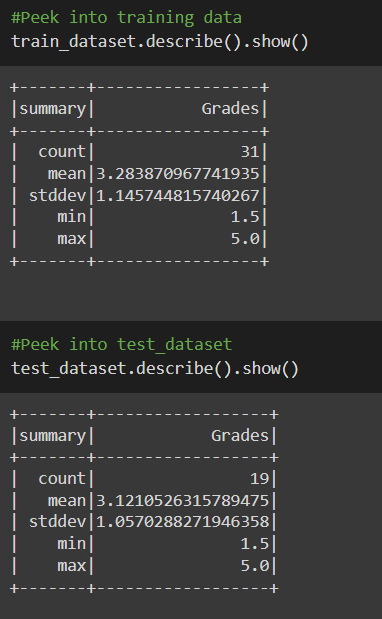
You can also statistically analyze the dataset like in Pandas we directly use to describe the function. The same can be used with Spark also.
#Peek into training data
train_dataset.describe().show()
Linear Regression Model Creation
The process with Spark MLLIB is the same as you perform with sciket-learn, which is first importing the model and creating its object defining the parameters.
#Import Linear Regression class called LinearRegression
from pyspark.ml.regression import LinearRegression
LinReg = LinearRegression(featuresCol="features", labelCol="Grades")
Model training and testing
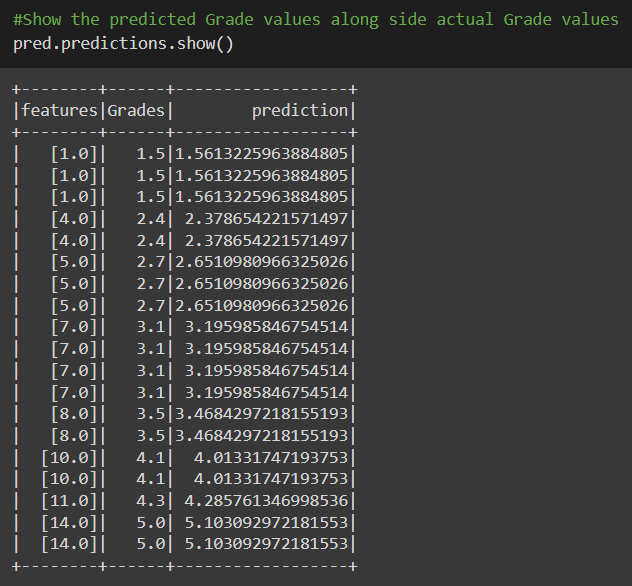
In model training, the input data and some correct labels are fed to a model, which is implemented using the fit function. And to find out the predictions on the unknown dataset (test dataset) evaluate function is used.
#Train the model on the training using fit() method.
model = LinReg.fit(train_dataset)
#Predict the Grades using the evulate method
pred = model.evaluate(test_dataset)
Print coefficients and Intercept
A simple linear regression model simply built a straight line, and it calculates the coefficients using covariance and variance. So to display the coefficients and intercept, you can simply use the below command.
#Find out coefficient value
coefficient = model.coefficients
print ("The coefficient of the model is : %a" %coefficient)
#Find out intercept Value
intercept = model.intercept
print ("The Intercept of the model is : %f" %intercept)
Evaluate Model using Metric
The error is the difference between the actual and predicted value, and metrics help us to evaluate our model in a good sense like what is percent accuracy of the model, where it performs best and worst, etc. we have calculated MAE, MSE, RMSE, and R squared.
#Evaluate the model using metric like Mean Absolute Error(MAE), Root Mean Square Error(RMSE) and R-Square
from pyspark.ml.evaluation import RegressionEvaluator
evaluation = RegressionEvaluator(labelCol="Grades", predictionCol="prediction")
# Root Mean Square Error
rmse = evaluation.evaluate(pred.predictions, {evaluation.metricName: "rmse"})
print("RMSE: %.3f" % rmse)
# Mean Square Error
mse = evaluation.evaluate(pred.predictions, {evaluation.metricName: "mse"})
print("MSE: %.3f" % mse)
# Mean Absolute Error
mae = evaluation.evaluate(pred.predictions, {evaluation.metricName: "mae"})
print("MAE: %.3f" % mae)
# r2 - coefficient of determination
r2 = evaluation.evaluate(pred.predictions, {evaluation.metricName: "r2"})
print("r2: %.3f" %r2)
Conclusion
Spark is a big data processing engine that helps us to work with a huge amount of data in real time. Machine learning is one kind of service that spark supports through which we can analyze and build an ML-based system on a large volume of data. In this article, we have studied Spark Machine learning, Pyspark, and Pyspark MLLIB. Let us take a few key takeaways from the article that you should remember related to spark and MLLIB.
- Spark MLLIB is integrated at the top of the spark, which eases the development of large-scale machine learning algorithms.
- RDD is schema-less. As we have seen, to create an RDD, we can pass any combination as a tuple, dictionary, and combination of both so it is schema-less.
- RDD can be run in 2 modes as Global and local mode
- Spark MLLIB pipeline is similar to Python sciket-learn library where you need first to import model and create object-defining parameters.
- The practical use case of MLLIB is fraud detection, Marketing optimization, Advertising optimization, building recommendation engines, etc.
Thank You Note
- I hope it was easy to cope with each step we discussed in the article. If you have any queries, please post them in the comment section below or connect with me.
- Connect with me on Linkedin.
- Check out my other articles on Analytics Vidhya and crazy-techie
The media shown in this article is not owned by Analytics Vidhya and is used at the Author’s discretion.
I am a final year undergraduate who loves to learn and write about technology. I am a passionate learner, and a data science enthusiast. I am learning and working in data science field from past 2 years, and aspire to grow as Big data architect.


