Get to Know All About Evaluation Metrics

Sanjay Lalwani 30 Sep, 2022 • 6 min read

This article was published as a part of the Data Science Blogathon.

Introduction

Evaluation metrics are used to measure the quality of the model. Selecting an appropriate evaluation metric is important because it can impact your selection of a model or decide whether to put your model into production. 

Evaluation Metrics

The mportance of cross-validation: Are evaluation metrics enough? Read more here.

Evaluation Metrics for Classification

To understand Classification evaluation metrics, let’s first understand the confusion metric,

Confusion Metric:

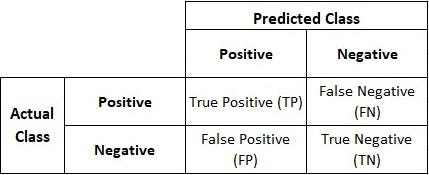
  • It is a tabular data format used to visualize classification problems’ performance.
  • It is also known as Error Matrix and is used for Supervised Classification algorithms, typically for Binary-Classification algorithms, though it can be used for any classification algorithm.
  • It compares how your prediction has fared in comparison to actual values.

We will take the Youtube Kids example, where you are trying to classify whether a video is Kids safe or not. Whether it is fine to watch a particular video or not.

Confusion Matrix has 4 values,

True Positive (TP):

  • The model has predicted a positive, and the actual value is also positive.
  • A video is predicted as Kidsafe, and actually, it’s Kidsafe.

True Negative (TN):

  • The model has predicted a negative, and the actual value is also negative.
  • A Video is predicted as not Kidsafe, and in reality, it’s not Kidsafe.

False Positive (FP):

  • The model has predicted a positive, but the actual value is negative.
  • They are also known as Type I error.
  • A video is predicted to be Kidsafe, but it’s not Kidsafe. It may be violent, or it has adult content which is not good for Kids.

False Negative (FN):

  • The model has predicted a negative, but the actual value is positive.
  • They are also known as Type II errors.
  • A video is predicted as not Kidsafe; in reality, it’s Kidsafe. It may be a cartoon, but still, it is marked as violent.

Now let’s try to understand different evaluation metrics,

1. Accuracy:

  • Accuracy represents the number of correctly classified data instances over the total number of data instances.
  • If data is not balanced, it will not be a good evaluation metric, as Accuracy will be biased for classes with a higher number of counts. We can opt for Precision or Recall

Accuracy = (TP + TN) / (TP + FP + FN + TN)

2. Precision:

  • How many of the correctly predicted cases turned out to be positive?
  • It is useful when a False Positive is a major concern than a False Negative.
  • Precision should be as high as possible.

Precision = TP / (TP + FP)

3. Recall:

  • Also known as Sensitivity or True Positive Rate
  • How many of the actual positive cases were able to predict correctly with our model
  • It is more useful when a False Negative is a major concern than a False Positive.
  • Recall should be as high as possible.

Recall= TP / (TP + FN)

4. F1 Score:

  • It is the harmonic mean of Precision and Recall.
  • F1 Score balances both Precision & Recall; if any one is small, the F1 Score will also be smaller. That’s what makes it different than Accuracy.

F1 Score = ( 2 * Precision * Recall) / (Precision + Recall)

5. Specificity:

  • How many of the actual negative cases could predict correctly with our model?

Specificity = TN / (TN + FP)

6. AUC-ROC Score:

  • It stands for Area Under the Curve – Receiver Operating Characteristics
  • ROC graph is used to evaluate the classification model performance for the different threshold values.
  • AUC is the measure of the ability of a classifier to distinguish between classes.
    • If AUC = 1, then the classifier perfectly differentiates the classes.
    • If 0.5<AUC<1, then the classifier has a high chance of differentiating between classes.
    • If AUC=0.5, then the classifier is not differentiating Positive and Negative classes well.

Precision-Recall Tradeoff: It is expected to have both Precision and Recall high percentages. But if you go for Higher Precision, your Recall lowers, and vice versa. Ex. For Youtube Kidsafe, False Positive is a concern, we don’t want kids to see Violent videos, but it may cause missing some Kidsafe videos like cartoons.

Evaluation Metrics for Regression

1. Mean Absolute Error(MAE):

  • Mean Absolute Error is the sum of the predicted values minus the true values divided by the number of predicted values.


  • This evaluation metric is very helpful if you expect outliers in your dataset.

2. Mean Squared Error(MSE):

  • Mean Squared Error is the sum of the square of the difference between predicted values & the true values divided by the number of predicted values.

3. Root Mean Squared Error(RMSE):

  • Root Mean Squared Error is the root of the sum of the square of the difference between predicted values & the true values divided by the number of predicted values.


  • This evaluation metric is beneficial if you expect outliers in your dataset.
  • If the dataset has more outliers, RMSE becomes larger than MAE.

4. R squared:

  • R-Squared is a statistical measure presenting the proportion of the variance for a dependent variable that is explained by one or more independent variables in a regression model.
  • R-Squared is the one minus sum of squares of residual divided by the total sum of squares.


  • R-Squared is used to find the goodness of the best fit line.
  • The problem with R-Squared is, that it never decreases even if we add a new redundant variable. R-Squared value either stays the same or increases.

5. Adjusted R-Squared:

  • Adjusted R-Squared solves the problem by adding a number of the independent variables (k) in the denominator.
  • The formula of the Adjusted R-Squared is
Evaluation Metrics

where N = number of data points in the dataset

p = number of independent variables.

Evaluation Metrics for Unsupervised — Clustering

1. Rand Index or Rand measure:

  • The Rand Index computes a similarity measure between two clusters by considering all pairs of samples and counting pairs assigned in the same or different clusters in the predicted and actual clusterings.
  • The formula of the Rand Index is:
Evaluation Metrics
  • The RI can range from zero to 1, a perfect match. You can compare Rand Index to Accuracy in Supervised Binary Classification. Check the below calculations,
  • The Rand Index drawback is that it assumes that we can find the ground-truth cluster labels and use them to compare the performance of our model, so it is much less helpful for pure Unsupervised Learning tasks.

2. Adjusted Rand Index:

  • The adjusted Rand index is the corrected-for-chance version of the Rand index.
  • The raw RI score is then “adjusted for chance” into the ARI score using the following scheme:
Evaluation Metrics
  • The adjusted Rand Index is thus ensured to have a value close to 0.0 for random labeling independently of the number of clusters and samples and exactly 1.0 when the clusterings are identical.
  • The adjusted Rand Index can yield negative values if the index is less than expected.

Conclusion

An evaluation Metric is used for assessing the correctness of models. We have multiple evaluation metrics, but selecting the correct evaluation metrics is crucial. The key factor for selection is the data and the type of problem we are trying to solve.

Hopefully, this article helps you to select the correct evaluation metrics for your machine learning problem.

The media shown in this article is not owned by Analytics Vidhya and is used at the Author’s discretion. 

Sanjay Lalwani 30 Sep 2022

Frequently Asked Questions

Lorem ipsum dolor sit amet, consectetur adipiscing elit,

Responses From Readers

Clear

Related Courses

Machine Learning
Become a full stack data scientist