From Numbers to Insights: Population vs. Sample with Real-World Examples
Introduction
Imagine that you’re the school prefect and are asked to collect data from every single student in high school, but you’re limited by time and helping hands. What would you do? The most straightforward settlement would be to collect data from a subset of students belonging to each grade and then intuitively draw conclusions. This might work well with the limited scope of your task, but what happens when you need to do it for an entire school or multiple schools? How would you be sure that the sample accurately represents the population you are interested in studying?
Start exploring the statistical world, understanding these concepts, and the sampling process to have all the answers. This is why, in this article, we will explore population vs. sample, the basic concepts and definitions of a population and sample, and how they are used to infer data and draw insights.
Table of contents
- Introduction
- What is Population?
- What is Sample?
- Population Vs. Sample Formulas
- Population Parameter vs. Sample Statistic
- Similarities Between Population and Sample
- How to Collect Data for Samples?
- Sampling Errors and Biases
- Importance of Sample Size
- Determining Sample Size
- What is Inference?
- How Population vs. Sample Are Used in Statistical Inference?
- Example of Statistical Inference Using Population and Sample Data
- Real-world Examples of Sample Size Determination in Research Studies
- Conclusion
- Frequently Asked Questions
What is Population?
In research or statistics, the population is the entire group of individuals or objects under consideration. These items possess a particular characteristic or feature of interest. However, in most statistical analysis situations, examining the entire population is not feasible or necessary, especially when the population size is large. This is where the idea of a “sample” comes into play.
Real-World Examples
For example, you’re a recruiter and post an advertisement for a software engineer job. Then all software engineers eligible for the job constitute the population. Or all registered voters in a particular state constitute the population during elections.
Generally, a population is lesser relevant for a researcher or statistician because it is humanly impossible to gather data from, study, and interpret features of a large population. In that case, they use a “representative fraction” of the population, known as a sample. The researchers then study this sample and collect all necessary information to make inferences about the entire population. Moreover, this is the primary difference between the population vs sample.
What is Sample?
Conversely, a sample is a portion of the population selected for observation or analysis. Due to the massive size of the population, a smaller portion of the population must be taken as a representative. Therefore, researchers typically select a representative sample from the population to make inferences about the population as a whole.
Real-world Example
In the example mentioned above, a sample could be software engineers with more than 5 years of experience or prior work experience in some company. From the pool of voters, a sample could be all first-time voters.
The main difference between a population and a sample is that the former represents the entire group of interest— for example, all software engineers constitute the population. While the latter is only a portion of that group— software engineers that have more than 5 years of experience.
Moreover, samples are selected in such a way that they are the most representative, i.e., they represent the population attributes most accurately. Samples are used in various research studies, including surveys, experiments, and observational studies. In surveys, samples are used to collect data on individuals’ opinions, behaviors, and attitudes in a population.
On the other hand, they are used to test the effects of a particular intervention in experiments.
Population Vs. Sample Formulas
Now that you conceptually understand the difference between population and sample, it is vital to move forward and see how it impacts the standard formulas.
| FORMULA | POPULATION | SAMPLE |
| Variance |  |  |
| Standard Deviation |  |  |
| Mean Absolute Deviation |  | |
| Mean |  |  |
Population Parameter vs. Sample Statistic
Population parameters are numerical values that describe a whole population. These values are utilized in quantitative research as proxies for numerical summaries to make inferences about the population. For example, the population mean (µ)— is the average of the whole population. Other examples of population parameters include the population standard deviation (σ), the population proportion (p), and the population correlation coefficient (ρ).
On the other hand, sample statistics are also numerical summaries that describe the sample. These values are later used to approximate the population parameters if they fit the population well. For example, the sample mean (x̄) is a statistic that describes the average value of a variable in a sample. Other examples of sample statistics include the sample standard deviation (s), the sample proportion (p̂), and the sample correlation coefficient (r).
Often, population parameters are unknown, so sample statistics are used to approximate them. The estimate’s accuracy depends on the sample size and the sample’s representativeness.
Similarities Between Population and Sample
While population vs. sample are two separate elements of research and statistics, there are some similarities.
- For starters, both involve a “group of people/items/events” that share a common interest or characteristic.
- Both population and sample are used in statistical inference, which involves making generalizations.
- Both population and sample can be described using various statistics, such as mean, standard deviation, proportion, etc.
How to Collect Data for Samples?
There are numerous ways to collect data. However, the techniques and goals can vary based on the data collection requirements. Here are some standard sampling methods for collecting data for sample analysis.
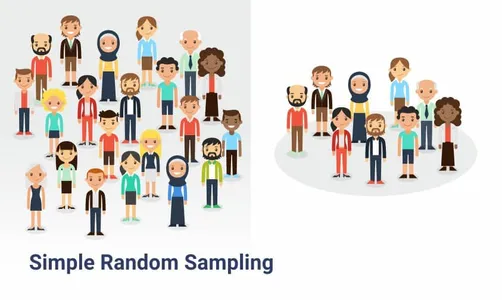
- Simple Random Sampling
Random sampling is the most standard probabilistic approach to data collection. It is a method where individuals or items are randomly selected from the population so each has an equal chance of being selected. Random sampling reduces the potential for bias that may arise when some elements are preferred over others.
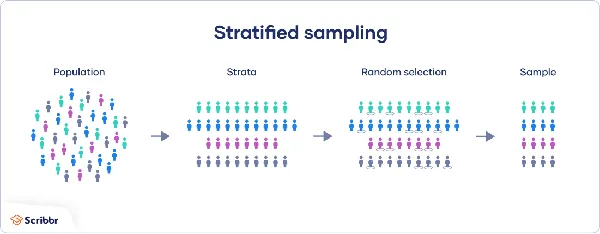
- Stratified Sampling
In this sampling method, researchers divide the population into sub-strata or sub-populations. This is done based on some chosen characteristics, which could be age, income, etc. Then, a random sample is selected from each stratum in proportion to its size. This method ensures that the sample represents the diversity of the population and allows for subgroup analyses.
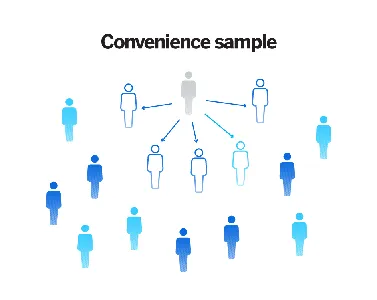
- Convenience Sampling
Convenience sampling is a non-probabilistic approach in which individuals or items are selected based on convenience or availability. For instance, selecting the first 100 customers for a discount who enter a showroom. This method is less rigorous than random sampling and may introduce bias, but it can be helpful in exploratory or preliminary studies.
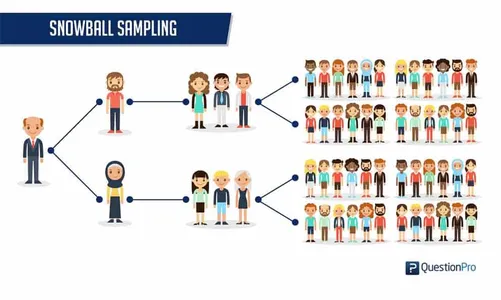
- Snowball Sampling
Snowball sampling is a method in which individuals or items are selected based on referrals from others in the sample. Such a method becomes valid when the population is hard to reach or certain features of interest are rare.
Some other forms of data collection include experiments, surveys, observation, ethnography, secondary data collection (dealing with previously collected data), archival research, etc.
Sampling Errors and Biases
Sampling biases and errors are the primary errors that occur during data collection.
Sampling Errors
Sampling errors arise when a sample is not the best “representative” sample. These errors arise naturally as samples are always subject to random variation, and there can always be some degree of uncertainty. However, the magnitude of such errors depends on the sample size and the variability of the population. Generally, smaller populations are more likely to give sampling errors.
Sampling Bias
On the other hand, sampling bias occurs from a systematic deviation from randomness in the sample selection process. Simply put, when some sample elements are more likely to get selected than others or when the sampling method itself is flawed. Examples of sampling biases include selection bias, measurement bias, and response bias. Such biases can degrade the accuracy of analysis as they can result in over or under-representation of certain features or subgroups in the sample.
Appropriate sample size can significantly reduce sample errors. However, they do not explicitly impact bias. Let’s read on to see how.
Importance of Sample Size
While it may not appear significant, determining the sample size is crucial while proposing the study. Too much sample size is absolutely unnecessary and deters the accuracy of your analysis. It can also cause a lot of inconvenience for the researchers. At the same time, a tiny sample may not be enough to give you a precise idea about the population characteristics. Here are some reasons to be careful when selecting an appropriate sample size.
Precision
Generally speaking, precision increases with the sample size. This is because larger samples reduce the sampling error and randomness, leading to a better estimate of the population parameters.
Statistical Power
Statistical power refers to the probability that the test correctly rejects the null hypothesis. In simple words, it is the probability of a “true” outcome. A larger sample size increases the statistical power of a study, making it more likely to detect a true effect or difference if one exists.
Cost and Feasibility
While it is not imperative to your outcome, it is to your study. If you have a limited budget, it would be smart to choose a smaller sample size. Larger sample sizes may be more costly and time-consuming to collect and may not be feasible in certain settings or populations.
But don’t worry. The appropriate sample size can be computed using statistical methods or software, depending on your requirements.
Determining Sample Size
As you must know by now, that appropriate sample size is vital to your study, this section briefs you on how to determine it. Sample size determination depends on population size, confidence interval, and standard deviation. Let’s learn about each step in detail.
Confidence Interval
Confidence intervals are intervals of numerical values that measure the extent of uncertainty (equivalently, certainty) in a sampling distribution. This interval tells whether a statistic can be confidently used to approximate the parameter. Simply put, if the value lies within this “confidence interval,” it is accepted confidently!
Confidence Level
It is the percentage of probability that the confidence interval would contain the actual population parameter. For example, a confidence level of 95% would imply that the population parameter is contained in at least 95 samples out of the 100 drawn samples.
As a general rule of thumb, if your sample is large enough, you need a smaller confidence interval for a given confidence level or the more confident you can be about your findings.
Standard Deviation
Standard deviation gives a measure of variability or distribution of the data points from the mean. Knowing the extent of deviation helps you calculate a sample size such that there is little to no variation.
Population Size
This is probably the most obvious factor affecting the sample size. Having a close estimate of the population size, especially when it’s a small population, helps you deal with a relatively small group of people as the representative sample.
Steps to Calculate the Sample Size
- Estimate the population size.
- Determine the confidence interval.
- Decide a confidence level.
- determine the standard deviation. As a general rule, a standard deviation of 0.5 is a safe option.
- Find the Z-score (Critical value) of the confidence level.
- Use the formula mentioned below to determine the sample size.
What is Inference?
The process of drawing conclusions, or, simply put, inferring the results of statistical analysis, is called inference. The process aims to draw conclusions about a population parameter, equivalently the population, based on the information received about a sample. It is important in a wide range of fields, including social sciences, engineering, business, and health sciences. There are many types of statistical inferences, some of which are listed below.
- Confidence interval
- Pearson correlation
- Bi-variate regression
- Multi-variate regression
- ANOVA
- Chi-square statistics and contingency tables.
How Population vs. Sample Are Used in Statistical Inference?
As you know, statistical inference is used to infer a population’s properties using the data available on the sample; the sample is utilized to a greater extent. It is often impossible to observe or measure parameters about the entire population, which is why you need to ensure that all samples are representative and sample statistics are a good approximation of the parameters.
For example, you may calculate the sample mean based on the sample data or test a hypothesis about the corresponding population parameter to see if the sample statistic is a good approximation.
Example of Statistical Inference Using Population and Sample Data
Consider a sample of 10th graders in your area and collect data on their board exam scores. Now, using this data, you can calculate the sample mean, sample standard variance (or variance), etc. Using inferential statistics, you can scale these inferences to estimate and test hypotheses about the whole population, i.e., 10 graders in the entire state/country, based on your sample data analysis.
Real-world Examples of Sample Size Determination in Research Studies
Researchers and statisticians often indulge in sample size determination to plan and propose the study. Some real-world examples of industries wherein studies require you to focus on selecting the most appropriate sample and size:
Medical Research
In almost all clinical trials, samples are carefully selected, and their size should be large enough to highlight the differences between treatments and control groups. Moreover, the sample size should bring reasonable confidence, as drug trials are some of the most vital research endeavors.
Political Polling
Surveying voters is another practical application of sample size determination. Here, the sample should be representative enough to provide accurate information on supporters of a particular political party.
Market Research
Sample size determination is a vital aspect of market research as it is a great way to understand consumer behavior at scale by studying only a portion of the population. It involves considerations like the level of precision, target population, expected response rate, etc.
Opinion Surveys
Opinion surveys are the most commonly used application of sample size determination. Researchers must determine an appropriate sample size by accounting for all factors, like the margin of error, population variability, and confidence intervals.
Quality Control
This is an example of an industrial application where sample size determines the quality of operations. By inspecting a representative sample of products, researchers can make inferences about the overall quality of a production batch.
Conclusion
Whether or not you’re a researcher or statistician, you must have guessed something or the other about a larger group of people by observing a much smaller one. This basic idea behind population vs. sample makes sampling a very realistic practice today. It applies to all kinds of research in almost every medical, environmental, or political field. In fact, it is one of the most fundamental statistical concepts, and if you’re planning to delve more deeply into the field, you will come across many more. To explore sampling or statistics as a field of study, you can head to Analytics Vidhya (AV).
AV is a one-stop destination for all your knowledge and career needs catering to data science, artificial intelligence, machine learning, and statistical analysis. The platform prepares you for the journey by equipping you with all necessary modern-day techniques and technologies like AI and ML. With courses like the Blackbelt program, you get one-on-one mentorship, interview guidance, and placement assistance. So without further ado, start your journey with AV.
Frequently Asked Questions
A. Sampling is frequently a more efficient and economical approach compared to studying an entire population. Employing accurate sampling methods can decrease the required number of participants, resulting in time and resource savings.
A. During a census, information is gathered for every single unit within a population, such as individuals or households. Conversely, in a survey, data is only collected from a subset of the population, known as a sample.
A. The foundation of this topic rests upon three fundamental aspects of statistics: probability theory, sampling distributions, and statistical inference. Various methods are employed in the process of inference, which encompasses statistical modeling, data-driven strategies, and the incorporation of designs and randomization in analyses.


