Top 20 Data Visualization Examples
Introduction
You must have heard the famous saying, “A picture is worth a thousand words.” Have you ever wondered why is that? It is because they say a lot without actually saying anything. In today’s data-driven world, the quote holds more value than ever. Data visualization is an art that goes beyond numbers and statistics, giving data life and turning it into engaging visual stories. The stories buried in the data are revealed by a symphony of hues, forms, and patterns where each component dances harmoniously. It serves as a beacon of clarity in our digital age, where information overloads our senses, guiding us through the complexity and elegantly and precisely revealing insights.
So come along as we explore the world of data visualization, where data is transformed into works of art, and knowledge is revealed via every brilliant visual decision.
Table of contents
- Introduction
- What is Data Visualization?
- Benefits of Using Data Visualization for Analysis and Communication
- Types of Data Visualizations
- Charts and Graphs
- Infographics and Dashboards
- Maps and Geographic Visualizations
- Network Visualizations
- Time Series Visualizations
- Interactive Visualizations
- Data Visualization Examples
- 1. Bar Chart – Sales Performance
- 2. Line Chart – Stock Market Trends
- 3. Pie Chart – Market Share
- 4. Scatter Plot – Relationship Analysis
- 5. Histogram – Age Distribution
- 6. Infographic – Climate Change Impact
- 7. Dashboard – Sales Analytics
- 8. Choropleth Map – Population Density
- 9. Network Graph – Social Connections
- 10. Gantt Chart – Project Timeline
- 11. Heat Map – Website User Behavior
- 12. Interactive Data Visualization – World Happiness Index
- 13. Proportional Symbol Map – Air Pollution Levels
- 14. Node-Link Diagram – Social Media Connections
- 15. Timeline Chart – Historical Events
- 16. Interactive Calendar Chart – Employee Leave Schedule
- 17. Interactive Sankey Diagram – Energy Flow
- 18. Word Cloud – Sentiment Analysis
- 19. Streamgraph – Website Traffic Sources
- 20. Interactive Tree Map – Product Sales by Category
- Conclusion
- Frequently Asked Questions
What is Data Visualization?
The graphic depiction of data and information is known as data visualization. Converting unstructured data into visual representations like maps, charts, graphs, and infographics helps users comprehend the data’s patterns, trends, and relationships.
Benefits of Using Data Visualization for Analysis and Communication
Data visualization offers many advantages for analytical and communication purposes by utilizing graphical components, charts, and interactive features.
- Visual representations make it easier for people to understand complex datasets quickly.
- Visualizations make it possible to spot patterns, trends, and correlations that may go unnoticed while analyzing vast volumes of raw data.
- Users can better understand opportunities and possible hazards through visualizations like dashboards and infographics.
- Visualizations make it simpler to engage stakeholders and convey all the information in a fraction of the time it could take to read out entire statistical summary reports.
Types of Data Visualizations
There are numerous data visualizations, including charts, graphs, pie charts, scatter plots, bubble charts, histograms, and more. We’ll explore them briefly in the following section.
Choosing the Correct Visualization for the Data
Selecting the appropriate visualization for your data is crucial to communicate insights effectively. Consider the following factors when choosing a visualization:
- Data Type: Decide whether your data are numerical, categorical, chronological, or spatial. Different data types are better suited for certain visualization styles.
- Analytical Goal: Think about the objective of your research. Are you attempting to demonstrate contrasts, trends, distributions, or connections? Different visualization techniques succeed in various fields.
- Stories Demand: Think about the narrative you want your data to tell.
Knowing your target audience and the environment in which the visualization will be presented. Pick a format that fits their level of experience and familiarity.
Charts and Graphs
Bar and Column Charts
Bar and column charts commonly compare categorical data or display frequency distributions. For example, a bar chart can be used to compare the sales performance of different products in a retail store or display the distribution of customer feedback ratings for a service.

Line and Area Charts
A line chart displays data points connected by lines, visually representing the progression and fluctuations over a specific period. For instance, a line chart can illustrate a company’s sales growth over several years, while an area chart can show the market share of different competitors in a particular industry.

Pie and Donut Charts
Pie and donut charts effectively display percentages or proportions of a whole. A pie chart divides a circle into slices, each representing a category or component of the whole.
For example, a pie chart can display the distribution of different product categories in a company’s sales. In contrast, a donut chart can show the percentage breakdown of expenses in a monthly budget.

Scatter Plots and Bubble Charts
Scatter plots help visualize the connections between two or three variables. Bubble charts, on the other hand, expand on the scatter plot concept by adding a third dimension, such as the size of the bubble, to represent an additional variable.
For example, a scatter plot illustrates the relationship between a student’s study hours and test scores. At the same time, a bubble chart can display the relationship between population size, GDP, and carbon emissions across different countries.

Box Plots and Histograms
Box plots and histograms are valuable for displaying the range and distribution of numerical data. A histogram represents the data’s frequency distribution by grouping values into bins and displaying the count or proportion in each bin.

Infographics and Dashboards
Infographics are visually appealing and informative representations of data, facts, and statistics. On the other hand, dashboards provide a comprehensive overview of data by consolidating multiple visualizations and interactive features into a single interface.
Creating Informative Infographics
More than just aesthetically appealing data, facts and figures are needed to create exciting infographics. To effectively communicate a message, content must be appropriately chosen and arranged. Complex ideas must also be made simple, and effective visual aids like charts, graphs, and icons must be used to further comprehension.
Designing Interactive Dashboards
Creating dynamic dashboards involves more than just giving a detailed overview of the data. It entails developing an intuitive user interface that enables people to explore and engage with the data, get insights, and make wise decisions.
Maps and Geographic Visualizations
Visualizing Data on Maps
Maps visually represent patterns, trends, and distributions by charting data points or grouping data into areas.
Choropleth Maps and Heat Maps
Choropleth maps provide rapid geographic comparisons using various colors or shading to indicate multiple values or categories. On the other hand, heat maps show regions with higher or lower values by using color intensity to reflect the density or power of a specific feature.
Proportional Symbol Maps and Dot Density Maps
You can utilize proportional symbol maps and dot density maps to visualize data with symbols proportional to represented values.
Network Visualizations
Visualizing Connections and Relationships
Illustrating networks or the interconnection between entities is necessary for visualizing connections and relationships. It makes it possible to comprehend intricate systems, interdependencies, and interactions between multiple components.
Node-link Diagrams and Network Graphs
Network graphs and node-link diagrams are popular ways to show connections and relationships. In node-link diagrams, nodes are represented as points or shapes, while the links or connections between them are shown as lines or edges.
Time Series Visualizations
Visualizing Data Over Time
Time series visualization help in understanding trends, patterns, and changes that occur over a certain period and requires the ability to visualize data over time.
Gantt Charts and Timeline Charts
Gantt charts visually depict each task’s start and finish dates, durations, and dependencies by representing tasks or activities as horizontal bars along a time axis. On the other hand, timeline charts offer a chronological order of events or milestones.
Heat Maps and Calendar Charts
Heat maps use color gradients or intensity to depict the magnitude or density of data over several periods. At the same time, calendar grids display data in calendar charts, with colored cells or symbols standing in for values or occasions on particular dates.
Interactive Visualizations
Creating Interactive Data Visualizations
Creating interactive data visualizations goes beyond presenting static charts or graphs. It involves designing visualizations that allow users to actively explore and interact with the underlying data, providing a dynamic and engaging user experience.
Incorporating Filters and Interactivity
Incorporating filters and interactivity is a crucial aspect of interactive data visualizations. Users can customize their data views by selecting specific criteria or categories.
Data Visualization Examples
1. Bar Chart – Sales Performance
Using a horizontal bar chart, this data visualization example shows how well various products have sold. The goal is to give each product’s sales volume clearly and succinctly, making it simple to compare and pinpoint the best-selling items. The chart’s bars are arranged horizontally, with each bar’s length corresponding to the sales volume it reflects.

The chart utilizes color coding for product categories, axes for scale, and labels for clear identification.
Primarily, the chart uses color coding to differentiate between several product groups. It is simpler to visually discern the bars and see trends or patterns within particular product categories by giving different colors to each category.
2. Line Chart – Stock Market Trends
This example uses a line chart to show price patterns in the stock market over a given time frame. This primary goal is to show how prices fluctuate for various stocks and spot market patterns or trends. Multiple lines on the chart, each representing the price movement of a different store, allow users to compare and analyze the performance of various stocks over time.

The chart employs multiple lines, axis labels, and tooltips for highlighting specific data points.
Several techniques and visual components are used to improve the line chart’s ability to show stock market trends. Multiple lines on the chart, each representing a distinct stock, make comparing the price movements of many stocks simple.
3. Pie Chart – Market Share
This data visualization example uses a pie chart to represent the market shares of several businesses within a particular sector. This primary goal is to give each company’s market share and relative positions within the industry a simple and understandable portrayal. The pie chart allows readers to quickly comprehend the distribution of market power by showing market shares as slices of a whole.

Color-coded slices, labels, and legends are used to enhance comprehension.
This pie chart uses techniques and visual components to improve understanding and clarity. The pie slices are color-coded, with different hues used for each organization. Color coding makes it easier for viewers to recognize and distinguish between the various companies depicted in the chart.
4. Scatter Plot – Relationship Analysis
A scatter plot is used in data visualization examples to show the relationship between two variables: income and spending. The scatter plot explains the correlation between two variables by displaying discrete data dots on a graph, each representing a distinct person or piece of data.

Data points, axes, and trend lines facilitate analysis.
The data points are the most noticeable component for distinct observations or data entries. With the x-axis representing revenue and the y-axis indicating expenditure, each data point is shown according to its matching values for income and outlays.
5. Histogram – Age Distribution
The distribution of ages within a population is shown via a histogram in this data visualization example. This visualization’s primary goal is to help comprehend the age demographics by depicting the frequency of age groups. Viewers can determine the distribution’s shape by looking at the histogram, such as whether it is skewed to one side, has a bell-shaped curve, or has other characteristic patterns.

Bars, x-axis labels, and a title provide context.
Several techniques and visual components are used to make the histogram easier to understand and put into context. The bars themselves, which stand in for the age ranges and accompanying frequencies, are the most noticeable component. The height of that bar indicates the number of people in each age group.
6. Infographic – Climate Change Impact
This infographic example of data visualization effectively communicates the consequences of climate change. This visualization’s primary goal is to inform and enlighten viewers on the effects of global warming. It accomplishes this by using charts, maps, and pictures to convey the idea in a captivating and visually appealing way.

Icons, illustrations, color schemes, and concise text convey the message effectively.
The infographic makes use of a variety of methods and visual components to effectively communicate the idea. The visual components can include melting ice caps, desert landscapes, flooded areas, or other pertinent images that effectively convey the effects under discussion.
7. Dashboard – Sales Analytics
This primary goal is to enable users, like sales managers or executives, to track and examine important sales metrics like revenue, conversion rate, and customer acquisition. The dashboard’s interactive features enable users to thoroughly explore the data, dive into particulars, and derive insightful conclusions.

Interactive filters, dynamic charts, and real-time data updates enhance user experience.
Users can alter the display based on their individual needs or areas of interest thanks to interactive filters that have been integrated. These filters may offer the choice of selecting particular time frames, product categories, geographical regions, or other pertinent parameters.
8. Choropleth Map – Population Density
This choropleth map of population density illustrates the population density in various areas. Darker or more vivid colors often represent higher population densities, while lighter or softer tints typically represent lower densities. This gives viewers a visual representation that lets them quickly grasp the relative densities across various places.

Color gradients, legend, and region boundaries enable straightforward interpretation.
The choropleth map displaying population density uses several techniques and visual components to facilitate interpretation and understanding. The color gradients used to represent various densities are the most noticeable component. Darker shades or more brilliant colors frequently characterize greater population densities, while lighter shades or milder colors represent lower densities.
9. Network Graph – Social Connections
This network diagram demonstrates how people are connected in a community. The network’s edges or lines between the nodes show their connections, and each node in the graph represents a distinct person. One can learn more about the social network’s dynamics, patterns, and structure by examining the chart. Nodes are sometimes depicted as circles or points, each representing a distinct community member.
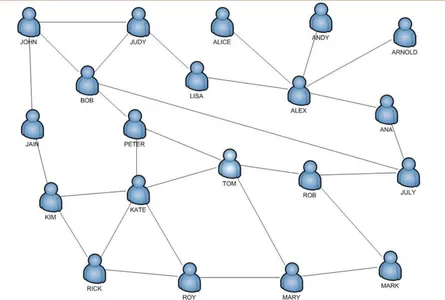
Nodes, edges, labels, and clustering enhance readability. Combining nodes with comparable traits or relationships, for instance, clustering makes the social network representation more logical and understandable. Layout algorithms can also be employed to place the nodes and edge pleasantly and instructively to make the relationships between people clear and understandable.
10. Gantt Chart – Project Timeline
This Gantt chart illustrates a project timeline, showcasing tasks, durations, and dependencies. It provides a visual representation of project progress and helps manage timelines effectively. A project timeline is shown in this Gantt chart, which provides a visual representation of the tasks involved, their durations, and their dependencies. The horizontal axis, which commonly represents dates or time units, displays the project’s timeline. The project’s numerous tasks and activities are listed along the vertical axis.

Bars, milestones, dependencies, and a timeline axis aid project planning and tracking.
It uses various strategies and visual components, including bars, dependencies, milestones, and a timeline axis. These tools help with project planning and tracking, allowing teams to stay on task and maintain organization. The Gantt chart is crucial for effectively managing challenging projects and visualizing project timetables.
11. Heat Map – Website User Behavior
This heat map visualizes user behavior on a website, highlighting high and low engagement areas. It provides insights into user interaction patterns and assists in optimizing web design.
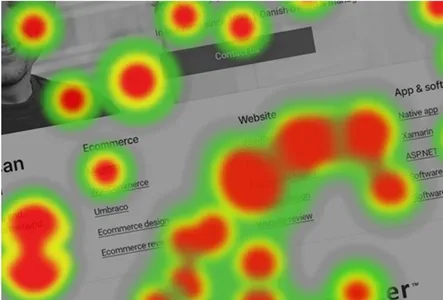
Color gradients, website layout representation, and hover-over tooltips facilitate analysis.
The heat map uses tactics like showing the website’s design and offering tooltips on hover for in-depth study. The heat map gives businesses the tools they need to make intelligent decisions and improve the efficacy of their online platforms thanks to its visual components and data-driven methodology.
12. Interactive Data Visualization – World Happiness Index
This interactive data visualization lets users explore the World Happiness Index across countries and years. It allows for selecting specific variables and provides a comprehensive understanding of happiness levels globally.

Interactive filters, dynamic charts, tooltips, and data animations enhance user engagement.
A thorough grasp of enjoyment levels worldwide is made possible by its interactive filters, which let users choose particular variables of interest. The solution includes dynamic charts with real-time updates, information-rich tooltips, and data animations to increase user engagement. Employing these methods and visual components, users can engage with the data, see trends, and get insightful knowledge about the things that affect happiness around the globe.
13. Proportional Symbol Map – Air Pollution Levels
This proportional symbol map represents air pollution levels in different cities. The size of each symbol corresponds to the pollution level, providing a visual comparison of pollution intensity across locations.

Symbol scaling, color gradients, and a legend aid in understanding pollution variations.
While color gradients offer extra details on the changes in pollution, techniques like symbol scaling ensure that more prominent symbols indicate higher pollution levels. Usually, an explanation is included to help readers comprehend the map’s meaning and the pollution levels represented by various symbol sizes and colors. A proportional symbol map is a valuable tool for regionally visualizing and conveying data on air pollution.
14. Node-Link Diagram – Social Media Connections
This node-link diagram visualizes connections between individuals on a social media platform. Nodes represent users, and links depict relationships or interactions, revealing the network structure and influential users.

Nodes, links, labels, and clustering techniques enhance network analysis.
Applying clustering algorithms to group nodes with comparable properties will improve the study of the social network. The node-link diagram allows a thorough understanding of the linkages and dynamics within the social media connections by utilizing nodes, links, labels, and clustering techniques.
15. Timeline Chart – Historical Events
This timeline chart displays significant historical events in chronological order. It provides a comprehensive overview of events and their timelines, aiding historical analysis.
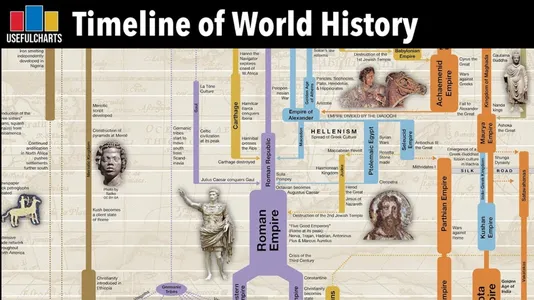
Timelines, event markers, labels, and color coding facilitate navigation and comprehension.
Events can be categorized, or distinct historical eras might be denoted using color coding. With these strategies and visual aids, such as timelines, event markers, labels, and color coding, historical information can be navigated and understood more efficiently, providing a clearer picture of the order and importance of historical events.
16. Interactive Calendar Chart – Employee Leave Schedule
This interactive calendar chart illustrates the leave schedule of employees. It allows for selecting specific months or individuals, providing an overview of scheduled leaves.
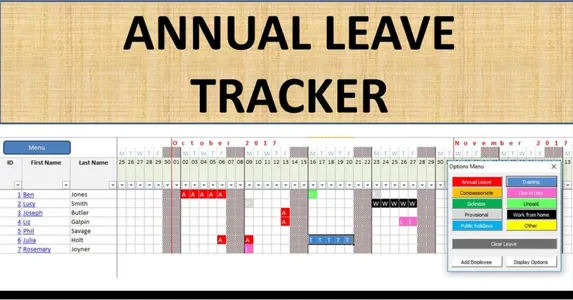
Color-coded calendar cells, interactive filters, and tooltips enhance usability.
Users can use interactive filters to concentrate on particular periods or people of interest. When the mouse pointer hovers over a calendar cell, tooltips can be added to provide more information about each leave entry. These methods and visual components improve the dynamic calendar chart’s usability and simplify navigating and comprehending the employee leave plan.
17. Interactive Sankey Diagram – Energy Flow
This interactive Sankey diagram represents the flow of energy within a system. It visualizes energy generation, distribution, and consumption, enabling users to analyze energy efficiency and identify potential areas of improvement.

Flow lines, node labels, interactive tooltips, and filtering options enhance exploration.
These methods and visual components, such as flow lines, node labels, interactive tooltips, and filtering options, improve the exploration and study of energy flow patterns, enabling reasoned judgment and energy optimization.
18. Word Cloud – Sentiment Analysis
This word cloud visualizes sentiment analysis results by representing frequently occurring words and their sizes based on frequency. It provides a quick overview of critical sentiments expressed in a text corpus.
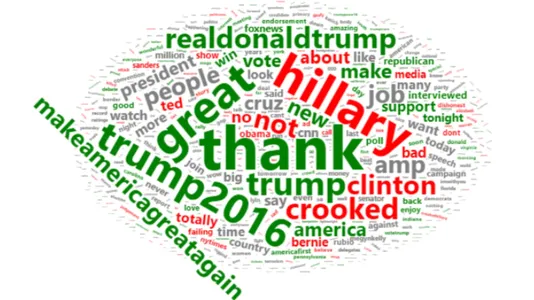
Word sizes, color coding, and layout optimization contribute to the visual impact.
Methods like color coding can be used to distinguish between positive, negative, and neutral attitudes, giving the word cloud more visual impact. Layout optimization also guarantees that the terms are organized attractively. The phrase cloud successfully conveys the critical perspectives in the analyzed text corpus by utilizing word sizes, color coding, and layout optimization.
19. Streamgraph – Website Traffic Sources
This streamgraph visualizes website traffic sources over a period, highlighting the contribution of each source. It showcases the relative importance and fluctuations of different channels.

Stacked areas, color transitions, and tooltips aid in interpretation.
Using these methods and visual components, such as stacked regions, color transitions, and tooltips, helps to comprehend and analyze website traffic sources effectively and provides a thorough understanding of the role and dynamics of each traffic channel.
20. Interactive Tree Map – Product Sales by Category
This interactive tree map displays product sales by category, allowing users to explore sales performance at different levels of aggregation. It offers a visual representation of sales distribution and hierarchy.

Rectangular tiles, color gradients, interactive filtering, and tooltips enhance user experience.
Tooltips can convey more information when a user hovers over the corresponding tile for each category. These techniques and visual components, like rectangular tiles, color gradients, interactive filtering, and tooltips, improve the user experience by allowing users to explore and analyze the distribution of product sales across various categories in an aesthetically pleasing and educational way.
Conclusion
As you’ve seen now, data can be converted into valuable representations using a variety of visualizations, including charts, graphs, maps, infographics, and interactive dashboards. The examples in this article illustrate the variety of methods and aesthetic components used in data visualization and serve as models for designing powerful and educational visualizations. With data visualization, we can unlock insights, encourage intelligent decision-making, and spark creativity and innovation through data-driven narratives by utilizing the power of data visualization.
To see what more you can accomplish with data visualization tools, you should check out the courses and tutorials at Analytics Vidhya (AV). Analytics Vidhya is an ed-tech platform that has helped hundreds of students explore data science, data visualization, and other data-related domains. It is also an excellent place to kickstart your data journey using modern-day technologies like machine learning (ML) and artificial intelligence (AI). So get ready, enroll in some courses, and see how data visualization takes over the analytics industry.
Frequently Asked Questions
A. several popular data visualization tools are available, such as Tableau, Power BI, QlikView, D3.js, and Python libraries like Matplotlib and Seaborn.
A. Consider the nature of your data, the objective of visualization, and the message you want to convey. Different visualization types excel at other tasks, so choose the one that best represents your data and aligns with your goals.
A. Consider design principles such as color selection, layout, and typography. Use interactive features, storytelling techniques, and appropriate visual elements to make your visualizations captivating and easily comprehended.
A. Yes, ethical considerations include ensuring data accuracy, maintaining data privacy and security, and avoiding misrepresentation or bias in visualizations. Being transparent and responsible when presenting data is crucial to avoid misleading interpretations.


