Exploring Research on Gender Equality with NLP and Elicit
Introduction
NLP (Natural Language Processing) can help us to understand huge amounts of text data. Instead of going through a huge amount of documents by hand and reading them manually, we can make use of these techniques to speed up our understanding and get to the main messages quickly. In this blogpost, we dive into the possibility of using panda data frames and NLP tools in Python to get an idea of what people wrote about when doing research on gender equality in Afghanistan using Elicit. These insights might help us to understand what worked and what did not work to advance gender equality during the last decades in a country that is considered to be one of the most difficult places to be a woman or girl (World Economic Forum, 2023).
Learning Objective
- Gain proficiency in text analysis for text in CSV files.
- Acquire knowledge on how to do natural language processing in Python.
- Develop skills in effective data visualization for communication.
- Gain insights on how research on gender equality in Afghanistan evolved over time.
This article was published as a part of the Data Science Blogathon.
Table of contents
Using Elicit for Literature Reviews
To generate the underlying data, I use Elicit, a AI-powered tools for Literature Reviews (Elicit). I ask the tool to generate a list of papers related to the question: Why did gender equality fail in Afghanistan? I then download a resulting list of papers (I consider a random number of more than 150 papers) in CSV format. How does this data look like? Let’s have a look!
Analyzing CSV Data from Elicit in Python
We will first read in the CSV file as a pandas dataframe:
import pandas as pd
#Identify path and csv file
file_path = './elicit.csv'
#Read in CSV file
df = pd.read_csv(file_path)
#Shape of CSV
df.shape
#Output: (168, 15)
#Show first rows of dataframe
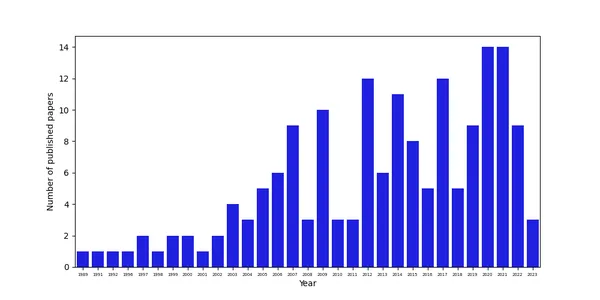
df.head()The df.head() command shows us the first rows of the resulting pandas dataframe. The dataframe consists of 15 columns and 168 rows. We generate this information with the df.shape command. Let’s first explore in which year most of these studies were published. To explore this, we can take advantage of the column reporting the each paper’s year of publication. There are several tools to generate figures in Python, but let’s rely on the seaborn and matplotlib library here. To analyze in which year papers were mostly published, we can take advantage of a so-called countplot, and also costumize the axis labels and axis ticks to make it look nicely:
Analyzing the Timely Distribution of Published Papers
import matplotlib.pyplot as plt
import seaborn as sns

%matplotlib inline

#Set figure size
plt.figure(figsize=(10,5))

#Producte a countplot
chart = sns.countplot(x=df["Year"], color='blue')

#Set labels
chart.set_xlabel('Year')
chart.set_ylabel('Number of published papers')

#Change size of xticks
# get label text
_, xlabels = plt.xticks()

# set the x-labels with
chart.set_xticklabels(xlabels, size=5)

plt.show()
The data shows that the number of papers increased over time, probably also due to greater data availability and better possibilities to do research in Afghanistan after the Taliban ceased power in 2001.
Analyzing the Content of Papers
Number of Words Written
While this gives us a first insight on research conducted on gender equality in Afghanistan, we are mostly interested in what researchers actually wrote about. To get an idea of the content of these papers, we can take advantage of the abstract, which Elicit kindly included for us in the CSV file the tool generated for us. To do this, we can follow standard procedures for text analysis, such as the one outlined by Jan Kirenz in one of his blogposts. We start by simply counting the number of words in each abstract by using a lambda method:
#Split text of abstracts into a list of words and calculate the length of the list
df["Number of Words"] = df["Abstract"].apply(lambda n: len(n.split()))

#Print first rows
print(df[["Abstract", "Number of Words"]].head())

#Output:

                                            Abstract  Number of Words
0  As a traditional society, Afghanistan has alwa...              122
1  The Afghanistan gender inequality index shows ...              203
2  Cultural and religious practices are critical ...              142
3  ABSTRACT Gender equity can be a neglected issu...              193
4  The collapse of the Taliban regime in the latt...              357

#Describe the column with the number of words
df["Number of Words"].describe()

count     168.000000
mean      213.654762
std       178.254746
min        15.000000
25%       126.000000
50%       168.000000
75%       230.000000
max      1541.000000
Great. Most of the abstracts seem to be rich in words. They have on average 213.7 words. The minimum abstract only consists of 15 words, however, while the maximum abstract has 1,541 words.
What do Researchers Write About?
Now that we know that most abstracts are rich of information, let’s ask what they mostly write about. We can do so by making a frequency distribution for each word written. However, we are not interested in certain words, such as stopwords. Consequently, we need to do some text processing:
# First, transform all to lower case
df['Abstract_lower'] = df['Abstract'].astype(str).str.lower()
df.head(3)#import csv

# Let's tokenize the column
from nltk.tokenize import RegexpTokenizer

regexp = RegexpTokenizer('\w+')

df['text_token']=df['Abstract_lower'].apply(regexp.tokenize)

#Show the first rows of the new dataset
df.head(3)

# Remove stopwords
import nltk

nltk.download('stopwords')

from nltk.corpus import stopwords

# Make a list of english stopwords
stopwords = nltk.corpus.stopwords.words("english")

# Extend the list with your own custom stopwords
my_stopwords = ['https']
stopwords.extend(my_stopwords)

# Remove stopwords with lampda function
df['text_token'] = df['text_token'].apply(lambda x: [item for item in x if item not in stopwords])

#Show the first rows of the dataframe
df.head(3)

# Remove infrequent words (words shorter than or equal to two letters)
df['text_string'] = df['text_token'].apply(lambda x: ' '.join([item for item in x if len(item)>2]))

#Show the first rows of the dataframe
df[['Abstract_lower', 'text_token', 'text_string']].head()
What we do here is to first transform all words into lower case, and to tokenize them later via natural language processing tools. Word tokenization is a crucial step in natural language processing and means splitting down text into individual words (tokens). We use the RegexpTokenizer and tokenize the text of our abstracts based on alphanumeric characteristics (denoted via ‘\w+’). Store the resulting tokens in the column text_token. We then remove stopwords from this list of tokens by using the dictionary of the natural language processing toolbox of nltk, the Python NLTK (Natural Language Toolkit) library. Delete words that are shorter than two letters. This type of text processing helps us to focus our analysis on more meaningful terms.
Generate Word Cloud
To visually analyze the resulting list of words, we generate a list of strings from the text we processed and tokenize this list and then generate a word cloud:
from wordcloud import WordCloud

# Create a list of words
all_words = ' '.join([word for word in df['text_string']])

# Word Cloud
wordcloud = WordCloud(width=600,
                     height=400,
                     random_state=2,
                     max_font_size=100).generate(all_words)

plt.figure(figsize=(10, 7))
plt.imshow(wordcloud, interpolation='bilinear')
plt.axis('off');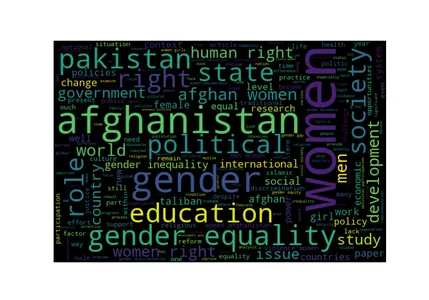
The word cloud shows that those words mentioned mostly are those also forming part of our search query: afghanistan, gender, gender equality. However, some other words that are substitutes also form part of the list of most mentioned words: women and men. These words per se are not very informative, but some others are: within the research on gender equality in Afghanistan, researchers seem to be very concerned about education, human rights, society, and the state. Surprisingly, Pakistan also forms part of the list. This could mean that results generated to the search query are imprecise and also included research on gender equality on Afghanistan, although we did not ask for it. Alternatively, they could mean that gender equality of Afghan women is also an important research topic in Pakistan, maybe due to many Afghans settling in in Pakistan as a result of the difficult situation in their home country.
Analyze the Sentiment of Authors
Ideally, research would be neutral and free of emotions or opinions. However, it is within our human nature to have opinions and sentiments. To investigate to which extent researchers reflect their own sentiments in what they write about, we can do a sentiment analysis. Sentiment analyses are methods to analyze if a set of text is positive, neutral, or negative. In our example, we will use the VADER Sentiment Analysis Tool. VADER stands for Valence Aware Dictionary and Sentiment Reasoner, and is a lexicon and rule-based sentiment analysis tool.
How the VADER sentiment analysis tool works, is that it uses a pre-built sentiment lexicon that consists of a vast number of words with associated sentiments. It also considers grammatical rules to detect the sentiment polarity (positive, neutral, and negative) of short texts. The tool results in a sentiment score (also called the compound score) based on the sentiment of each word and the grammatical rules in the text. This score ranges from -1 to 1. Values above zero are positive and values below zero are negative. Since the tool relies on a prebuilt sentiment lexicon, it does not require complex machine learning models or extensive models.
# Access to the required lexicon containing sentiment scores for words
nltk.download('vader_lexicon')

# Initializes the sentiment analyzer object
from nltk.sentiment import SentimentIntensityAnalyzer

#Calculate the sentiment polarity scores with analyzer
analyzer = SentimentIntensityAnalyzer()

# Polarity Score Method - Assign results to Polarity Column
df['polarity'] = df['text_string'].apply(lambda x: analyzer.polarity_scores(x))
df.tail(3)

# Change data structure - Concat original dataset with new columns
df = pd.concat(
    [df,
     df['polarity'].apply(pd.Series)], axis=1)

#Show structure of new column
df.head(3)

#Calculate mean value of compound score
df.compound.mean()

#Output: 0.20964702380952382
The code above generates a polarity score that ranges from -1 to 1 for each abstract, here denoted as the compound score. The mean value is above zero, so most of the research has a positive connotation. How did this change over time? We can simply plot the sentiments by year:
# Lineplot
g = sns.lineplot(x='Year', y='compound', data=df)

#Adjust labels and title
g.set(title='Sentiment of Abstract')
g.set(xlabel="Year")
g.set(ylabel="Sentiment")

#Add a grey line to indicate zero (the neutral score) to divide positive and negative scores
g.axhline(0, ls='--', c = 'grey')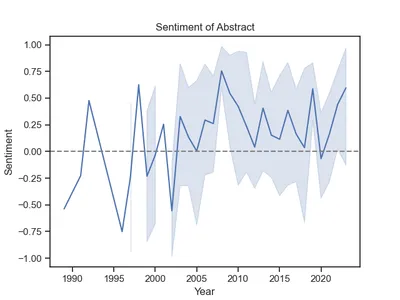
Interesting. Most of the research was positive starting from 2003 onwards. Before that, sentiments fluctuates more significantly and were more negative, on average, probably due to the difficult situation of women in Afghanistan.
Conclusion
Natural Language Processing can help us to generate valuable insights into large amounts of text. What we learned here from nearly 170 papers is that education and human rights were the most important topics in the research papers gathered by Elicit, and that researchers started to write more positively about gender equality in Afghanistan from 2003 onwards, shortly after the Taliban ceased power in 2001.
Key Takeaways
- We can use Natural Language Processing Tools to gain quick insights into the main topics studied in a certain research field.
- Word Clouds are great visualization tools to get an understanding of the most commonly used words in a text.
- Sentiment Analysis shows that research might not be as neutral as expected.
I hope you found this article informative. Feel free to reach out to me on LinkedIn. Let’s connect and work towards leveraging data for good!
Frequently Asked Questions
A. Elicit is an online platform designed to aid researchers in locating AI papers and research data. By simply posing a research question, Elicit leverages its vast database of 175 million articles to uncover relevant answers. Moreover, it provides the functionality to utilize Elicit for analyzing your own papers. Additionally, Elicit boasts a user-friendly interface, ensuring effortless navigation and accessibility.
A. Natural Language Processing (NLP) is a specialized branch within the field of artificial intelligence (AI). Its primary objective is to enable machines to comprehend and analyze human language, allowing them to automate various repetitive tasks. Some common applications of NLP include machine translation, summarization, ticket classification, and spellchecking.
A. There are several approaches to calculating a sentiment score, but the widely used method involves utilizing a dictionary of words classified as negative, neutral, or positive. The text is subsequently examined to determine the presence of negative and positive words, allowing for an estimation of the overall sentiment conveyed by the text.
A. The compound score is derived by adding up the valence scores of individual words in the lexicon, taking into account applicable rules, and subsequently normalizing the score to range between -1 (indicating highly negative sentiment) and +1 (indicating highly positive sentiment). This metric is particularly valuable when seeking a singular, one-dimensional measure of sentiment.
References
- World Economic Forum. Global Gender Gap Report 2023.
- Elicit. Link: Why did gender equality fail in afghanistan | Search | Elicit
- Jan Kirenz. Text Mining and Sentiment Analysis with NLTK and pandas in Python.
- Hutto, C.J. & Gilbert, E.E. (2014). VADER: A Parsimonious Rule-based Model for Sentiment Analysis of Social Media Text. Eighth International Conference on Weblogs and Social Media (ICWSM-14). Ann Arbor, MI, June 2014.
The media shown in this article is not owned by Analytics Vidhya and is used at the Author’s discretion.


