Python Treatment for Outliers in Data Science
Before we get started the discussion on Outliers, we should understand exactly what Feature Improvements mean under Feature Engineering.
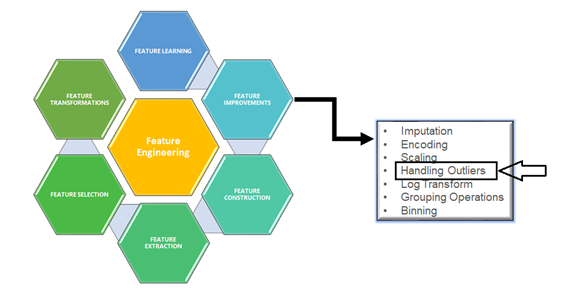
What is Feature Engineering?
- When we have a LOT OF FEATURES in the given dataset, feature engineering can become quite a challenging and interesting module.
- The number of features could significantly impact the model considerably, So that feature engineering is an important task in the Data Science life cycle.
Family of Feature Engineering
Feature Improvements
In the Feature Engineering family, we are having many key factors are there, let’s discuss Outlier here. This is one of the interesting topics and easy to understand in Layman’s terms.
Outlier
- An outlier is an observation of a data point that lies an abnormal distance from other values in a given population. (odd man out)
- Like in the following data point (Age)
- 18,22,45,67,89,125,30
- Like in the following data point (Age)
- An outlier is an object(s) that deviates significantly from the rest of the object collection.
- List of Cities
- New York, Las Angles, London, France, Delhi, Chennai
- List of Cities
- It is an abnormal observation during the Data Analysis stage, that data point lies far away from other values.
- List of Animals
- cat, fox, rabbit, fish
- List of Animals
- An outlier is an observation that diverges from well-structured data.
- The root cause for the Outlier can be an error in measurement or data collection error.
- Quick ways to handling Outliers.
- Outliers can either be a mistake or just variance. (As mentioned, examples)
- If we found this is due to a mistake, then we can ignore them.
- If we found this is due to variance, in the data, we can work on this.

In the picture of the Apples, we can find the out man out?? Is it? Hope can Yes!
But the huge list of a given feature/column from the .csv file could be a really challenging one for naked eyes.
First and foremost, the best way to find the Outliers are in the feature is the visualization method.
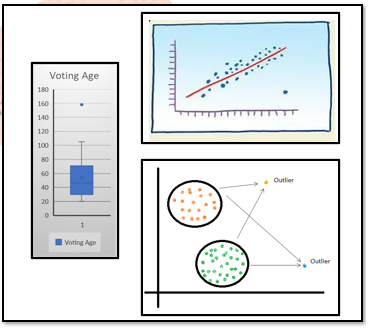
Visualization of outlier
What are the Possibilities for an Outlier?
Of course! It would be below quick reasons.
- Incorrect data entry or error during data processing
- Missing values in a dataset.
- Data did not come from the intended sample.
- Errors occur during experiments.
- Not an errored, it would be unusual from the original.
- Extreme distribution than normal.
That’s fine, but you might have questions about Outlier if you’re a real lover of Data Analytics, Data mining, and Data Science point of view.
Let’s have a quick discussion on those.
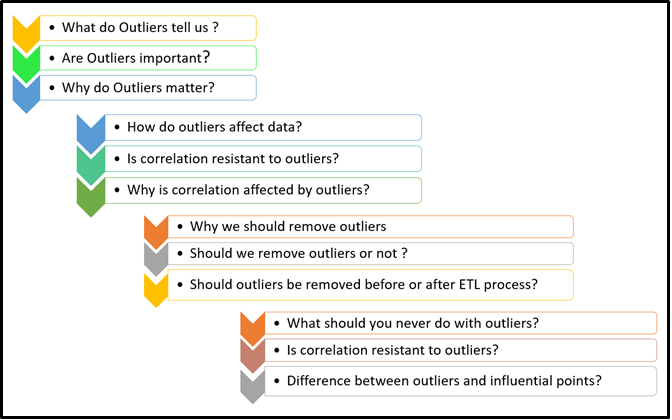
Understand more about Outlier
- Outliers tell us that the observations of the given data set, how the data point(s) differ significantly from the overall perspective. Simply saying odd one/many. this would be an error during data collection.
- Generally, Outliers affect statistical results while doing the EDA process, we could say a quick example is the MEAN and MODE of a given set of data set, which will be misleading that the data values would be higher than they really are.
- the CORRELATION COEFFICIENT is highly sensitive to outliers. Since it measures the strength of a linear relationship between
two variables. the relationship dependent of the data. correlation is a non-resistant measure and r (correlation coefficient) is strongly affected by
outliers.
- Positive Relationship
- When the correlation coefficient is closer to value 1
- Negative Relationship
- When the correlation coefficient is closer to value -1
- Independent
- When X and Y are independent, then the correlation coefficient is close to zero (0)
- Positive Relationship
- We could understand the data collection process from the Outliers and its observations. An analysis of how it occurs and how to minimize and set the process in future data collection guidelines.
- Even though the Outliers increase the inconsistent results in your dataset during analysis and the power of statistical impacts significant, there would challenge and roadblocks to remove them in few situations.
- DO or DO NOT (Drop Outlier)
- Before dropping the Outliers, we must analyze the dataset with and without outliers and understand better the impact of the results.
- If you observed that it is obvious due to incorrectly entered or measured, certainly you can drop the outlier. No issues on that case.
- If you find that your assumptions are getting affected, you may drop the outlier straight away, provided that no changes in the results.
- If the outlier affects your assumptions and results. No questions simply drop the outlier and proceed with your further steps.
Finding Outliers
So far we have discussed what is Outliers, how it affects the given dataset, and Either can we drop them or NOT. Let see now how to find from the given dataset. Are you ready!
We will look at simple methods first, Univariate and Multivariate analysis.
- Univariate method: I believe you’re familiar with Univariate analysis, playing around one variable/feature from the given data set. Here to look at the Outlier we’re going to apply the BOX plot to understand the nature of the Outlier and where it is exactly.
Let see some sample code. Just I am taking titanic.csv as a sample for my analysis, here I am considering age for my analysis.
plt.figure(figsize=(5,5))
sns.boxplot(y='age',data=df_titanic)
You can see the outliers on the top portion of the box plot visually in the form of dots.
- Multivariate method: Just I am taking titanic.csv as a sample for my analysis, here I am considering age and passenger class for my analysis.
plt.figure(figsize=(8,5))
sns.boxplot(x='pclass',y='age',data=df_titanic)
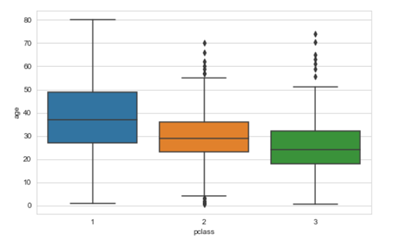
We can very well use Histogram and Scatter Plot visualization technique to identify the outliers.
On top of this, we have with
mathematically to find the Outliers as follows Z-Score and Inter Quartile Range (IQR) Score methods
Z-Score method: In which the distribution of data in the form mean is 0 and the standard deviation (SD) is 1 as Normal Distribution format.
Let’s consider below the age group of kids, which was collected during data science life cycle stage one, and proceed for analysis, before going into further analysis, Data scientist wants to remove outliers. Look at code and output, we could understand the essence of finding outliers using the Z-score method.
import numpy as np
kids_age = [1, 2, 4, 8, 3, 8, 11, 15, 12, 6, 6, 3, 6, 7, 12,9,5,5,7,10,10,11,13,14,14]
mean = np.mean(voting_age)
std = np.std(voting_age)
print('Mean of the kid''s age in the given series :', mean)
print('STD Deviation of kid''s age in the given series :', std)
threshold = 3
outlier = []
for i in voting_age:
    z = (i-mean)/std
    if z > threshold:
        outlier.append(i)
print('Outlier in the dataset is (Teen agers):', outlier)
Output
Mean of the kid’s age in the given series: 2.6666666666666665
STD Deviation of kids age in the given series: 3.3598941782277745
The outlier in the dataset is (Teenagers): [15]
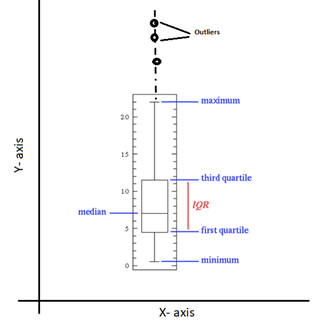
(IQR) Score method: In which data has been divided into quartiles (Q1, Q2, and Q3). Please refer to the picture Outliers Scaling above. Ranges as below.
- 25th percentile of the data – Q1
- 50th percentile of the data – Q2
- 75th percentile of the data – Q3
Let’s have the junior boxing weight category series from the given data set and will figure out the outliers.
import numpy as np
import seaborn as sns
# jr_boxing_weight_categories
jr_boxing_weight_categories = [25,30,35,40,45,50,45,35,50,60,120,150]
Q1 = np.percentile(jr_boxing_weight_categories, 25, interpolation = 'midpoint')
Q2 = np.percentile(jr_boxing_weight_categories, 50, interpolation = 'midpoint')
Q3 = np.percentile(jr_boxing_weight_categories, 75, interpolation = 'midpoint')
IQR = Q3 - Q1
print('Interquartile range is', IQR)
low_lim = Q1 - 1.5 * IQR
up_lim = Q3 + 1.5 * IQR
print('low_limit is', low_lim)
print('up_limit is', up_lim)
outlier =[]
for x in jr_boxing_weight_categories:
    if ((x> up_lim) or (x<low_lim)):
         outlier.append(x)
print(' outlier in the dataset is', outlier)
Output
Interquartile range is 20.0
low_limit is 5.0
up_limit is 85.0
the outlier in the dataset is [120, 150]
sns.boxplot(jr_boxing_weight_categories)
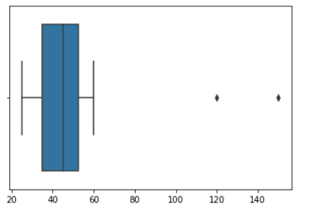
Loot at the boxplot we could understand where the outliers are sitting in the plot.
So far, we have discussed what is Outliers, how it looks like, Outliers are good or bad for data set, how to visualize using matplotlib /seaborn and stats methods.
Now, will conclude correcting or removing the outliers and taking appropriate decision. we can use the same Z- score and (IQR) Score with the condition we can correct or remove the outliers on-demand basis. because as mentioned earlier Outliers are not errors, it would be unusual from the original.
Hope this article helps you to understand the Outliers in the zoomed view in all aspects. let’s come up with another topic shortly. until then bye for now! Thanks for reading! Cheers!!
The media shown in this article are not owned by Analytics Vidhya and is used at the Author’s discretion.


Great explanation! Thanks