This article was published as a part of the Data Science Blogathon
Financial Companies and Banks have a lot of data. Nowadays, customers do a lot of online transactions, make purchases with their card, others use the Bank’s mobile app, website, and so on. Banks have a lot of data about their customers. The data which banks hold includes their account balance, salary amounts, incomes, and so on. Customer data plays a big role in the banking and financial services industry. Banks and Financial Institutions use data and predictive analytics to drive their growth and serve customers better. Most big players in the Banking and Financial Services industry nowadays are trying to identify potential breakthroughs they can make with the vast amount of data and metrics they hold.

( Image Source: https://www.pexels.com/photo/buildings-with-glass-windows-351264/)
How have banks changed?
Banks have changed a lot. Nowadays everything is digital and all data is kept track of. With these changes, there are a lot of opportunities to grow and improve. Customer data helps banks and financial institutions in offering better services to customers, increasing profitability, and optimising their operations to maximise efficiency. Banks use data mining, collection, and data warehousing methods to manage, process, and analyse vast amounts of information. Banks also use tools that aid in reporting, managing loans, and deposits and work with performance metrics to foster data-driven growth.
How Banks Use Data?
Data on customers help banks in strategic planning and decision-making. Better data and software have helped in the creation of improved banking apps. This has greatly improved the customer experience. Automated collection of data and analysis has helped many banking departments.
Automated loan and credit approvals can be implemented by banks, on the basis of past customer data and the financial status of the customer. These approvals are done on the basis of customers’ past data, like bank balance, payment history, demographics, and other parameters which vary from person to person. With such data, these approvals will take a second. Faster access to financial tools helps in a lot of ways, one of which is faster transactions.
Similarly, more data can help in easier fraud detection. Swift data-driven fraud detection can isolate risks and financial fraud. Data on past fraud transactions can help in predicting fraud transactions.
Risk management can be done better with more data. Data-driven risk management can help in lower costs and better customer management. Relevant and actionable information helps to plan risk management strategies.
Data-driven decisions in Banks can be implemented. The first step in this process is data collection and data management. Then comes understanding the parameters and other metrics, followed by modelling the data and creating the data pipeline.
The customer data can be utilised in many ways. One of the interesting and effective ways for banks to understand their customers is by predicting the salary of customers from existing data.
Predicting the salary of a Bank Customer:
Banks rely on data to make a lot of decisions. One of the important data in judging the profile of a customer is the customer’s salary and income. Higher-income people are less likely to default loans or perform financial fraud. Similarly, lower-income people might show interest in bonds and index funds to increase money and so on. In the US, the income of a person and their credit history determines their credit limit. Financial data and past salaries can help in predicting the salary of a person.
Let us work on Data provided by ANZ for an open-access program. The data contains a large number of bank transactions and other financial information.
The Data:
The dataset contains 12043 transactions for 100 customers who hold one bank account.
The transactional period is from 01/08/2018 – 31/10/2018 (92 days duration). The data entries are unique and have consistent formats for analysis. For each record/row, information is complete for the majority of columns. Some columns contain missing data (blank or NA cells), which is likely due to the nature of the transaction. (i.e. merchants are not involved for Inter Bank transfers or Salary payments) It is also noticed that there are only 91 unique dates in the dataset, suggesting the transaction records for one day are missing (turned out to be 2018-08-16).
Let us get started with the code.
First, we import the necessary libraries.
#importing the necessary libraries
import numpy as np
import pandas as pd
import seaborn as sns
import matplotlib.pyplot as plt
from sklearn.linear_model import LinearRegression
from sklearn.tree import DecisionTreeRegressor
from sklearn.cluster import KMeans
from sklearn.preprocessing import PolynomialFeatures
from sklearn.model_selection import train_test_split
from sklearn.metrics import mean_squared_error, r2_score
import seaborn as sns
Now, we read the data.
#reading the data
data = pd.read_csv("/kaggle/input/anz-banking-data/ANZ.csv")
Let us have a look at the data.
data.head()
Output:
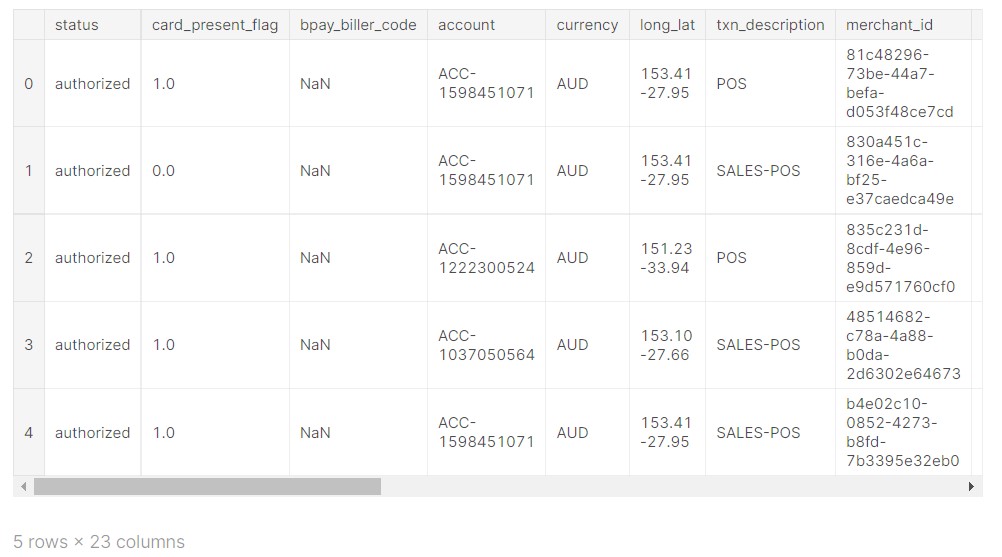
The data has 23 columns, only a few are visible here. I will share the link to the code and dataset in the end.
Let us see the name of the columns in the data.
#the columns in data
data.columns
Output:
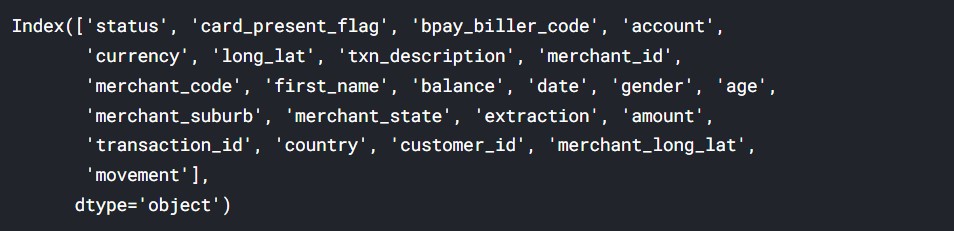
So, here we can see the names of all the columns. The data has numeric features, but they are few. Now, we take the data which will be useful to predict the salary of the customers.
First is customer ID, which is the number with which we will identify customers. Next, we take their age, transaction type, balance and amount of transaction.
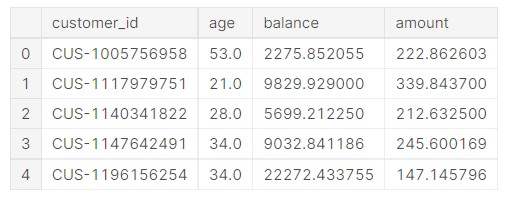
#selecting the necessary columns, with numerical data
data=data[["customer_id","age","txn_description","balance","amount"]]
Let us see how the data looks like now.
data.head()
Output:
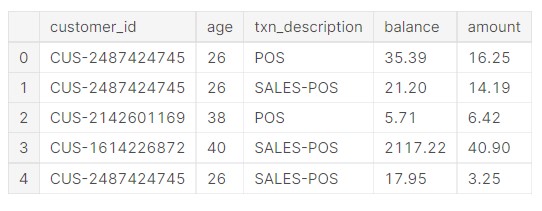
So, the relevant features we needed are in the data now.
Now we need to create a few new features. We can look at how much on average, a customer spends on a type of transaction and use that as a feature. The reason is, expenditure is related to salary. The person will a higher salary will be more likely to spend more money, hence the bank can provide those customers with offers or send them promotional content.
Let us first see the major types of transactions.
#Getting the unique values for the types of transactions
print(data['txn_description'].unique())
Output:

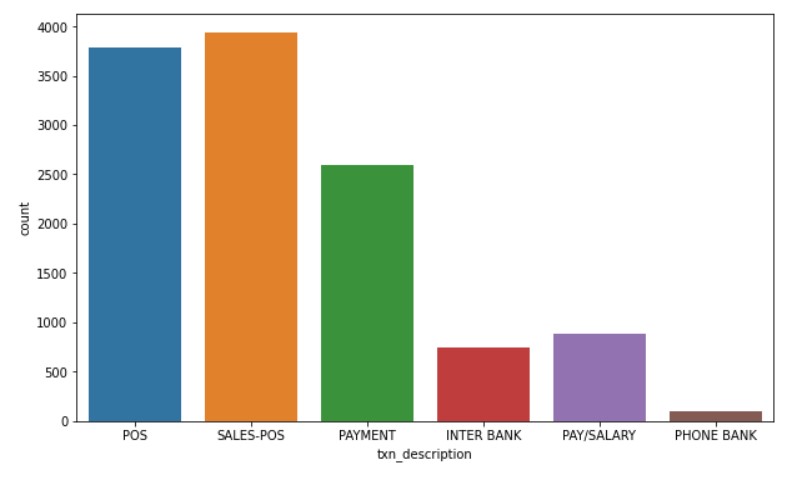
Let us plot the magnitude.
plt.figure(figsize=(10, 6))
sns.countplot(x="txn_description", data=data)
Output:
plot_data= data.groupby(["customer_id"]).mean().reset_index()
plot_data.head()
Output:
Finding out the mean salary of each customer
Now, we find the mean salary of each customer.
#Finding the Salary for all the customers
salary=data[data["txn_description"]=="PAY/SALARY"].groupby("customer_id").mean().reset_index()
salary=salary[["customer_id","amount"]]
salary=salary.rename(columns = {'amount':'salary'})
Let us see how the data looks now.
salary.head()
Output:
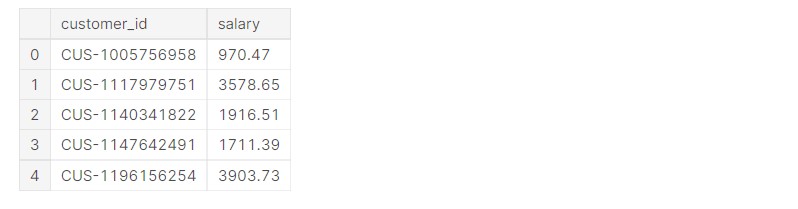
We can see that the customer ID and salary are listed together.
Analyze relation between existing data
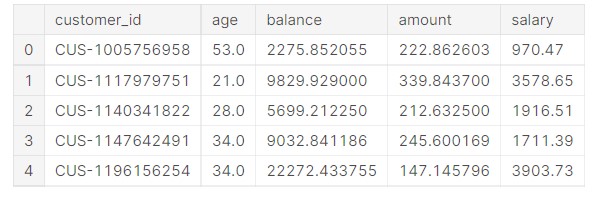
Now, we analyze the relation between existing data.
plot_data=pd.merge(plot_data, salary, on="customer_id")
plot_data.head()
Output:
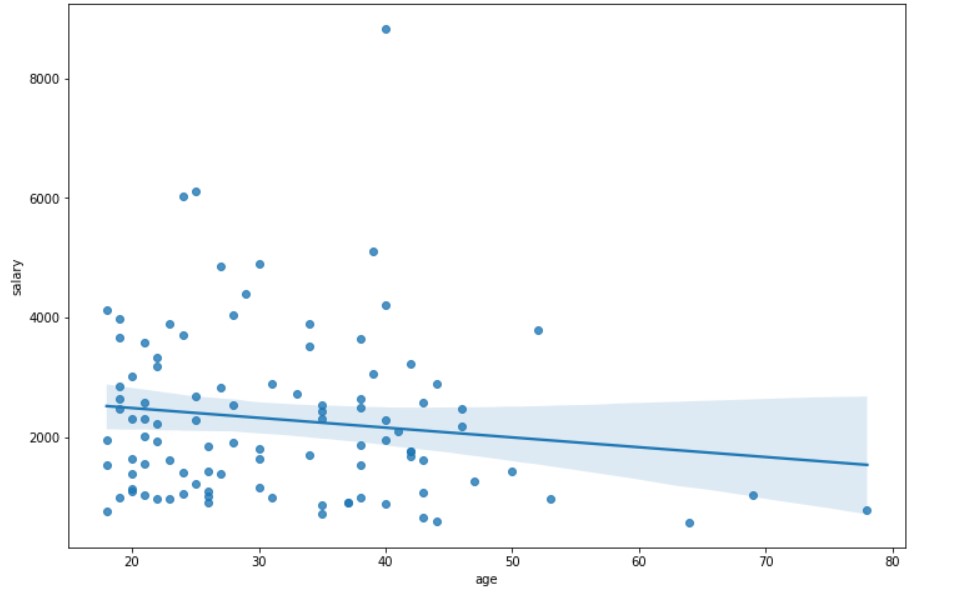
Salary and Age
plt.figure(figsize=(12, 8))
sns.regplot(x="age", y="salary", data=plot_data)
Output:
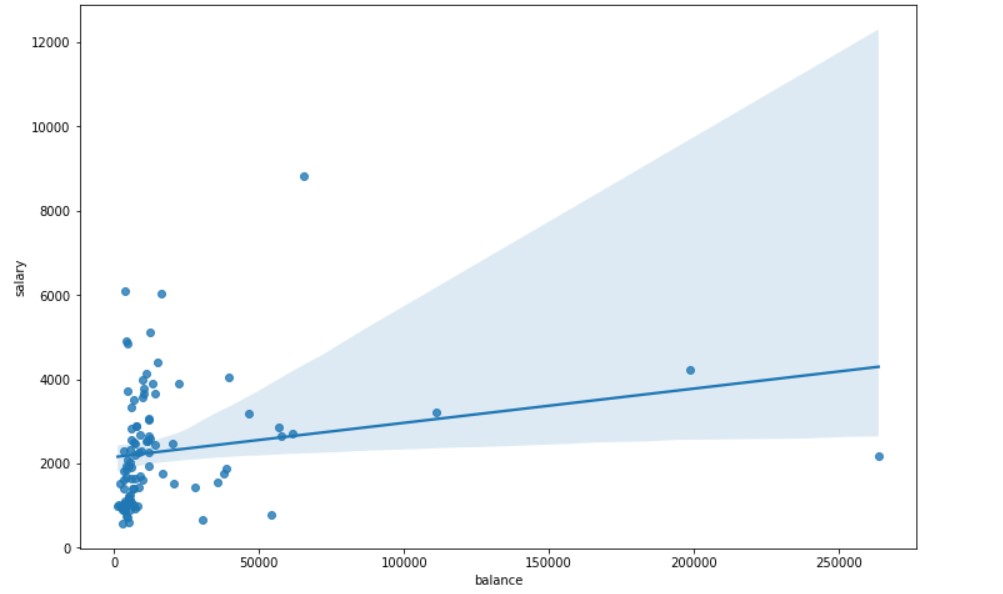
Salary and Account Balance
plt.figure(figsize=(12, 8))
sns.regplot(x="balance",y= "salary", fit_reg=True, data=plot_data)
Output:
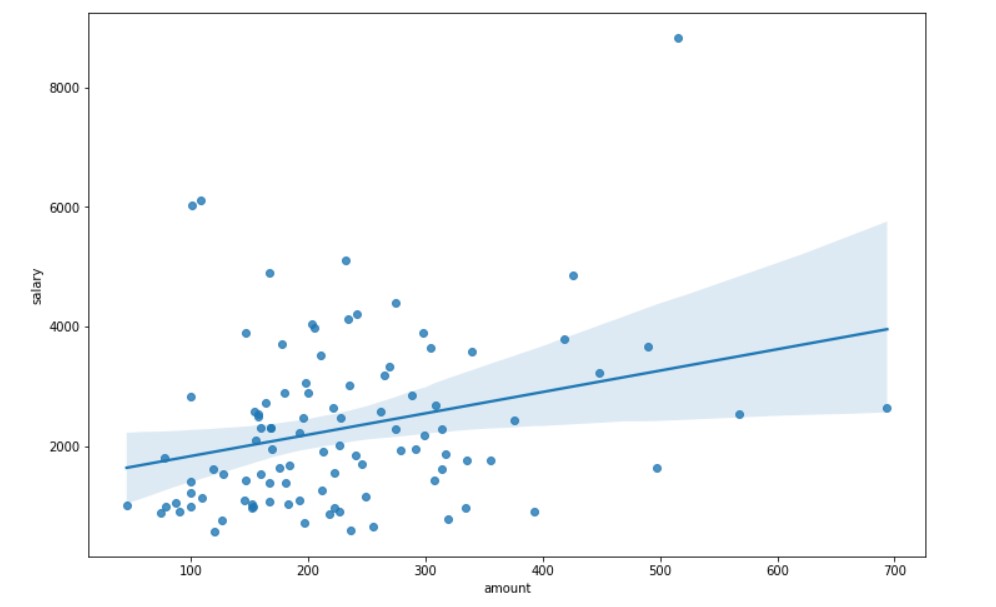
Salary and Transaction Amount
plt.figure(figsize=(12, 8))
sns.regplot(x="amount",y= "salary", fit_reg=True, data=plot_data)
Output:
Creating New Features
Now, we will work on creating some new features.
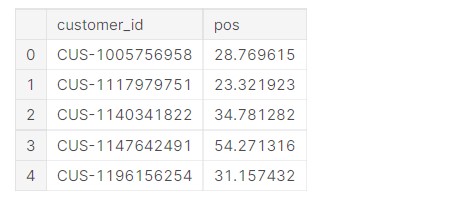
Finding out mean POS (Point of Sale) for each customer
#POS indicates transaction made at any business or such, thus it reflects spending behaviour of customer
pos=data[data["txn_description"]==("POS"or"SALES-POS")].groupby("customer_id").mean().reset_index()
pos=pos[["customer_id","amount"]]
pos=pos.rename(columns = {'amount':'pos'})
Now, let us check the data.
pos.head()
Output:
Now, we need to find the length of the data.
len(pos)
Output:
100
The length being hundred indicated that the data exists for all the 100 customers in the dataset and can be used as a new feature.
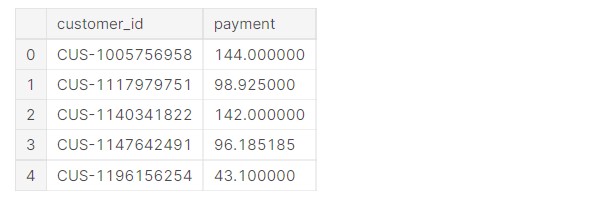
Finding out the mean “PAYMENT” made by the customer
#Bills and payments made by customer
payment=data[data["txn_description"]=="PAYMENT"].groupby("customer_id").mean().reset_index()
payment=payment[["customer_id","amount"]]
payment=payment.rename(columns = {'amount':'payment'})
These are basically the bills, like electricity bill, gas bill etc, paid by the customer.
Let us check the data.
payment.head()
Output:
Let us check the length of the data
len(payment)
Output:
100
Finding out the mean ‘INTER BANK’, that is Bank to Bank transfer by each customer
Now, we find the interbank transfers made by each customer.
#Bills and payments made by customer
payment=data[data["txn_description"]=="PAYMENT"].groupby("customer_id").mean().reset_index()
payment=payment[["customer_id","amount"]]
payment=payment.rename(columns = {'amount':'payment'})
interbank.head()
Output:
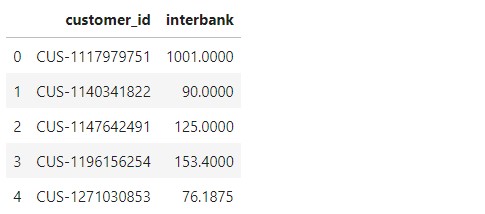
Let us find out the length of Interbank transaction data.
len(interbank)
Output:
68
So, basically, we do not have this data for all the customers. Hence, it cannot be used as a new feature.
Finding out the mean “PHONE BANK” made by the customer
These are basically online transactions made by mobile.
#Banking via phone/online pay
phonebank=data[data["txn_description"]=='PHONE BANK'].groupby("customer_id").mean().reset_index()
phonebank=phonebank[["customer_id","amount"]]
phonebank=phonebank.rename(columns = {'amount':'phonebank'})
phonebank.head()
Output:
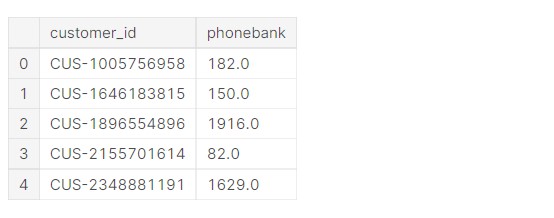
Let us find the length of the phone bank.
len(phonebank)
Output:
16
We created a few new features, but these features do not have data for all customers. Salary, pos and payment could be determined for all the customers, but interbank and phone bank could not be determined, due to lack of data. Thus, we created 2 new features for the data. The average payments made by customers and the average money spent by customers at the point of sale.
Combining relevant data into a single data frame
customer=data.groupby("customer_id").mean().reset_index()
customer=customer[["customer_id","age","balance"]]
df=pd.merge(customer, payment, on="customer_id")
df=pd.merge(df, pos, on="customer_id")
df=pd.merge(df, salary, on="customer_id")
Now, let us have a look at the data.
df.head()
Output:
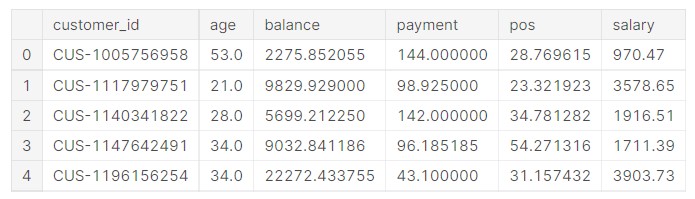
So, basically, now we have 5 numerical column data for each data.
Relations For New Features
Let us analyse the relations for the two new features.
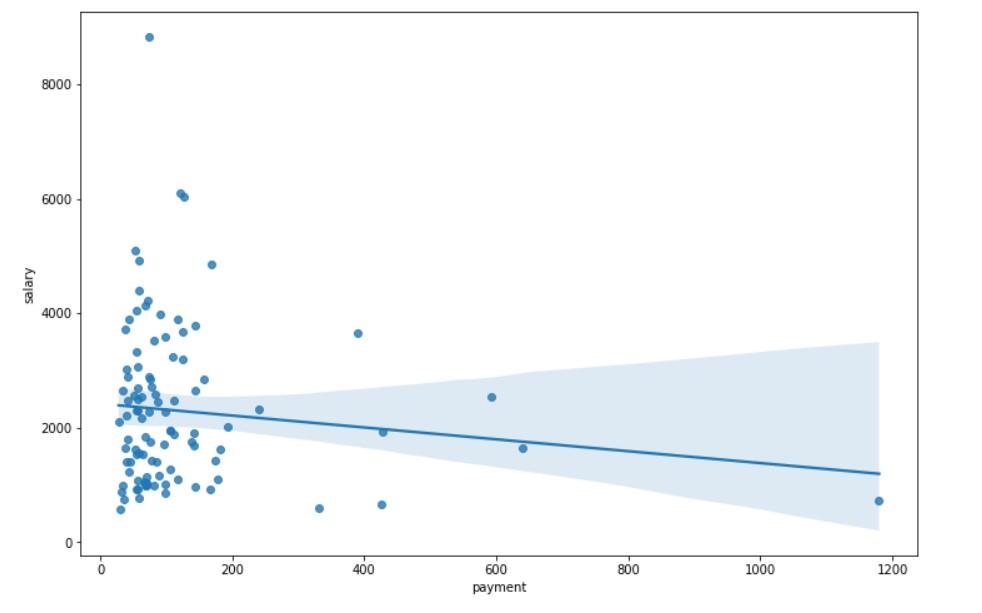
Salary vs Payments
plt.figure(figsize=(12, 8))
sns.regplot(x="payment",y= "salary", fit_reg=True, data=df)
Output:
Salary vs Point Of Sale
plt.figure(figsize=(12, 8))
sns.regplot(x="pos",y= "salary", fit_reg=True, data=df)
Output:
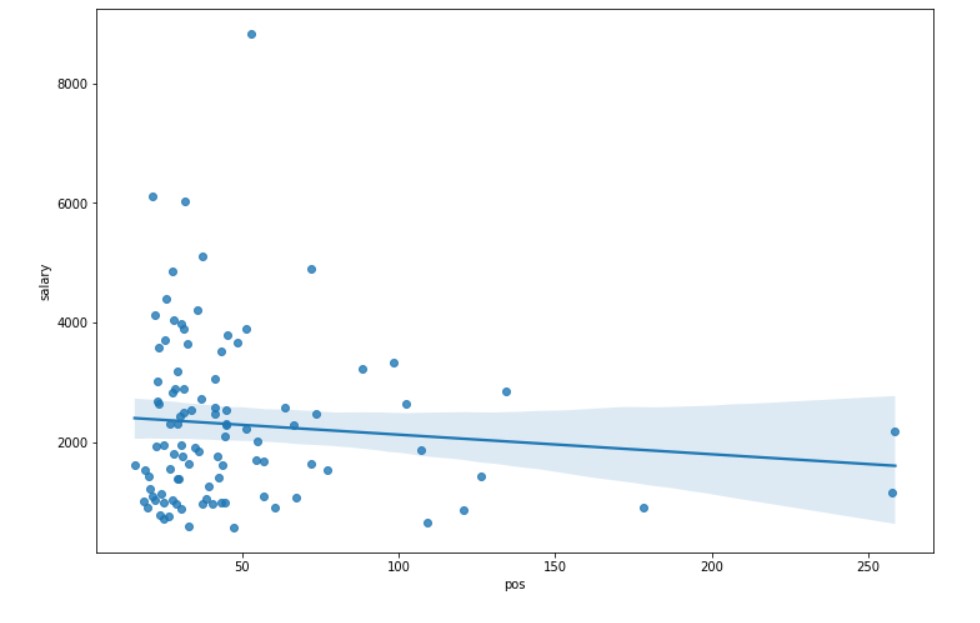
Creating scatterplots for the new features with respect to salary, There seem to be relations, but the relation is not quite clear. The main shortcoming is the lack of data. Perhaps with large amounts of data, more relations can be found.
Predicting the Salary:
Linear Regression Model:
First, we take the input and output features.
#Defining the X and y of machine learning
X=df[["age","balance","payment","pos"]].values
y=df["salary"].values
Next up is train, test and splitting.
#Train,Test splitting
X_train, X_test, y_train, y_test = train_test_split( X, y, test_size=0.2, random_state=42)
Now, we train the data on the model.
#Linear Regression model
lr = LinearRegression()
#Fitting the model
lr.fit(X_train, y_train)
The prediction is made.
#Prediction using
y_pred=lr.predict(X_test)
Calculation of R2 Score is done.
#r2 score
print('Coefficient of determination: ', r2_score(y_test, y_pred))
Output:
Coefficient of determination: 0.07666219584715894
Now, let us make a sample prediction.
#Here we make a sample prediction
#age=50
#balance=5000
#payment=100
#pos=50
#age in years and financial values in Australian Dollar
print("The model predicts salary will be=")
print(lr.predict([[60,5000,100,50]])[0])
Output:
The model predicts salary will be=
1467.1295983855507
The r2 score was low, the main reason being lack of data, hence fewer training examples.
But, making a sample prediction, the model did make predictions in realistic values, of what a person’s salary might be. So, with more data, the model could be made better.
Decision Tree Regressor
#decision tree regressor
dt = DecisionTreeRegressor()
Now, we fit the model.
#fitting the model
dt.fit(X_train, y_train)
#prediction of  test values
dt.predict(X_test)
Output:
array([1272.47, 2854.74, 3517.61, 2218.73, 3071.14, 2647.38, 6107.23,
        917.45, 1757.81, 1043.12,  576.  , 2887.34, 3026.95, 2854.74,
       3676.94, 2718.51, 2320.3 , 3676.94, 2218.73, 3517.61])
#Here we make a sample prediction
#age=50
#balance=5000
#payment=100
#pos=50
#age in years and financial values in Australian Dollar
print("The model predicts salary will be=")
print(dt.predict([[60,5000,100,50]])[0])
Output:
The model predicts salary will be=
1272.47
The Decision Tree Regressor model usually predicts lower than the Linear Regression Model. It has to be pointed out that the model has a low score due to a lack of data. Given more data, we can make the model more accurate.
Link to code: Link
Conclusion:
Banks have a lot of data, and they leverage the data to make better and more informed decisions regarding their policies and operation. With proper planning and foresight, banks and financial institutions can use data to drive change and lead to better innovation in the sector.
Reach out to me on Linkedin here.
Prateek is a dynamic professional with a strong foundation in Artificial Intelligence and Data Science, currently pursuing his PGP at Jio Institute. He holds a Bachelor's degree in Electrical Engineering and has hands-on experience as a System Engineer at TCS Digital, where he excelled in API management and data integration. Prateek also has a background in product marketing and analytics from his time with start-ups like AppleX and Milkie Way, Inc., where he was involved in growth campaigns and technical blog management. Recognized for his structured thinking and problem-solving abilities, he has received accolades like the Dr. Sudarshan Chakraborty Award for Best Student Performance. Fluent in multiple languages and passionate about technology, Prateek continues to expand his expertise in the rapidly evolving AI and tech landscape.


